. 2022 Aug 15;10(4):234-245.
eCollection 2022.

Increased COX-1 expression in benign prostate epithelial cells is triggered by mitochondrial dysfunction

Affiliations

Increased COX-1 expression in benign prostate epithelial cells is triggered by mitochondrial dysfunction

Chandler N Hudson et al. Am J Clin Exp Urol. .

Abstract

Background: Prostatic inflammation is closely linked to the development and progression of benign prostatic hyperplasia (BPH). Clinical studies of non-steroidal anti-inflammatory drugs, which inhibit cyclooxygenase-2 (COX-2), targeting prostate inflammation patients with symptomatic BPH have demonstrated conflicting results, with some studies demonstrating symptom improvement and others showing no impact. Thus, understanding the role of the cyclooxygenases in BPH and prostatic inflammation is important.

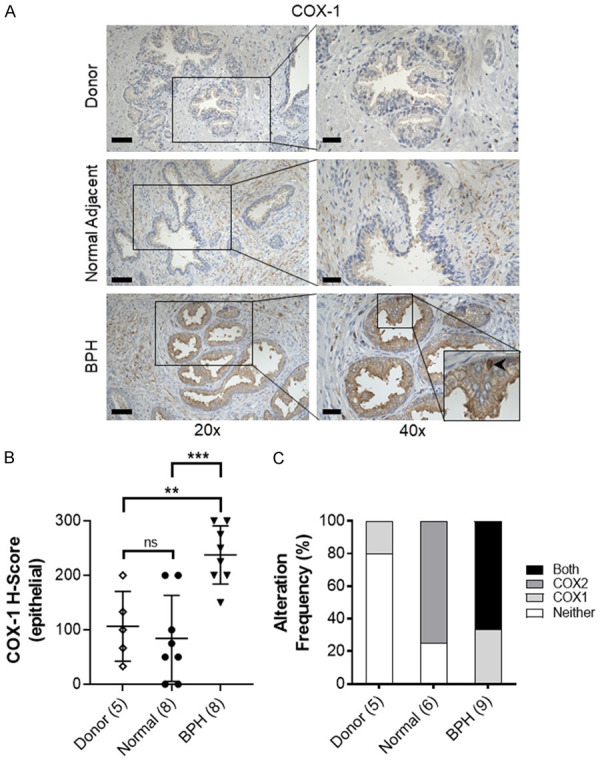
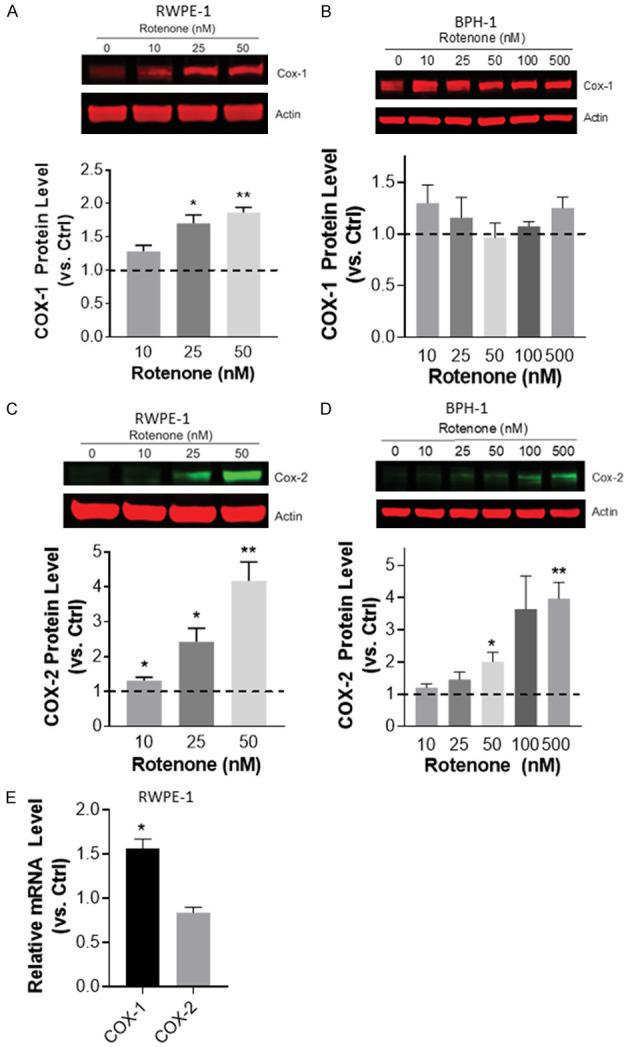
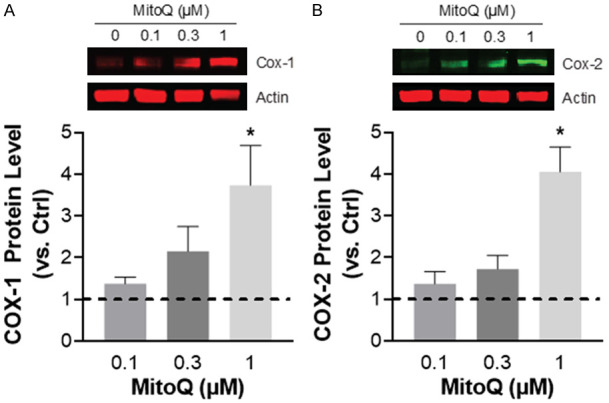
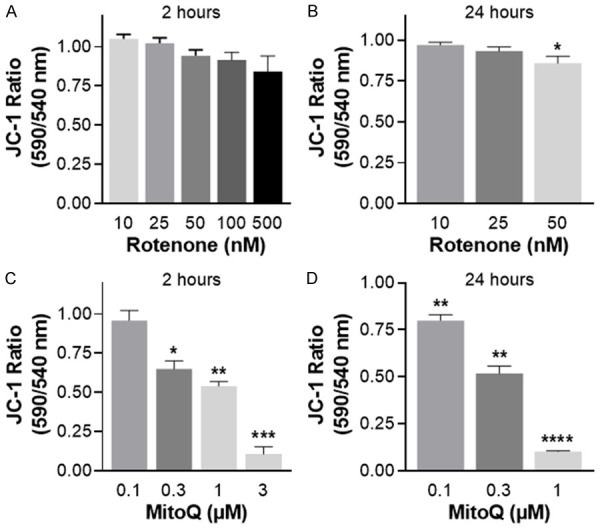
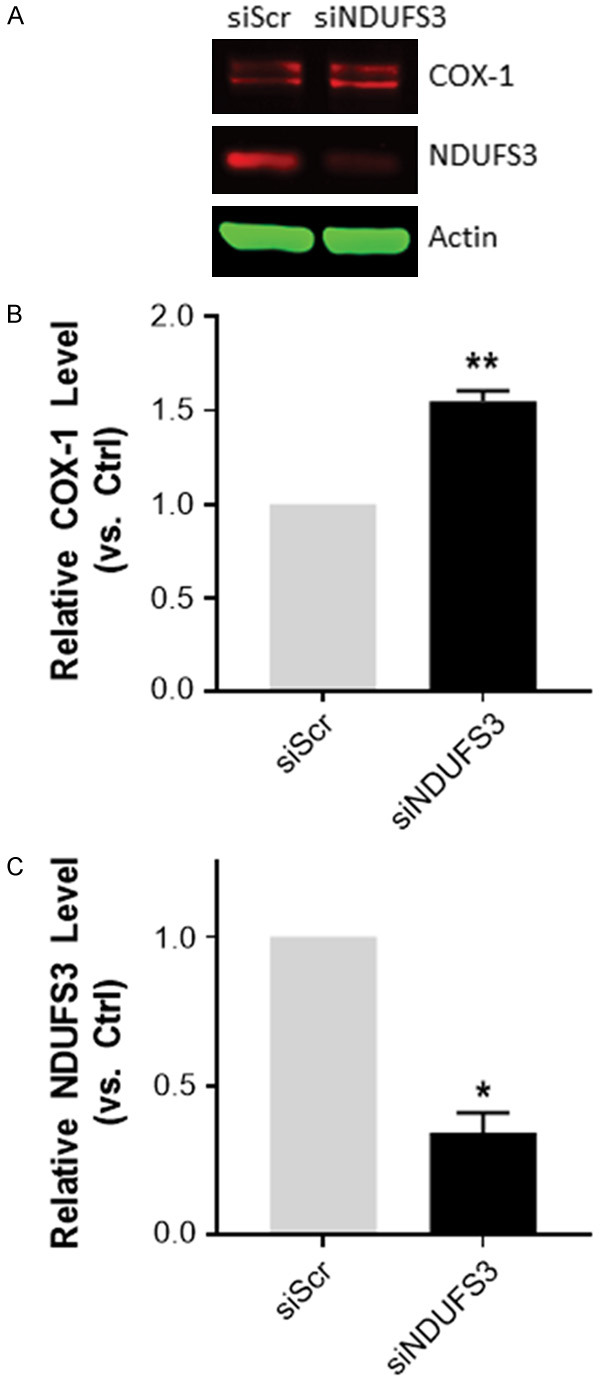
Methods: The expression of COX-1 was analyzed in a cohort of donors and BPH patients by immunohistochemistry and compared to previously determined characteristics for this same cohort. The impact of mitochondrial dysfunction on COX-1 and COX-2 was determined in experiments treating human benign prostate epithelial cell lines BPH-1 and RWPE-1 with rotenone and MitoQ. RWPE-1 cells were transfected with small interfering RNA specific to complex 1 gene NDUFS3.

Results: COX-1 expression was increased in the epithelial cells of BPH specimens compared to young healthy organ donor and normal prostate adjacent to BPH and frequently co-occurred with COX-2 alteration in BPH patients. COX-1 immunostaining was associated with the presence of CD8+ cytotoxic T-cells, but was not associated with age, prostate size, COX-2 or the presence of CD4+, CD20+ or CD68+ inflammatory cells. In cell line studies, COX protein levels were elevated following treatment with inhibitors of mitochondrial function. MitoQ significantly decreased mitochondrial membrane potential in RWPE-1 cells. Knockdown of NDUFS3 stimulated COX-1 expression.

Conclusion: Our findings suggest COX-1 is elevated in BPH epithelial cells and is associated with increased presence of CD8+ cytotoxic T-cells. COX-1 can be induced in benign prostate epithelial cells in response to mitochondrial complex I inhibition, and knockdown of the complex 1 protein NDUFS3. COX-1 and mitochondrial dysfunction may play more of a role than previously recognized in the development of age-related benign prostatic disease.

Keywords: BPH; COX-1; COX-2; aging; prostate inflammation.


Conflict of interest statement

None.

Figures

Figure 1
Figure 1
Expression of COX-1 in the prostate. (A) Representative immunostaining of COX-1 (brown) expression in young healthy donor (Donor), normal adjacent to BPH prostate (Normal Adjacent) and BPH specimens. Scale bars indicate 100 µm in 20×, 50 µm in 40×. BPH inset, bottom right, showing nuclear COX-1 staining (black arrow). (B) Quantification of mean COX-1 staining intensity H-score in prostate epithelial cells. (C) Alteration frequency of specimens with no alteration in COX-1 or COX-2 expression (Neither), upregulated COX-1 (COX1), upregulated COX-2 (COX2), or concurrent upregulation of COX-1 and COX-2 in Donor, Normal Adjacent and BPH specimens. Scoring was quantified for patients with both COX-1 and COX-2 immunostaining scores; specimens missing either COX-1 or COX-2 data were not included. Number of patients in parentheses. Data represent mean ± S.D.; ns, not significant, **P < 0.01; ***P < 0.001.
Figure 2
Figure 2
Induction of COX expression by rotenone in benign prostate epithelial cells in vitro. (A) Western blot analysis of COX-2 protein expression levels following rotenone treatment of (A) RWPE-1 and (B) BPH-1 cells for 48 h. (C) COX-1 expression following rotenone treatment for 48 h in RWPE-1 and (D) BPH-1 cells. Band intensities were quantified and the ratios of COX protein relative to actin were normalized to untreated control (ctrl, dashed line). Data were calculated from at least 3 independent experiments. *P < 0.05 and **P < 0.01. (E) qPCR analysis of COX-1 and COX-2 mRNA expression in RWPE-1 cells following 24 h of treatment with 25 nM rotenone. Expression in treated cells shown as relative to untreated control cells (Ctrl, dashed line). Data represent mean ± S.E.M. *p < 0.05 and **P < 0.01.
Figure 3
Figure 3
Induction of COX expression by MitoQ in the RWPE-1 benign prostate epithelial cell line. (A) Western blot analysis of COX-1 and (B) COX-2 protein expression levels following MitoQ treatment (1 µM) for 48 hours. Results are from 4-5 independent experiments. (Ctrl, dashed line). Data represent mean ± S.E.M. *P < 0.05.
Figure 4
Figure 4
Loss of mitochondrial membrane potential (ΔΨm) induced by rotenone or MitoQ in RWPE-1 cells, measured by quantitative analysis of JC-1 fluorescence. (A) Impact of rotenone treatment after 2 h, or (B) 24 h. (C) Impact of MitoQ treatment after 2 h, or (D) 24 h. Data are expressed relative to untreated control cells 3-4 independent experiments. Data represent mean ± S.E.M. *P < 0.05, **P < 0.01, ***P < 0.001 and ****P < 0.0001.
Figure 5
Figure 5
Induction of COX-1 protein expression in response to NDUFS3 siRNA knock-down in RWPE-1 cells. (A) Western blot analysis of COX-1 and NDUFS3 expression in RWPE-1 cells following 48 h NDUFS3 siRNA-transfection cells (ND3), control cells were treated with a scramble control (Scr). (B) Quantification of band intensities and the ratios of COX-1, and (C) NDUFS3 protein relative to actin were normalized to siRNA scramble control. Final siRNA concentration was 25 nM. Data were calculated from at least 3 independent experiments. *P < 0.05 and **P < 0.01. Data represent mean ± S.E.M. *P < 0.05 and **P < 0.01.

References

    1. Vuichoud C, Loughlin KR. Benign prostatic hyperplasia: epidemiology, economics and evaluation. Can J Urol. 2015;22(Suppl 1):1–6. - PubMed
    1. Barrack ER, Berry SJ. DNA synthesis in the canine prostate: effects of androgen and estrogen treatment. Prostate. 1987;10:45–56. - PubMed
    1. Nickel JC. Inflammation and benign prostatic hyperplasia. Urol Clin North Am. 2008;35:109–115. - PMC - PubMed
    1. Schauer IG, Rowley DR. The functional role of reactive stroma in benign prostatic hyperplasia. Differentiation. 2011;82:200–210. - PMC - PubMed
    1. Schauer IG, Ressler SJ, Tuxhorn JA, Dang TD, Rowley DR. Elevated epithelial expression of interleukin-8 correlates with myofibroblast reactive stroma in benign prostatic hyperplasia. Urology. 2008;72:205–213. - PMC - PubMed

LinkOut - more resources