

Temporal and spatial characterization of myopia in China
- PMID: 36052009
- PMCID: PMC9424616
- DOI: 10.3389/fpubh.2022.896926
Temporal and spatial characterization of myopia in China
Abstract
Purpose: The aim of this study was to characterize the temporal and spatial distribution of myopia among students aged 7-18 years, by analyzing the aggregation area and providing the basis for the prevention and control of myopia in China.
Methods: A database for the spatial analysis of myopia in China during 1995-2014 was established using ArcGIS10.0 software as a platform for data management and presentation. A spatial autocorrelation analysis of myopia was undertaken, and a temporal and spatial scan analysis was performed using SaTScan9.5 software.
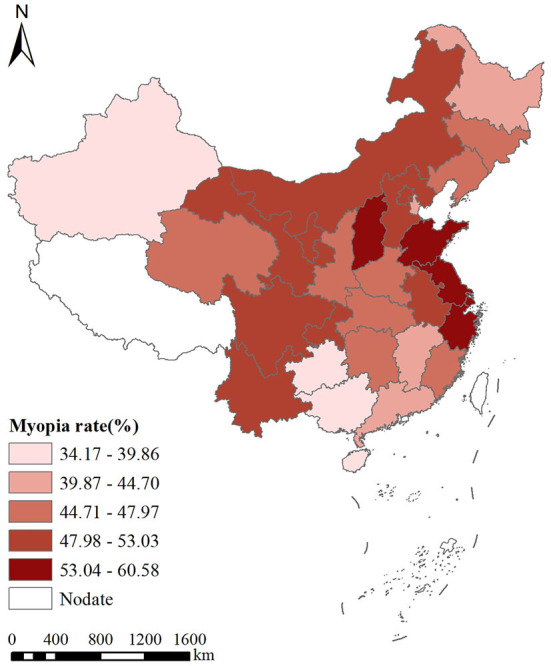
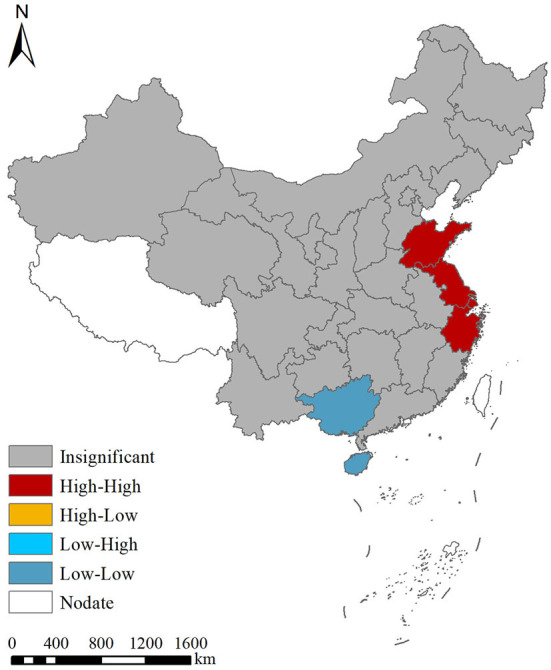
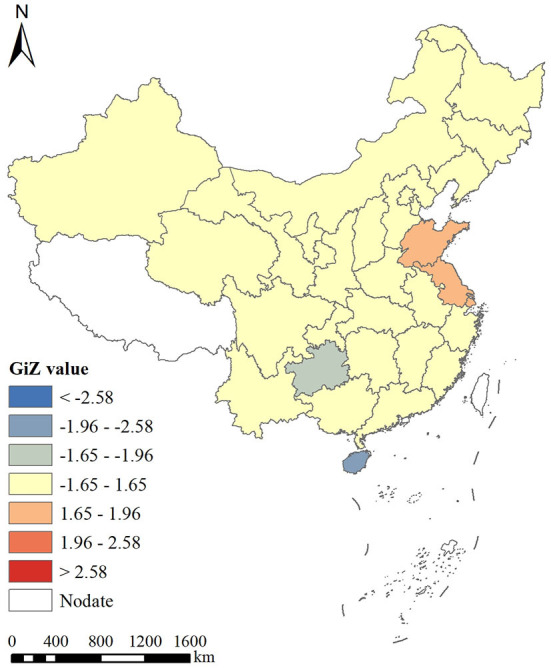
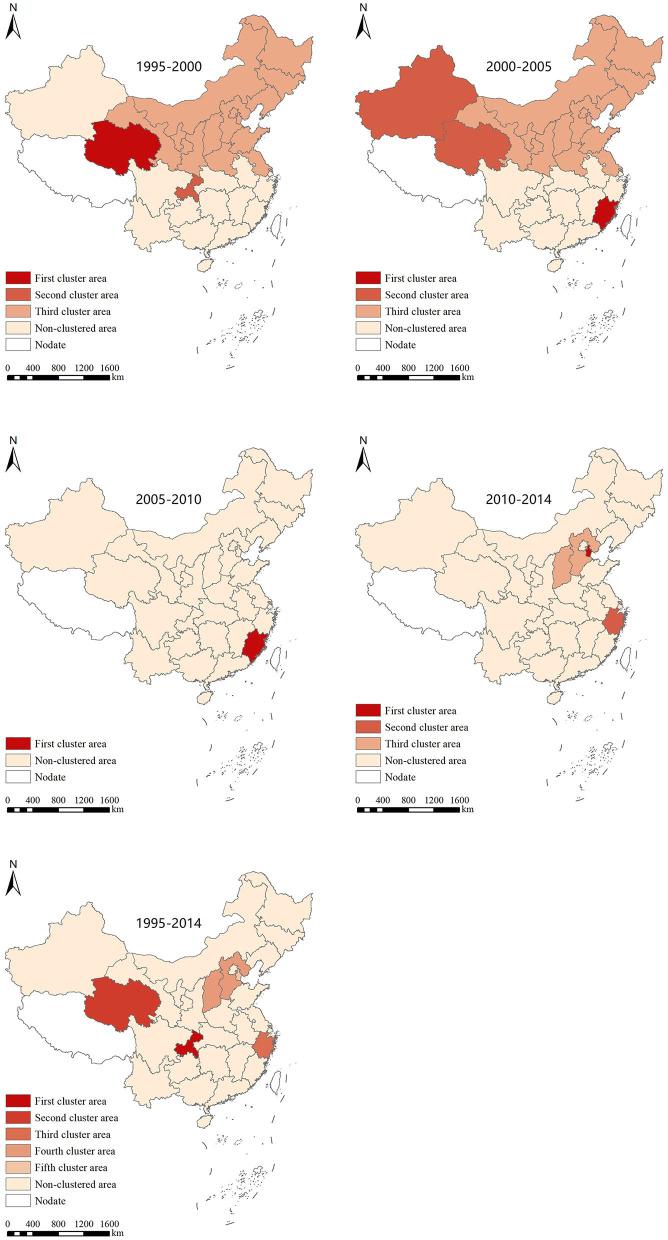
Results: Our data demonstrated that the prevalence of myopia in China in 1995, 2000, 2005, 2010, and 2014 was 35.9, 41.5, 48.7, 57.3, and 57.1%, respectively, thus indicating a gradual upward trend. The prevalence of myopia was analyzed in various provinces (municipalities and autonomous regions), and the highest was found in Jiangsu Province, with an average Moran's I index of 0.244295 in China (P ≤ 0.05). According to the local Moran's I autocorrelation analysis, there was a spatial aggregation of myopia prevalence among students in the entire country, with Shandong, Jiangsu, Anhui, and Shanghai being classified as high-high aggregation areas, while Hainan and Guangxi were classified as low-low aggregation areas. In addition, the Getis-Ord General G results of the global hotspot analysis showed a countrywide myopia prevalence index of 0.035020 and a Z score of 1.7959 (P = 0.07251). Because the myopia prevalence correlation difference was not statistically significant, there were no "positive hotspots" or "negative hotspots." The local hotspot analysis shows that Shandong and Jiangsu belong to high-value aggregation areas, while Hainan and Guizhou belong to low-value aggregation areas. Further analysis using time-space scanning showed 15 aggregation regions in five stages, with four aggregation regions having statistically significant differences (P ≤ 0.05). However, the aggregation range has changed over time. Overall, from 1995 to 2014, the aggregation areas for the myopia prevalence in Chinese students have shifted from the northwest, north, and northeast regions to the southeast regions.
Conclusion: Our data demonstrate that, from 1995 to 2014, the prevalence of myopia increased in students aged 7-18 years in China. In addition, the prevalence of myopia is randomly distributed in various provinces (municipalities and autonomous regions) and exhibits spatial aggregation. Also, the gathering area is gradually shifting to the southeast, with the existence of high-risk areas. It is, therefore, necessary to focus on this area and undertake targeted prevention and control measures.
Keywords: China; geographic information system; myopia; spatial autocorrelation analysis; spatiotemporal analysis.
Copyright © 2022 Shi, Gao, Leng and Guo.
Conflict of interest statement
The authors declare that the research was conducted in the absence of any commercial or financial relationships that could be construed as a potential conflict of interest.
Figures
References
-
- Chen S. The Overall Myopia Rate of Children and Adolescents in China is 52.7% in 2020. Beijing: China Women's Daily; (2021).
Publication types
MeSH terms
LinkOut - more resources
Full Text Sources