. 2022 Aug 16:13:977894.
doi: 10.3389/fimmu.2022.977894. eCollection 2022.

SIRGs score may be a predictor of prognosis and immunotherapy response for esophagogastric junction adenocarcinoma

Affiliations

SIRGs score may be a predictor of prognosis and immunotherapy response for esophagogastric junction adenocarcinoma

Li-Ying OuYang et al. Front Immunol. .

Abstract

Background: Esophagogastric junction adenocarcinoma (EGJA) is a special malignant tumor with unknown biological behavior. PD-1 checkpoint inhibitors have been recommended as first-line treatment for advanced EGJA patients. However, the biomarkers for predicting immunotherapy response remain controversial.

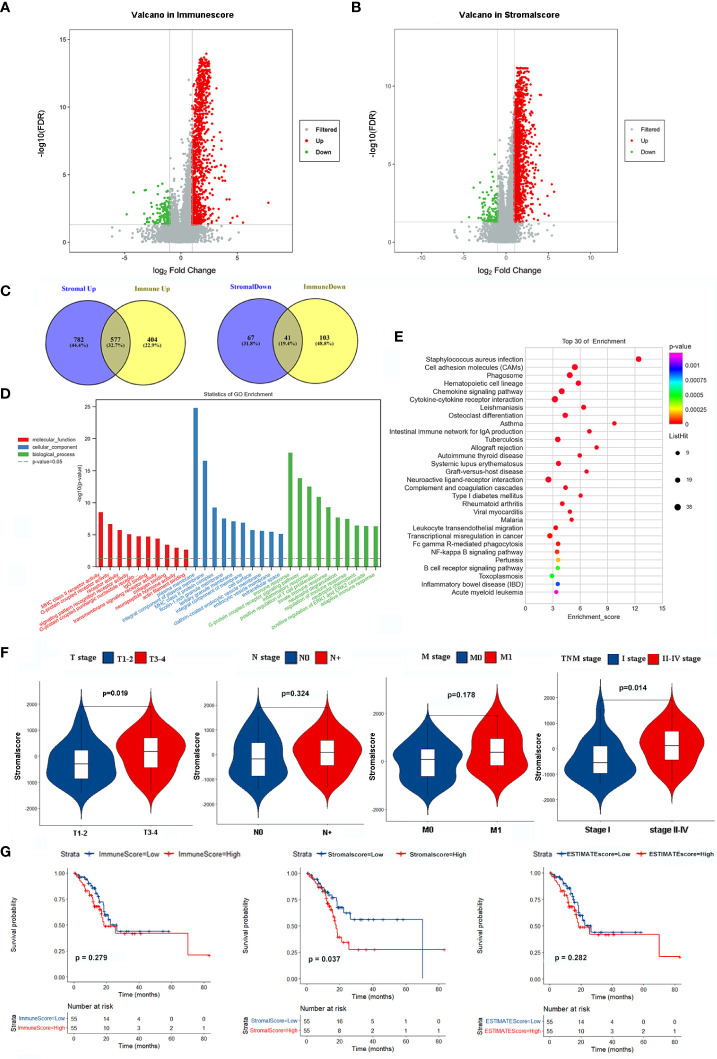
Methods: We identified stromal immune-related genes (SIRGs) by ESTIMATE from the TCGA-EGJA dataset and constructed a signature score. In addition, survival analysis was performed in both the TCGA cohort and GEO cohort. Subsequently, we explored the differences in tumor-infiltrating immune cells, immune subtypes, immune-related functions, tumor mutation burden (TMB), immune checkpoint gene expression, immunophenoscore (IPS) between the high SIRGs score and low SIRGs score groups. Finally, two validation cohorts of patients who had accepted immunotherapy was used to verify the value of SIRGs score in predicting immunotherapy response.

Results: Eight of the SIRGs were selected by LASSO regression to construct a signature score (SIRGs score). Univariate and multivariate analyses in the TCGA and GEO cohort suggested that SIRGs score was an independent risk factor for the overall survival (OS) and it could increase the accuracy of clinical prediction models for survival. However, in the high SIRGs score group, patients had more immune cell infiltration, more active immune-related functions, higher immune checkpoint gene expression and higher IPS-PD1 and IPS-PD1-CTLA4 scores, which indicate a better response to immunotherapy. The external validation illustrated that high SIRGs score was significantly associated with immunotherapy response and immune checkpoint inhibitors (ICIs) can improve OS in patients with high SIRGs score.

Conclusion: The SIRGs score may be a predictor of the prognosis and immune-therapy response for esophagogastric junction adenocarcinoma.

Keywords: SIRGs score; esophagogastric junction adenocarcinoma; immunotherapy; prognosis; tumor microenvironment.


Conflict of interest statement

The authors declare that the research was conducted in the absence of any commercial or financial relationships that could be construed as a potential conflict of interest.

Figures

Figure 1
Figure 1
Identification SIRGs and enrichment analyses. (A) Volcano plot of DEGs in immunescore; (B) Volcano plot of DEGs in stromalscore; (C) Venn plot to identify SIRGs; (D) GO enrichment analysis; (E) KEGG pathway enrichment analysis; (F) The relationship between stromalscore and TNM stage; (G) Kaplan-Meier analysis in different groups.
Figure 2
Figure 2
Construction of SIRGs score by LASSO analysis. (A, B) The LASSO Cox analysis identified that eight core SIRGs were associated with the prognosis of EGJA patients; (C) Forest plot of hazard ratios for eight core prognostic SIRGs; (D, E) GSEA analysis in high SIRGs score group; (F, G) GSEA analysis in high SIRGs score group.
Figure 3
Figure 3
Survival analysis of SIRGs score in TCGA cohort and GEO cohort. (A, E) The rank of SIRGs scores; (B, F) The distribution of SIRGs score and overall survival time; (C, G) The heatmap of expression patterns of 8 SIRGs in low- and high-SIRGs score group; (D, H) Survival curves of different SIRGs score group.
Figure 4
Figure 4
Establishment SIRGs score-based nomogram for predicting EGJA patients’ prognosis. (A) Forest plot presenting univariate Cox regression analysis result; (B) Forest plot presenting multivariate Cox regression analysis result; (C) SIRGs score-based nomogram; (D) AUC values of ROC predicted 1-year OS rates of Nomogram, SIRGs score and TNM stage; (E) AUC values of ROC predicted 3-year OS rates of Nomogram, SIRGs score and TNM stage.
Figure 5
Figure 5
The difference TME in low- and high-SIRGs score group. (A) Relative proportion of immune infiltration in each EGJA patients; (B) The relationship in different immune infiltration cells; (C) Identify four immune subtypes by unsupervised clustering according to the immune infiltration state; (D) The difference infiltration immune cells in four immune subtypes; (E) The distribution of four immune subtypes in low- and high-SIRGs score group; (F) Immune-related functions analysis in in low- and high-SIRGs score group. *p<0.05, **p<0.01, ***p<0.001, ns, not significant.
Figure 6
Figure 6
The mutation profile and TMB in low- and high-SIRGs score group. (A) Mutation profile of EGJA patients in high SIRGs score groups; (B) Mutation profile of EGJA patients in low SIRGs score groups; (C) The summary of mutation in high SIRGs score groups; (D) The summary of mutation in low SIRGs score groups; (E) The distribution of TMB in low- and high-SIRGs score group; (F) The association of TMB and OS.
Figure 7
Figure 7
The estimation and validation of two SIRGs score groups in immunotherapy response. (A-F) The different expression of six immune checkpoint molecules (CD274, CTLA4, HAVCR2, LAG3, TIGIT, PDCD1) in different SIRGs score groups; (G) The association between IPS and SIRGs score; (H) The different immunotherapy response between two SIRGs score groups in advanced clear cell renal cell carcinoma cohort; (I) The association between SIRGs score and OS in advanced clear cell renal cell carcinoma cohort; (J) The different immunotherapy response between two SIRGs score groups in melanoma cohort; (K) The association between SIRGs score and OS in melanoma a cohort.

References

    1. Ichihara S, Uedo N, Gotoda T. Considering the esophagogastric junction as a 'zone'. Digestive Endoscopy (2017) 29 Suppl 2:3–10. doi: 10.1111/den.12792 - DOI - PubMed
    1. Liu K, Zhang W, Chen X, Chen X, Yang K, Zhang B, et al. . Comparison on clinicopathological features and prognosis between esophagogastric junctional adenocarcinoma (Siewert II/III types) and distal gastric adenocarcinoma: Retrospective cohort study, a single institution, high volume experience in China. Medicine (2015) 94(34):e1386. doi: 10.1097/MD.0000000000001386 - DOI - PMC - PubMed
    1. Ito H, Inoue H, Odaka N, Satodate H, Suzuki M, Mukai S, et al. . Clinicopathological characteristics and optimal management for esophagogastric junctional cancer; a single center retrospective cohort study. J Exp Clin Cancer Res CR (2013) 32(1):2. doi: 10.1186/1756-9966-32-2 - DOI - PMC - PubMed
    1. Huang Q. Carcinoma of the gastroesophageal junction in Chinese patients. World J Gastroenterol (2012) 18(48):7134–40. doi: 10.3748/wjg.v18.i48.7134 - DOI - PMC - PubMed
    1. Janjigian YY, Shitara K, Moehler M, Garrido M, Salman P, Shen L, et al. . First-line nivolumab plus chemotherapy versus chemotherapy alone for advanced gastric, gastro-oesophageal junction, and oesophageal adenocarcinoma (CheckMate 649): a randomised, open-label, phase 3 trial. Lancet (London England) (2021) 398(10294):27–40. doi: 10.1016/S0140-6736(21)00797-2 - DOI - PMC - PubMed

Publication types

Substances

Supplementary concepts

LinkOut - more resources