. 2022 Oct;21(10):e13696.
doi: 10.1111/acel.13696. Epub 2022 Sep 2.

Umbilical cord plasma concentrate has beneficial effects on DNA methylation GrimAge and human clinical biomarkers

Affiliations

Umbilical cord plasma concentrate has beneficial effects on DNA methylation GrimAge and human clinical biomarkers

James Clement et al. Aging Cell. 2022 Oct.

Abstract

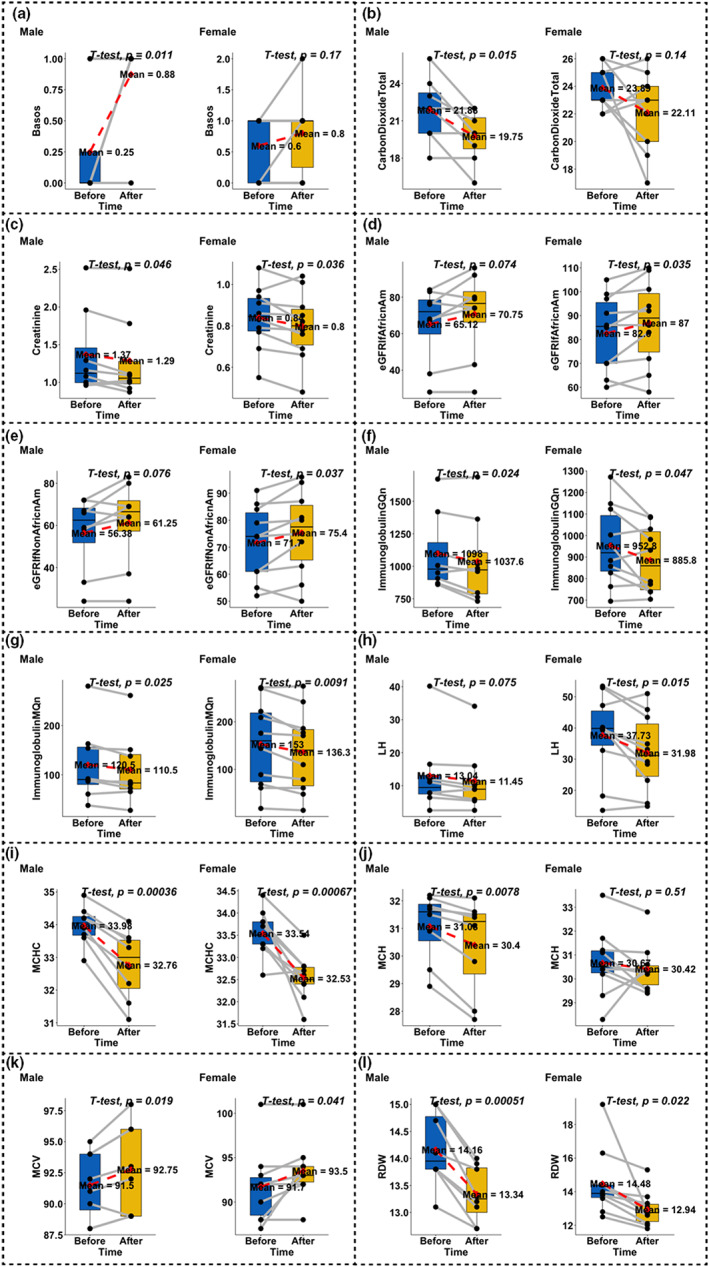
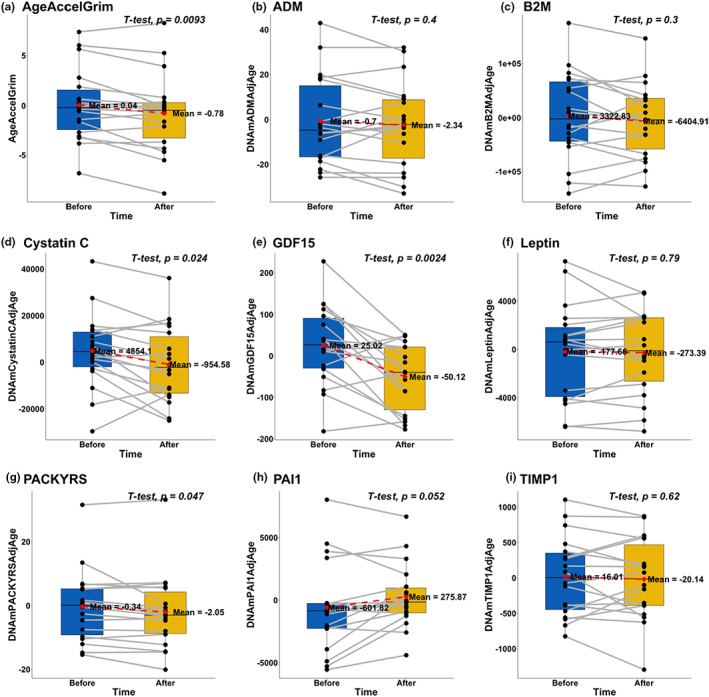
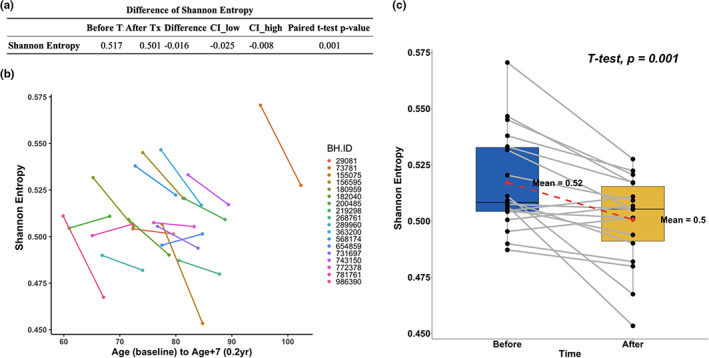
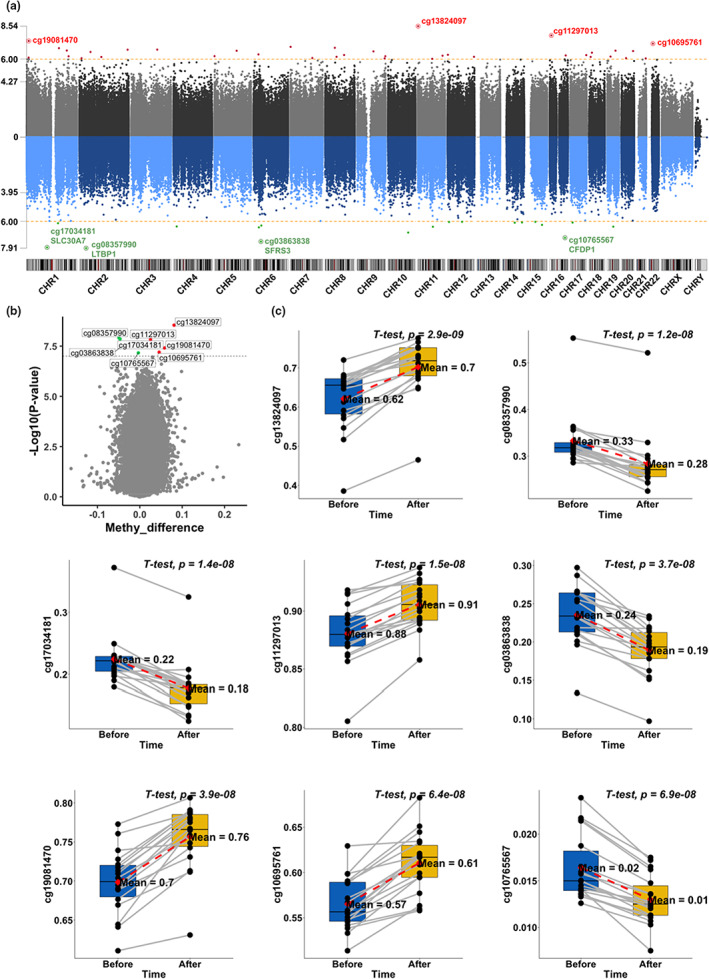
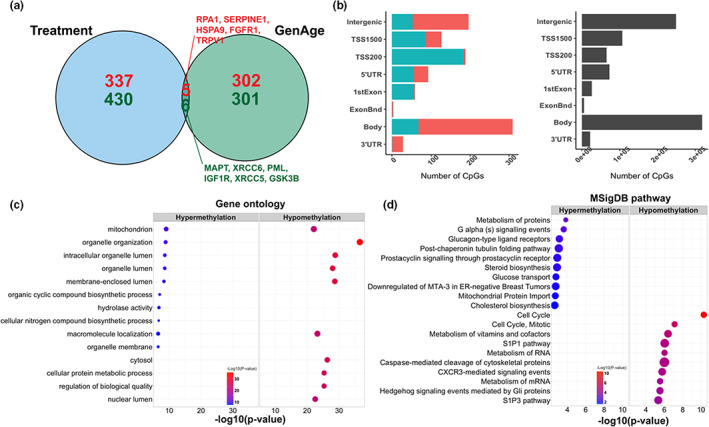
Plasma transfusions are standard treatments to replace missing proteins in people with rare genetic diseases. Prior studies have demonstrated that heterochronic parabiosis has beneficial effects on several tissues of old animals receiving young blood. Human clinical trials are currently underway to investigate whether the infusion of plasma or plasma-derived factors from young donors can be used to mitigate human age-related conditions. Here, we use data from a safety study (n = 18, mean age 74) to investigate whether human umbilical cord plasma concentrate (hereinafter Plasma Concentrate) injected weekly (1 ml intramuscular) into elderly human subjects over a 10-week period affects different biomarkers, including epigenetic age measures, standard clinical biomarkers of organ dysfunction, mitochondrial DNA copy number (mtDNA-CN), and leukocyte telomere length. This study shows that treatment with plasma concentrate is safe. More than 20 clinical biomarkers were significantly and beneficially altered following the treatments. For example, creatinine was significantly decreased (p = 0.0039), while estimated glomerular filtration rate (eGFR) was increased (p = 0.0044), indicating the treatment may improve biomarkers of kidney function. Three of four immunoglobulin biomarkers decreased, while telomere length and mtDNA-CN were not significantly affected by the treatment. The treatment reduced DNA methylation-based GrimAge by an average of 0.82 years (p = 0.0093), suggests a reduction in morbidity and mortality risk. By contrast, no significant results could be observed for epigenetic clocks that estimate chronological age. Our results support the view that plasma concentrate contains youth-promoting factors.

Keywords: clinical trial; epigenetic clocks; exosome treatment; umbilical cord plasma; young plasma.


Conflict of interest statement

James Clement is a founder of Betterhumans Inc., a nonprofit medical research organization with offices in Gainesville, FL and Tyler, Texas focused on slowing and reversing the detrimental effects of aging. Robert T. Brooke and Steve Horvath are founders of the nonprofit Epigenetic Clock Development Foundation. The Clock foundation licenses inventions and patents surrounding epigenetic clocks from UC Regents. These patents list Steve Horvath as inventor.

Figures

FIGURE 1
FIGURE 1
Evaluation of clinical biomarkers. We only present results for biomarkers that led to an unadjusted significance level of p < 0.01. The x‐axis represents before and after the treatment. Two dots connected by gray lines represent the same participant. p‐values were derived from paired t‐tests. Males and females were tested separately. (a) Basophils, (b) carbon dioxide (total amount), (c) creatinine, (d) estimated glomerular filtration rate (African American), (e) estimated glomerular filtration rate (non‐African American), (f) immunoglobulin G, quantitative, (g) immunoglobulin M, quantitative, (h) luteinizing hormone, (i) mean corpuscular hemoglobin concentration, (j) mean corpuscular hemoglobin, (k) mean corpuscular volume, and (l) red blood cell distribution width
FIGURE 2
FIGURE 2
Treatment effect on GrimAge age acceleration (AgeAccelGrim) and its components. (a) Grim AgeAccel is defined as the raw residuals derived from regression models of DNAmGrimAge on chronological age. (b–i) 8 GrimAge components: DNAm‐based estimators of (b) adrenomedullin (ADM), (c) beta‐2‐microglobulin (B2M), (d) cystatin C (cystatin C), (e) growth differentiation factor‐15 (GDF15), (f) leptin, (g) smoking pack‐years (PACKYRS), (h) PAI‐1 (PAI1), and (i) tissue inhibitor metalloproteinases 1 (TIMP1), respectively. Two‐sided uncorrected p‐values were derived from paired student's t‐tests
FIGURE 3
FIGURE 3
Changes in methylation entropy. (a) Results of the paired t‐test. (b) Spaghetti plots. Age after treatment is represented by artificially calculating 7 additional years for better visualization. (c) Paired boxplot. The y‐axis shows the Shannon entropy level. Uncorrected two‐sided p‐value was calculated with a paired Student's t‐test.
FIGURE 4
FIGURE 4
EWAS of treatment effects. Manhattan plot (a) shows the significance of the associations between individual cytosine methylation levels and the treatment. The y‐axis shows the –log10 transformed p‐value from a paired student's t‐test. Red and green dots represent CpGs that gained or lost methylation with the treatment, respectively. Volcano plot (b) shows the p‐values and changes in methylation level in response to the treatment. The y‐axis shows the ‐log10(p). The x‐axis shows the mean difference in methylation level before and after the treatment for each CpG. In addition, paired boxplots (c) of top CpGs with raw p < 1E‐7. The y‐axis shows the methylation level.
FIGURE 5
FIGURE 5
Functional enrichment analyses of treatment‐related CpGs. Venn diagram (a) shows the overlap between genes within the GenAge database and genes annotated to the top 500 hyper /hypomethylated CpGs in our study. (b) Location of the top CpGs relative to the closest transcriptional start site. The gray color in the right panel represents the location of all EPIC array probes mapped to the human hg38 genome. (c–d) Gene ontology and MSigDB pathway enrichment analysis based on GREAT. The left panel shows the top enriched GO terms based on the top 500 hyper/hypomethylated CpGs. In addition, the right panel shows the top enriched MSigDB pathways. The size of the dot represents the enrichment ratio. GO terms were simplified for easier interpretation by calculating the similarity of GO terms and removing those highly similar terms using rrvgo.

References

    1. Aryee, M. J. , Jaffe, A. E. , Corrada‐Bravo, H. , Ladd‐Acosta, C. , Feinberg, A. P. , Hansen, K. D. , & Irizarry, R. A. (2014). Minfi: A flexible and comprehensive Bioconductor package for the analysis of Infinium DNA methylation microarrays. Bioinformatics, 30, 1363–1369. - PMC - PubMed
    1. Castellano, J. M. , Mosher, K. I. , Abbey, R. J. , Mcbride, A. A. , James, M. L. , Berdnik, D. , Shen, J. C. , Zou, B. , Xie, X. S. , Tingle, M. , Hinkson, I. V. , Angst, M. S. , & Wyss‐Coray, T. (2017). Human umbilical cord plasma proteins revitalize hippocampal function in aged mice. Nature, 544, 488–492. - PMC - PubMed
    1. Chen, E. Y. , Tan, C. M. , Kou, Y. , Duan, Q. , Wang, Z. , Meirelles, G. V. , Clark, N. R. , & Ma'Ayan, A. (2013). Enrichr: Interactive and collaborative HTML5 gene list enrichment analysis tool. BMC Bioinformatics, 14, 128. - PMC - PubMed
    1. Conboy, I. M. , Conboy, M. J. , Wagers, A. J. , Girma, E. R. , Weissman, I. L. , & Rando, T. A. (2005). Rejuvenation of aged progenitor cells by exposure to a young systemic environment. Nature, 433, 760–764. - PubMed
    1. Daniels, L. B. , Clopton, P. , Laughlin, G. A. , Maisel, A. S. , & Barrett‐Connor, E. (2011). Growth‐differentiation Factor‐15 is a robust, independent predictor of 11‐year mortality risk in community‐dwelling older adults. Circulation, 123, 2101–2110. - PMC - PubMed

Publication types