. 2022 Sep 2:1-12.
doi: 10.1017/S1431927622012272. Online ahead of print.

Energy-Dispersive X-Ray Spectrum Simulation with NIST DTSA-II: Comparing Simulated and Measured Electron-Excited Spectra

Affiliations

Energy-Dispersive X-Ray Spectrum Simulation with NIST DTSA-II: Comparing Simulated and Measured Electron-Excited Spectra

Dale E Newbury et al. Microsc Microanal. .

Abstract

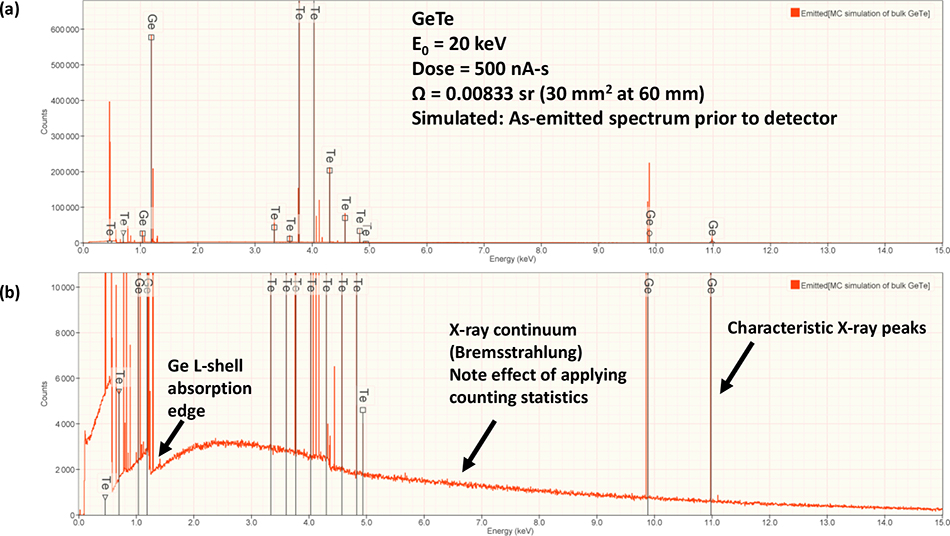
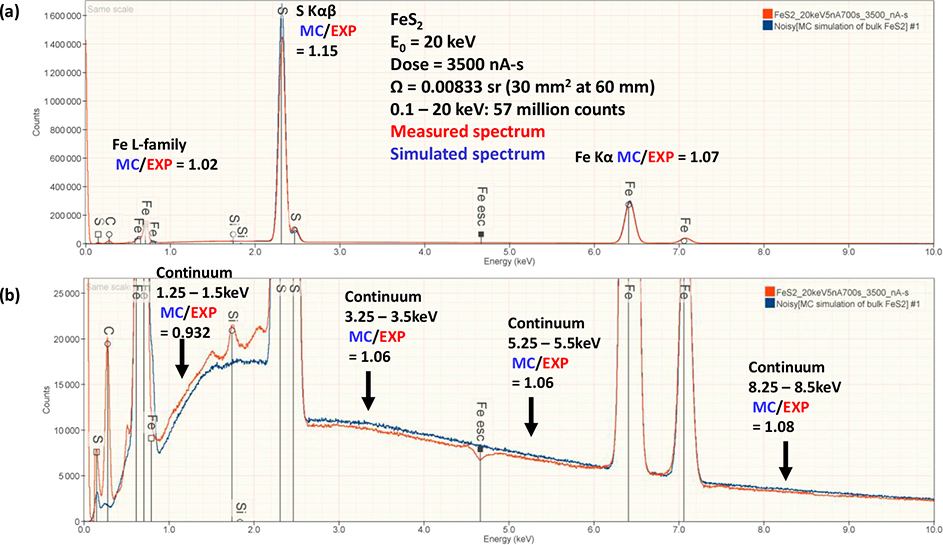
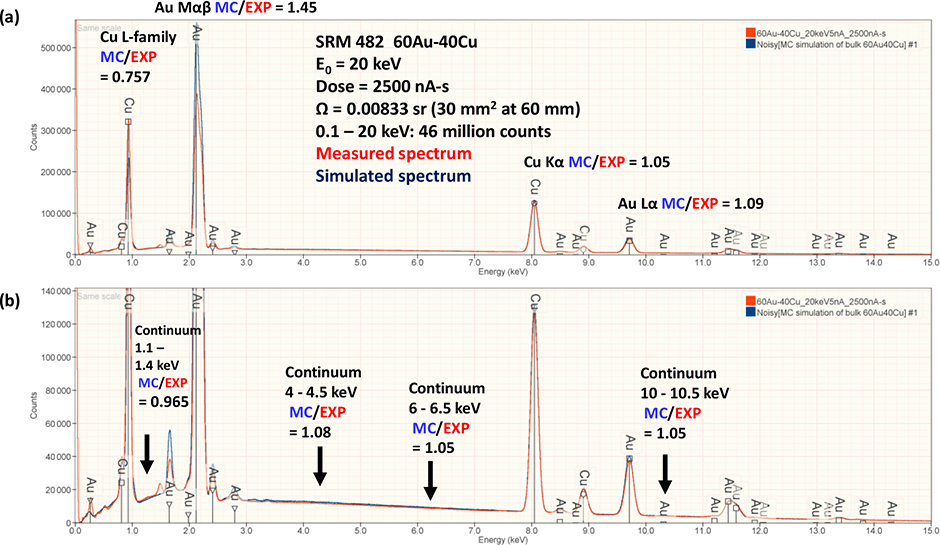
Electron-excited X-ray microanalysis with energy-dispersive spectrometry (EDS) proceeds through the application of the software that extracts characteristic X-ray intensities and performs corrections for the physics of electron and X-ray interactions with matter to achieve quantitative elemental analysis. NIST DTSA-II is an open-access, fully documented, and freely available comprehensive software platform for EDS quantification, measurement optimization, and spectrum simulation. Spectrum simulation with DTSA-II enables the prediction of the EDS spectrum from any target composition for a specified electron dose and for the solid angle and window parameters of the EDS spectrometer. Comparing the absolute intensities for measured and simulated spectra reveals correspondence within ±25% relative to K-shell and L-shell characteristic X-ray peaks in the range of 1–11 keV. The predicted M-shell intensity exceeds the measured value by a factor of 1.4–2.2 in the range 1–3 keV. The X-ray continuum (bremsstrahlung) generally agrees within ±10% over the range of 1–10 keV. Simulated EDS spectra are useful for developing an analytical strategy for challenging problems such as estimating trace detection levels.

Keywords: EDS simulation; NIST DTSA-II software; electron-excited X-ray microanalysis; elemental analysis; energy-dispersive spectrometry (EDS).


Figures

Figure 1.
Figure 1.
Simulated EDS spectrum emitted from GeTe at E0 =20 keV: (a) displayed with full intensity range, showing the narrow characteristic X-ray peaks; (b) expanded intensity scale showing the bremsstrahlung background.
Figure 2.
Figure 2.
Simulated EDS spectrum of GeTe at E0 =20 keV after EDS detection showing the effect of the EDS resolution function broadening the characteristic X-ray peaks: (a) spectrum shown for the photon energy range 0 – 15 keV with full intensity range; (b) spectrum shown for the region of the Te L-family peaks with expanded intensity scale.
Figure 3.
Figure 3.
(a) Comparison of the simulated and measured EDS spectra of GeTe at E0 =20 keV with the intensity ratio Monte Carlo/Experimental (“MC/EXP”) shown for the principal characteristic X-ray peaks; (b) expanded intensity scale showing comparison MC/EXP of the bremsstrahlung X-ray intensity in selected energy regions.
Figure 4.
Figure 4.
(a) Comparison of the simulated and measured EDS spectra of FeS2 at E0 =20 keV with the intensity ratio Monte Carlo/Experimental (“MC/EXP”) shown for the principal characteristic X-ray peaks; (b) expanded intensity scale showing comparison MC/EXP of the bremsstrahlung X-ray intensity in selected energy regions.
Figure 5.
Figure 5.
(a) Comparison of the simulated and measured EDS spectra of SRM 482: 60Au-40Cu alloy at E0 = 20 keV with the intensity ratio Monte Carlo/Experimental (“MC/EXP”) shown for the principal characteristic X-ray peaks; (b) expanded intensity scale showing comparison MC/EXP of the bremsstrahlung X-ray intensity in selected energy regions.
Figure 6.
Figure 6.
(a) Comparison of the simulated and measured EDS spectra of PbSe at E0 =20 keV with the intensity ratio Monte Carlo/Experimental (“MC/EXP”) shown for the principal characteristic X-ray peaks; (b) expanded intensity scale showing comparison MC/EXP of the bremsstrahlung X-ray intensity in selected energy regions.
Figure 7.
Figure 7.
Monte Carlo simulated to experimentally measured (MC/EXP) absolute intensities for K-shell characteristic X-rays.
Figure 8.
Figure 8.
Monte Carlo simulated to experimentally measured (MC/EXP) absolute intensities for L-shell characteristic X-rays.
Figure 9.
Figure 9.
Monte Carlo simulated to experimentally measured (MC/EXP) absolute intensities for M-shell characteristic X-rays.
Figure 10.
Figure 10.
Monte Carlo simulated to experimentally measured (MC/EXP) absolute intensities for continuum (bremsstrahlung) X-rays in several energy bands.
Figure 11.
Figure 11.
(a) Simulated EDS spectrum of SrTiO3 with trace Ca (0.001 mass fraction) at E0 = 20 keV for a dose that yields 13.8 million counts from 0.1 keV to E0. (b) The effect of lowering the dose to give 1.38 million counts.
Figure 12.
Figure 12.
(a) Simulated EDS spectrum of SrTiO3 with trace Ca (0.0002 mass fraction) at E0 = 20 keV for a dose that yields 13.8 million counts from 0.1 keV to E0. (b)The effect of lowering the dose to give 1.38 million counts.
Figure 13.
Figure 13.
Simulated and measured EDS spectra of FeS2 at E0 = 10 keV. Note the artifacts arising from incomplete charge collection on the low energy shoulder of the S K-family and the various coincidence peaks.
Figure 14.
Figure 14.
Simulated and measured EDS spectra of SrTiO3 at E0 = 20 keV. Note the artifact arising from the Sr L3-M4,5 (Sr Lα) coincidence.

Similar articles

Cited by

References

    1. Goldstein J, Newbury D, Michael J, Ritchie N, Scott J, and Joy D, Scanning Electron Microscopy and X-ray Microanalysis, 4th ed. (Springer, New York, 2018).
    1. Ritchie NW, DTSA-II open access software for quantitative electron excited X-ray microanalysis with energy dispersive spectrometry; available for free, including tutorials, at the NIST website: https://www.nist.gov/services-resources/software/nist-dtsa-ii (2021).
    1. Newbury D and Ritchie N “Review: Performing Elemental Microanalysis with High Accuracy and High Precision by Scanning Electron Microscopy/Silicon Drift Detector Energy Dispersive X-ray Spectrometry (SEM/SDD-EDS)”, J. Mats. Sci, 50, 493–518 (2015). - PMC - PubMed
    1. Newbury DE and Ritchie NWM, “An Iterative Qualitative–Quantitative Sequential Analysis Strategy for Electron-Excited X-ray Microanalysis with Energy Dispersive Spectrometry: Finding the Unexpected Needles in the Peak Overlap Haystack”, Microscopy and Microanalysis, 24 (2018) 350–373. - PubMed
    1. Newbury DE and Ritchie NWM, “Quantitative Electron-Excited X-Ray Microanalysis of Borides, Carbides, Nitrides, Oxides, and Fluorides with Scanning Electron Microscopy/Silicon Drift Detector Energy-Dispersive Spectrometry (SEM/SDD-EDS) and DTSA-II”, Microscopy and Microanalysis 21 (2015) 1327–1340. - PubMed