. 2022 Dec;113(12):4207-4218.
doi: 10.1111/cas.15558. Epub 2022 Sep 13.

Inhibition of insulin-like growth factor-1 receptor enhances eribulin-induced DNA damage in colorectal cancer

Affiliations

Inhibition of insulin-like growth factor-1 receptor enhances eribulin-induced DNA damage in colorectal cancer

Tomoyasu Yoshihiro et al. Cancer Sci. 2022 Dec.

Abstract

Microtubule targeting agents (MTAs) such as taxanes are broadly used for the treatment of patients with cancer. Although MTAs are not effective for treatment of colorectal cancer (CRC), preclinical studies suggest that a subset of patients with CRC, especially those with cancers harboring the BRAF mutation, could benefit from such agents. However, two MTAs, eribulin (Eri) and vinorelbine, have shown limited clinical efficacy. Here, we report that insulin-like growth factor 1 receptor (IGF-1R) signaling is involved in Eri resistance. Using CRC cell lines, we showed that Eri induces activation and subsequent translocation of IGF-1R to the nucleus. When the activation and/or nuclear translocation of IGF-1R was inhibited, Eri induced DNA damage and enhanced G2 /M arrest. In a xenograft model using the Eri-resistant SW480 cell line, the combination of Eri and the IGF-1R inhibitor linsitinib suppressed tumor growth more efficiently than either single agent. Thus, our results indicated that combination dosing with Eri and an IGF-1R inhibitor could overcome Eri resistance and offer a therapeutic opportunity in CRC.

Keywords: IGF-1R; ROS; colorectal cancer; eribulin; microtubule.


Figures

FIGURE 1
FIGURE 1
Analysis of eribulin (Eri) sensitivity and mechanism of action in colorectal cancer (CRC) cell lines. (A) WST‐8 assays were used to assess the viability of CRC cells after 72 h Eri exposure. Error bars represent SD of triplicate cultures. (B) Cell cycle analyses of HCT116 and SW480 cell lines exposed to the indicated concentrations of Eri for 24 h were undertaken by quantifying DNA content using flow cytometry. Cell cycle distribution is represented as mean ± SD of triplicate cultures in the graph in the right panel. (C) Immunofluorescence image of HCT116 cells following treatment for 24 h with 5 nM Eri and staining for β‐tubulin and γ‐tubulin. The nucleus was counterstained with DAPI. Arrowheads indicate abnormal mitotic spindle structures. Scale bar, 10 μm
FIGURE 2
FIGURE 2
Activation of the insulin‐like growth factor 1 receptor (IGF‐1R)/insulin receptor (INSR) pathway confers eribulin (Eri) resistance. (A) SW480 and HCT116 cells were treated with the indicated concentrations of Eri for 72 h and then lysed and analyzed by western blotting. Relative protein levels were quantified using Fusion Solo 7 software. (B) Viability of SW480 cells measured by WST‐8 assay following exposure to the indicated compounds for 24, 48, and 72 h. Concentrations of Eri, linsitinib (LINSI), and NVP‐AEW541 (AEW) were 20 nM, 5 μM, and 500 nM, respectively. Data are shown as mean ± SD of triplicate cultures. *p < 0.001, **p < 0.0001, Tukey–Kramer tests. (C) Cell cycle analysis of SW480 cells following exposure to the indicated compounds. Cell cycle distribution is represented as mean ± SD of triplicate cultures in the graph below. (D) Cell lysates of SW480 and HCT116 cells following exposure to the indicated compounds for 24 h were analyzed by western blotting. Eri concentrations were 20 and 5 nM for SW480 and HCT116 cells, respectively. LINSI and AEW concentrations were 5 μM and 500 nM, respectively
FIGURE 3
FIGURE 3
Insulin‐like growth factor‐1 receptor (IGF‐1R) activation is responsible for eribulin (Eri) resistance. (A) IGF‐1R or insulin receptor (INSR) KO SW480 (generated using a CRISPR‐Cas9 system) were lysed and analyzed by western blotting. (B) Empty vector‐transduced and IGF‐1R or INSR KO SW480 cells were exposed to the indicated concentrations of Eri for 72 h and then cell viability was measured by the WST‐8 assay. Data are presented as mean ± SD of triplicate cultures. (C) Control SW480 and KO cells were exposed to 20 nM Eri for 24 h and then collected to analyze cell cycle. Cell cycle distribution is represented as mean ± SD of triplicate cultures in the graph to the right
FIGURE 4
FIGURE 4
Translocation of insulin‐like growth factor‐1 receptor (IGF‐1R) to the nucleus contributes to eribulin (Eri) resistance. A, SW480 cells were exposed to the indicated compounds for 12 h and then subjected to immunofluorescent staining for IGF‐1R. The nucleus was counterstained with DAPI. Scale bar, 50 μm. The number of nuclear IGF‐1R‐positive cells as a percentage of total cells was quantified and mean ± SD across five fields of view is shown in the graph to the right. *p < 0.001, **p < 0.0001, Tukey–Kramer tests. n.s, not significant. (B) Cell cycle of SW480 cells following exposure to the indicated compounds for 24 h was analyzed by flow cytometry. Cell cycle distribution is represented as mean ± SD of triplicate cultures in the graph to the right. (C) Cell viability of SW480 cells measured by WST‐8 assay following exposure to the indicated compounds for 24, 48, and 72 h. Data are shown as mean ± SD of triplicate cultures. *p < 0.001, **p < 0.0001, Tukey–Kramer tests. n.s, not significant. (D) Cell lysates of SW480 cells following exposure to the indicated compounds for 24 h were analyzed by western blotting. CPZ, chlorpromazine hydrochloride; IMPZ, importazole; LINSI, linsitinib
FIGURE 5
FIGURE 5
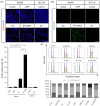
Combination of eribulin (Eri) and insulin‐like growth factor‐1 receptor (IGF‐1R) inhibitor induces reactive oxygen species (ROS)‐mediated DNA damage. (A) SW480 and HCT116 cells were exposed to the indicated compounds for 24 h and then subjected to immunofluorescent staining for γH2AX. The number of γH2AX‐positive cells as a percentage of total cells was quantified. Mean ± SD of three fields is shown in the graph below. **p < 0.0001, Tukey–Kramer tests. Scale bar, 50 μm. B, SW480 and HCT116 cells were exposed to the indicated compounds for 24 h and then stained with dichloro‐dihydro‐fluorescein diacetate (DCFH‐DA). Scale bar, 100 μm. (C) Cell cycle analysis of SW480 cells following exposure to the indicated compounds for 24 h. N‐acetyl‐L‐cysteine (NAC) (5 mM), used as a ROS scavenger, was added starting 1 h before initiation of exposure to the indicated compounds. Cell cycle distribution is represented as mean ± SD of triplicate cultures in the graph below. LINSI, linsitinib
FIGURE 6
FIGURE 6
Combination of eribulin (Eri) and linsitinib (LINSI) attenuates tumor growth in vivo. (A) SW480 cells were implanted into NSG mice. Tumor‐bearing mice were then treated with vehicle (n = 8), 50 mg/kg LINSI (n = 8), 0.25 mg/kg Eri (n = 8), or the combination of Eri plus LINSI (n = 7). Eri was given intravenously once per week; LINSI was given once daily by oral gavage. Mean ± SEM of the calculated in‐life tumor volumes are shown. *p < 0.05, **p < 0.0001, Tukey–Kramer tests. (B) Terminal tumor weights of xenografted tumors are shown as mean ± SEM. *p < 0.05, **p < 0.01, Tukey–Kramer tests. (C) Image of immunohistochemical staining of xenografted tumor using anti‐Ki‐67 Ab. Number of Ki‐67‐positive cells per high‐power field (HPF) was counted; mean ± SD of 12 HPF/tumor is shown in the graph below. **p < 0.0001, Tukey–Kramer tests. Scale bar, 100 μm. (D) Immunofluorescent staining for insulin‐like growth factor‐1 receptor (IGF‐1R) using serial sections of samples from (C). Nucleus was counterstained with DAPI. Scale bar, 50 μm

References

    1. WHO cancer today (2018). Accessed February 1, 2022. https://gco.iarc.fr/today/home
    1. Vecchione L, Gambino V, Raaijmakers J, et al. A vulnerability of a subset of colon cancers with potential clinical utility. Cell. 2016;165(2):317‐330. - PubMed
    1. Cremolini C, Pietrantonio F, Tomasello G, et al. Vinorelbine in BRAF V600E mutated metastatic colorectal cancer: a prospective multicentre phase II clinical study. ESMO Open. 2017;2(3):e000241. - PMC - PubMed
    1. Masuishi T, Taniguchi H, Kotani D, et al. A multicenter phase II study of eribulin in patients with BRAF V600E mutant metastatic colorectal cancer: BRAVERY study (EPOC1701). Ann Oncol. 2020;31(SUPPLEMENT3):S226. doi:10.1016/j.annonc.2020.04.040 - DOI - PubMed
    1. Pollak M. Insulin and insulin‐like growth factor signalling in neoplasia. Nat Rev Cancer. 2008;8(12):915‐928. - PubMed

MeSH terms

Substances