. 2022 Oct 3;221(10):e202205038.
doi: 10.1083/jcb.202205038. Epub 2022 Sep 2.

Origin of cytoplasmic GDP-fucose determines its contribution to glycosylation reactions

Affiliations

Origin of cytoplasmic GDP-fucose determines its contribution to glycosylation reactions

Paulina Sosicka et al. J Cell Biol. .

Abstract

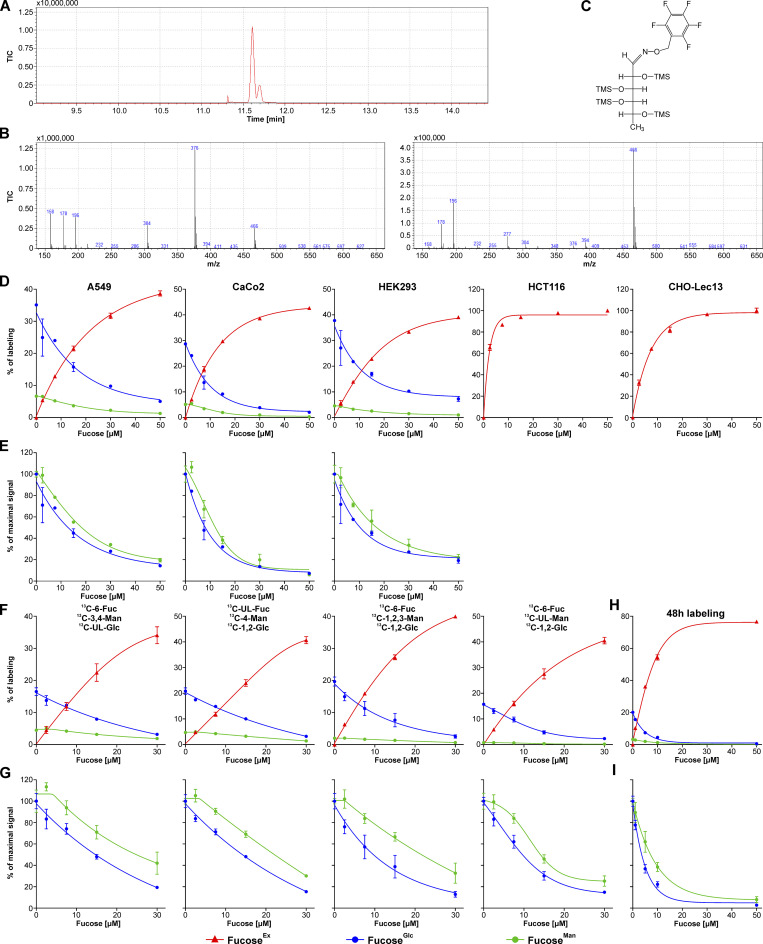
Biosynthesis of macromolecules requires precursors such as sugars or amino acids, originating from exogenous/dietary sources, reutilization/salvage of degraded molecules, or de novo synthesis. Since these sources are assumed to contribute to one homogenous pool, their individual contributions are often overlooked. Protein glycosylation uses monosaccharides from all the above sources to produce nucleotide sugars required to assemble hundreds of distinct glycans. Here, we demonstrate that cells identify the origin/heritage of the monosaccharide, fucose, for glycosylation. We measured the contribution of GDP-fucose from each of these sources for glycan synthesis and found that different fucosyltransferases, individual glycoproteins, and linkage-specific fucose residues identify and select different GDP-fucose pools dependent on their heritage. This supports the hypothesis that GDP-fucose exists in multiple, distinct pools, not as a single homogenous pool. The selection is tightly regulated since the overall pool size remains constant. We present novel perspectives on monosaccharide metabolism, which may have a general applicability.


Figures

None
Graphical abstract
Figure 1.
Figure 1.
Cells selectively utilize fucose derived from mannose and glucose as well as fucose originating from an exogenous source. (A) Schematic showing the biosynthetic pathways involved in GDP-fucose production. (B and E) Incorporation of 5 mM 13C-UL-glucose, 50 μM 13C-3,4-mannose and 13C-6-fucose into fucosylated N-glycans produced by HeLa, HepG2, Huh7 and CHO cells expressed as a percentage of labeling (B) or as a percentage of maximal signal (E); n = 3; data are presented as mean ± SD. (C) Schematic representation of the results presented in panel B. (D) Comparison of GDP-fucose amount produced by HepG2, CHO, and Huh7 treated and untreated with exogenous fucose. Statistical significance was assigned using two-tailed t test; ns, P > 0.05; n = 5; data are presented as mean ± SD.
Figure S1.
Figure S1.
Analysis of mannose, glucose, and fucose incorporation into N-glycan-associated fucose. (A) GC chromatogram of derivatized fucose. (B) MS fragmentation of fucose. Left panel, MS fragmentation of the peak with elution time 11.6 min. Right panel, MS fragmentation of the peak with elution time 11.7 min. (C) Chemical structure of fucose derivatized with BSTFA/PFBO before MS fragmentation. (D and E) Incorporation of 5 mM 13C-UL-glucose, 50 μM 13C-3,4-mannose and 13C-6-fucose into fucose associated with N-glycoproteins produced by A549, CaCo2, HEK293, HCT116 and CHO-Lec13 cells expressed as a percentage of labeling (D) or as a percentage of maximal signal (E); HCT116 and CHO-Lec13 are GMDS mutants with inactive de novo pathway; n = 3; data are presented as mean ± SD. (F and G) Incorporation of 5 mM glucose, 50 μM mannose and fucose into fucose associated with N-glycoproteins produced by HepG2 cells expressed as a percentage of labeling (F) or as a percentage of maximal signal (G); monosaccharides with different number and position of 13C carbons were used to evaluate a possibility of kinetic isotope effect; n = 3; data are presented as mean ± SD. (H and I) Incorporation of 5 mM 13C-5,6-glucose, 50 μM 13C-4-mannose and 13C-UL-fucose into fucose associated with N-glycoproteins produced by HepG2 cells during 48 h labeling period expressed as a percentage of labeling (H) or as a percentage of maximal signal (I); n = 3; data are presented as mean ± SD.
Figure S2.
Figure S2.
HPLC analysis of GDP-fucose pool size. (A) HPLC separation of nucleotide and nucleotide sugar standards. (B) Standard curve presenting linear correlation between an amount of injected GDP-fucose and an area of the peak eluting from the column. (C) HPLC profile of nucleotide sugars isolated from HepG2, Huh7 and CHO cells untreated with fucose (black) and treated with 50 μM fucose (red); green arrow indicates UDP-arabinose and red arrow indicates GDP-fucose. (D) Zoom into elution time that covers GDP-fucose only.
Figure S3.
Figure S3.
Analysis of mannose and glucose incorporation into N-glycan-associated mannose. Incorporation of 5 mM 13C-UL-glucose and 50 μM 13C-3,4-mannose into mannose associated with N-glycoproteins produced by HeLa, HepG2, Huh7, CHO, A549, CaCo2, HEK293, HCT116 and CHO-Lec13 cells expressed as a percentage of maximal signal; n = 3; data are presented as mean ± SD.
Figure S4.
Figure S4.
Analysis of newly synthesized proteins secretion and incorporation of exogenous fucose into different positions in N-glycan. (A) Secretion of 35S Met labeled, newly synthesized proteins and fucosylated glycoproteins (LCA bound) produced by HepG2 cells; n = 3; data are presented as mean ± SD. (B) Secretion of 35S Met labeled, newly synthesized, fucosylated glycoproteins, pulled down with LCA produced by HepG2 cells growing in a presence or absence of 5 μg/ml BFA; n = 3; data are presented as mean ± SD. (C) Secretion and intracellular utilization of 3H-fucose in pre-labeled HepG2 cells grown in a presence of 10 μM cold fucose; n = 3; data are presented as mean ± SD. (D) LC-MS analysis of exogenous 13C-UL-fucose incorporation into cell associated N-glycans produced by A549, CaCo2, HEK293 and CHO-Lec13 cells that have only one fucose residue as well as N-glycans with two fucose residues; M+6 refers to N-glycans which incorporated a single molecule of exogenous fucose; M+12 refers to N-glycans which incorporated two molecules of exogenous fucose; CHO-Lec13 cells are GMDS mutants with inactive de novo pathway; data are presented as mean ± SEM; N refers to the number of unique N-glycan structures.
Figure 2.
Figure 2.
The contribution of fucose salvage into N-glycans is almost insensitive to exogenous fucose. (A and C) Incorporation of 5 mM 13C-1,2-glucose, 50 μM 13C-1,2,3-mannose and 13C-6-fucose into fucose associated with newly synthesized N-glycoproteins secreted by HepG2, Huh7, and CHO cells pre-labeled for 11 d with 50 μM 13C-UL-fucose expressed as a percentage of labeling (A) and as a percentage of maximal signal (C); n = 3; data are presented as mean ± SD. (B) Schematic representation of the results are presented in A.
Figure 3.
Figure 3.
Various fucose linkages exhibit different preference to exogenous fucose. (A) LC-MS analysis of exogenous 13C-UL-L-fucose incorporation into cell-associated N-glycans produced by HepG2, HeLa, and CHO cells that have only one fucose residue as well as N-glycans with two fucoses; M+6 refers to N-glycans which incorporated a single molecule of exogenous fucose; M+12 refers to N-glycans which incorporated two molecules of exogenous fucose; data are presented as mean ± SEM; N refers to the number of unique N-glycan structures. (B) Lectin staining of HepG2, CaCo2, HCT116, HEK293, and CHO-Lec30 cells that have chemically or genetically inactivated de novo pathway, treated with increasing concentrations of exogenous fucose; n = 3; data are presented as mean ± SD. (C) Schematic representation of the results presented in B. (D) GC-MS analysis of exogenous 13C-UL-fucose incorporation efficiency into fucose associated with cellular N-glycoproteins as well as newly synthesized N-glycoproteins secreted by CHO and CHO-Lec30 cells expressed as a percentage of labeling; n = 3; data are presented as mean ± SD. (E) GC-MS analysis of exogenous 13C-UL-fucose incorporation into fucose associated with cell associated N-glycoproteins as well as newly synthesized N-glycoproteins secreted by Huh7 and Huh7 FUT8 knock-out cells; n = 3; data are presented as mean ± SD.
Figure S5.
Figure S5.
MALDI-TOF-MS and LC-MS/MS analysis of N-glycans secreted by HepG2 cells. (A) MALDI-TOF-MS analysis of N-glycans secreted by HepG2 cells, growing without 13C-UL-fucose. (B) MALDI-TOF-MS analysis of N-glycans secreted by HepG2 cells, growing in a presence of 50 μM 13C-UL-fucose. (C) MALDI-TOF-MS distribution of 12C-fucose and 13C-UL-fucose for one representative N-glycan. (D) LC-MS3 (m/z 1,334, m/z 1,209) analysis of a bifucosylated N-glycan from HepG2 cell growing in 20 µM 13C-UL-fucose, which incorporated only one 13C-UL-fucose fucose residue. Inset zooms in on low m/z range.
Figure 4.
Figure 4.
Core fucose preferentially rely on exogenous fucose while fucose attached to N-glycan antennae utilizes endogenous fucose more efficiently. (A) MALDI-TOF analysis of exogenous 13C-UL-fucose incorporation into N-glycans that have only one fucose residue as well as N-glycans with two fucose residues, produced by HepG2 cells; M+6 refers to N-glycans which incorporated a single molecule of exogenous fucose; M+12 refers to N-glycans which incorporated two molecules of exogenous fucose; n = 2; data are presented as mean ± SD. (B) LC-MS analysis of exogenous 13C-UL-fucose and endogenous 12C-fucose incorporation into N-glycans produced by HepG2 cells with two fucose residues. Black bars indicate N-glycans with endogenous 12C-fucose incorporated into both chitobiose core and antennae. Green bars indicate N-glycans with exogenous 13C-UL-fucose incorporated into chitobiose core and endogenous 12C-fucose into antennae. Blue bars indicate N-glycans with exogenous 13C-UL-fucose incorporated into antennae and endogenous 12C-fucose into chitobiose core. Red bars for N-glycans with exogenous 13C-UL-fucose into both chitobiose core and antennae; n = 2; data are presented as mean ± SD; statistical analysis was performed using two-tailed t test; P > 0.1 ns; P < 0.1*. (C) Schematic representation of the results presented in B.
Figure 5.
Figure 5.
Various fucosyltransferases, which fucosylate different glycoproteins, exhibit distinct preference to different GDP-fucose sources. (A) Schematic showing POFUT1 and POFUT2 dependent glycosylation of EGF-like repeats and TSRs. (B) Coomassie Brilliant Blue G250 staining of a representative SDS-PAGE gel of purified recombinant EGF-like repeats and TSRs secreted for 12 h by Huh7 cells. Red arrows indicate the protein of interest. (C and E) Incorporation of 5 mM 13C-1,2-glucose, 50 μM 13C-1,2,3-mannose, and 13C-6-fucose into fucose associated with EGF-like repeats or TSRs secreted by Huh7 cells pre-labeled for 11 d with 50 μM 13C-UL-fucose expressed as a percentage of labeling (C) and a percentage of maximal signal (E); n = 2 (for POFUT1 and POFUT2) and n = 4 (for unbound N-glycans); data are presented as mean ± SD. (D) Schematic representation of the results presented in C. Source data are available for this figure: SourceData F5.

References

    1. Allen, J.G., Mujacic M., Frohn M.J., Pickrell A.J., Kodama P., Bagal D., San Miguel T., Sickmier E.A., Osgood S., Swietlow A., et al. . 2016. Facile modulation of antibody fucosylation with small molecule fucostatin inhibitors and cocrystal structure with GDP-mannose 4, 6-dehydratase. ACS Chem. Biol. 11:2734–2743. 10.1021/acschembio.6b00460 - DOI - PubMed
    1. Aula, N., Salomäki P., Timonen R., Verheijen F., Mancini G., Månsson J.E., Aula P., and Peltonen L.. 2000. The spectrum of SLC17A5-gene mutations resulting in free sialic acid-storage diseases indicates some genotype-phenotype correlation. Am. J. Hum. Gen. 67:832–840. 10.1086/303077 - DOI - PMC - PubMed
    1. Benz, B.A., Nandadasa S., Takeuchi M., Grady R.C., Takeuchi H., LoPilato R.K., Kakuda S., Somerville R.P.T., Apte S.S., Haltiwanger R.S., and Holdener B.C.. 2016. Genetic and biochemical evidence that gastrulation defects in Pofut2 mutants result from defects in ADAMTS9 secretion. Dev. Biol. 416:111–122. 10.1016/j.ydbio.2016.05.038 - DOI - PMC - PubMed
    1. Brito, C., Kandzia S., Graça T., Conradt H.S., and Costa J.. 2008. Human fucosyltransferase IX: Specificity towards N-linked glycoproteins and relevance of the cytoplasmic domain in intra-Golgi localization. Biochimie. 90:1279–1290. 10.1016/j.biochi.2008.03.002 - DOI - PubMed
    1. Buffone, A., Jr., Mondal N., Gupta R., McHugh K.P., Lau J.T.Y., and Neelamegham S.. 2013. Silencing α1, 3-fucosyltransferases in human leukocytes reveals a role for FUT9 enzyme during E-selectin-mediated cell adhesion. J. Biol. Chem. 288:1620–1633. 10.1074/jbc.M112.400929 - DOI - PMC - PubMed

Publication types

MeSH terms