. 2022 Nov 7;219(11):e20221085.
doi: 10.1084/jem.20221085. Epub 2022 Sep 2.

Chronic activation of pDCs in autoimmunity is linked to dysregulated ER stress and metabolic responses

Affiliations

Chronic activation of pDCs in autoimmunity is linked to dysregulated ER stress and metabolic responses

Vidyanath Chaudhary et al. J Exp Med. .

Abstract

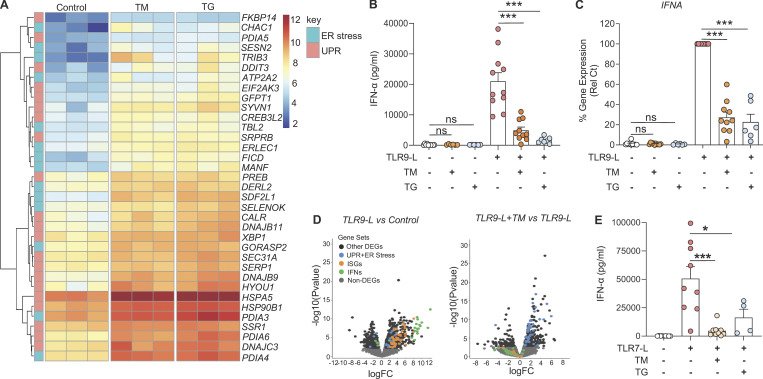
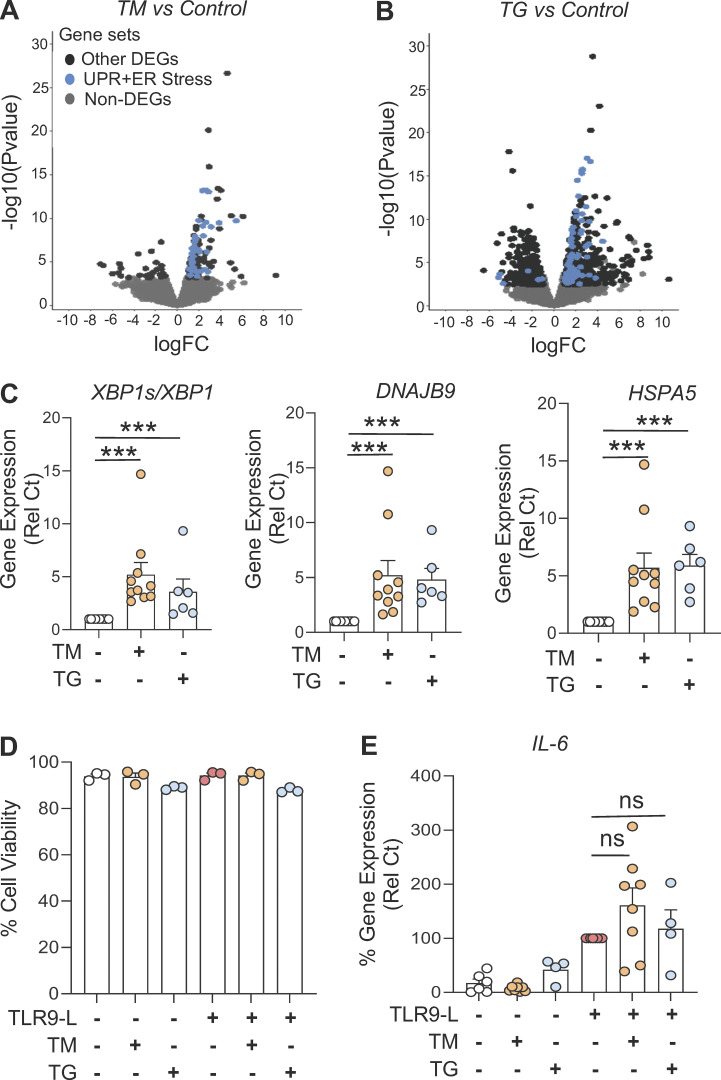
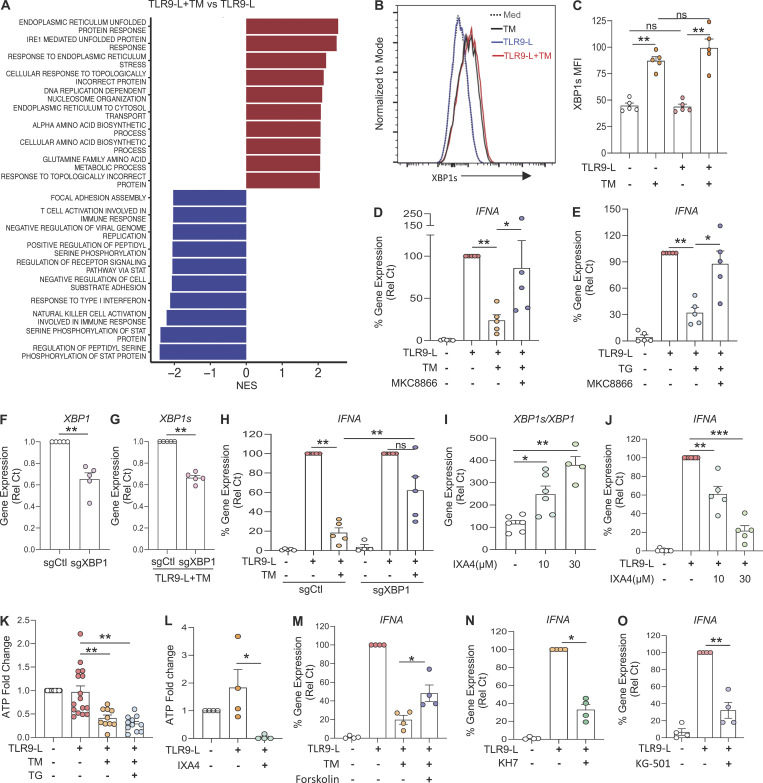
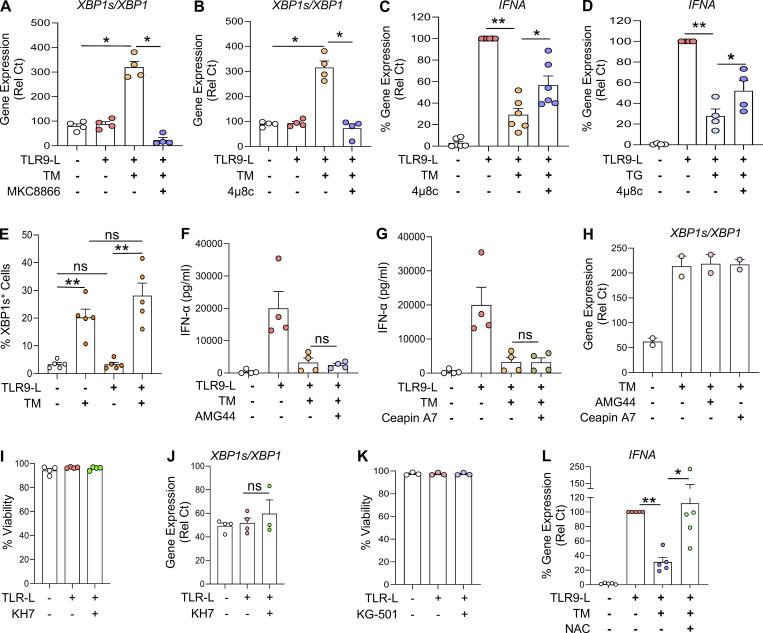
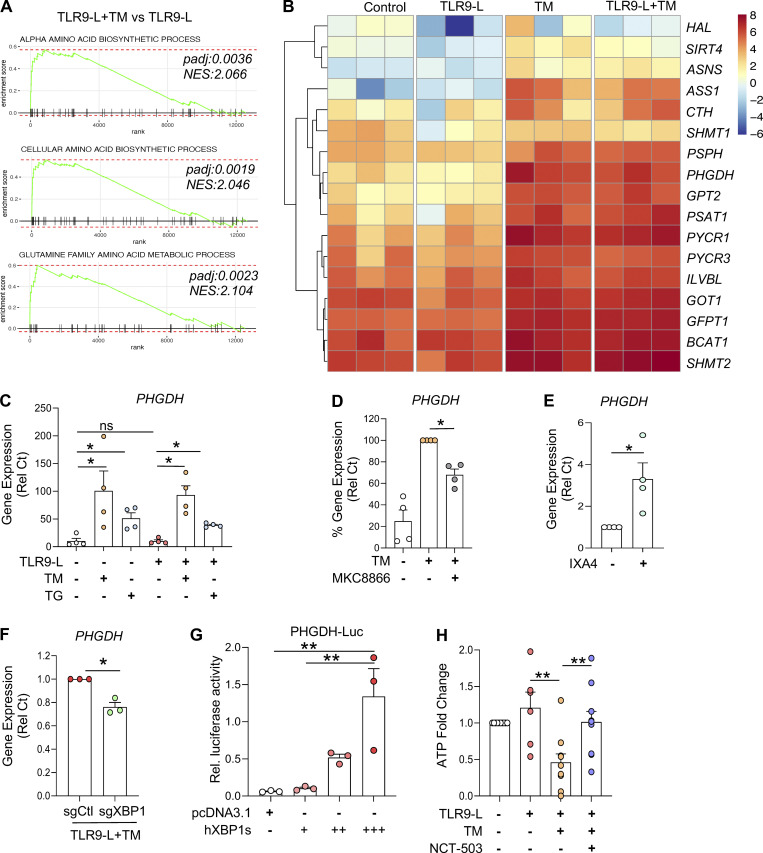
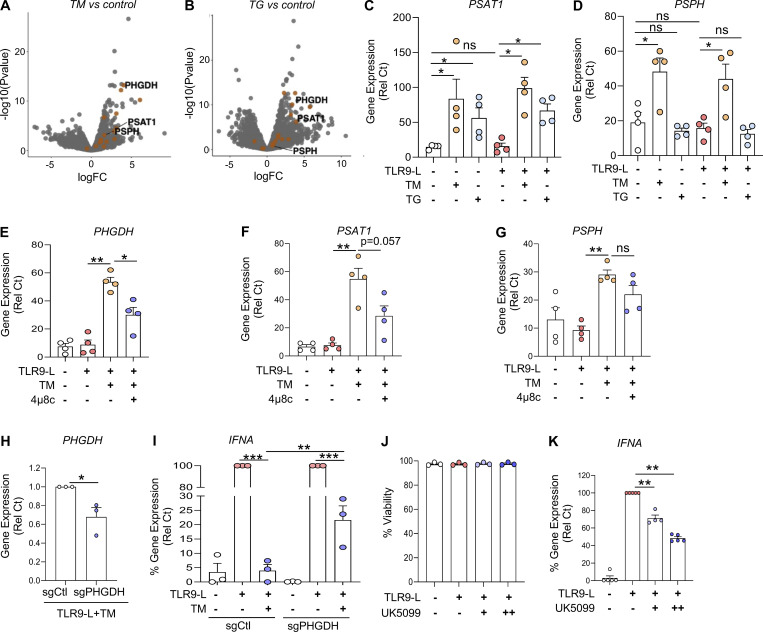
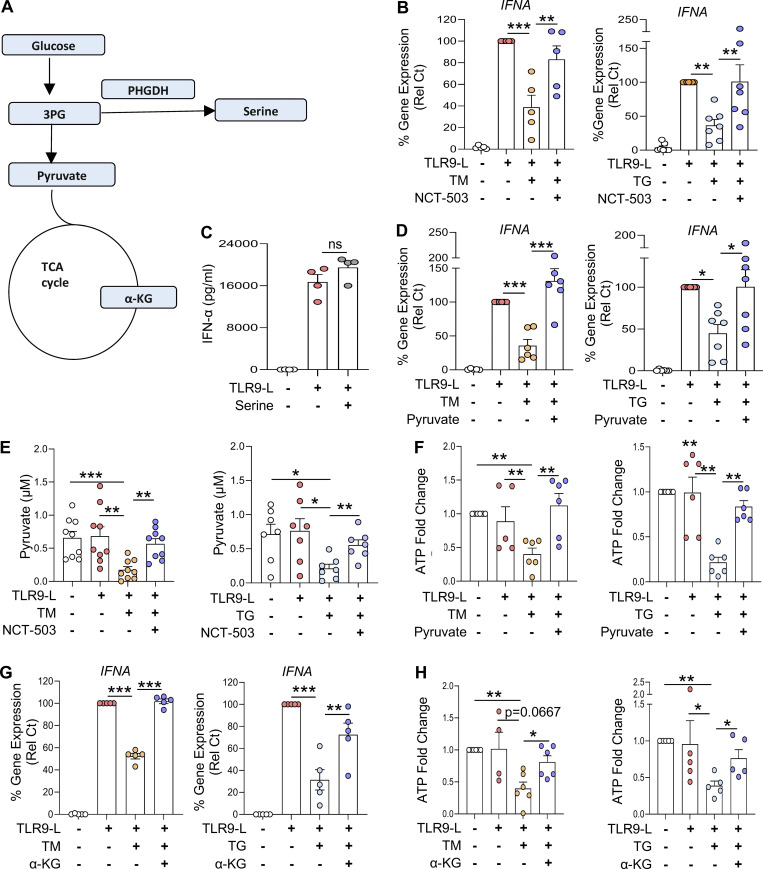
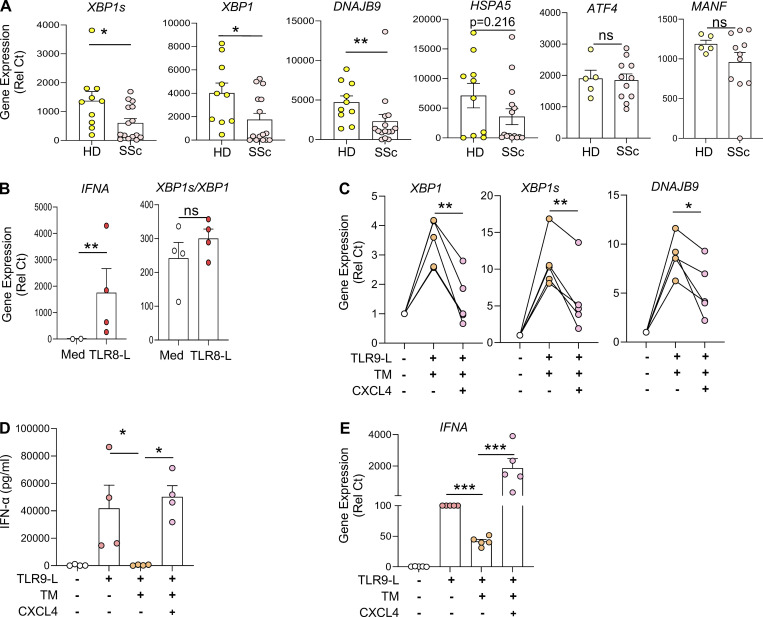
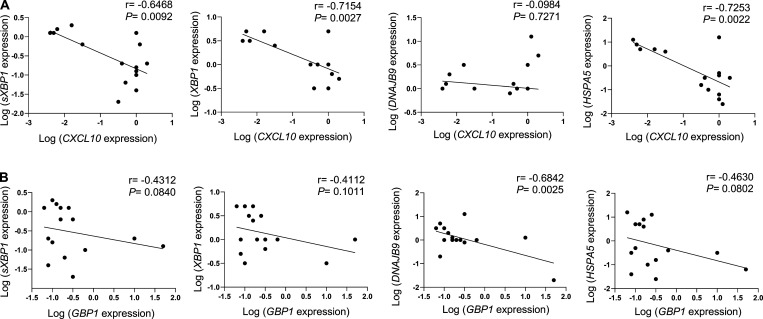
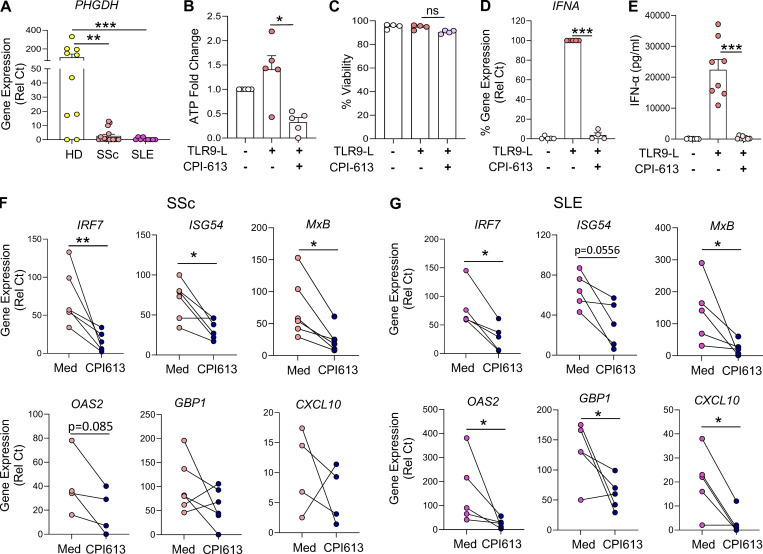
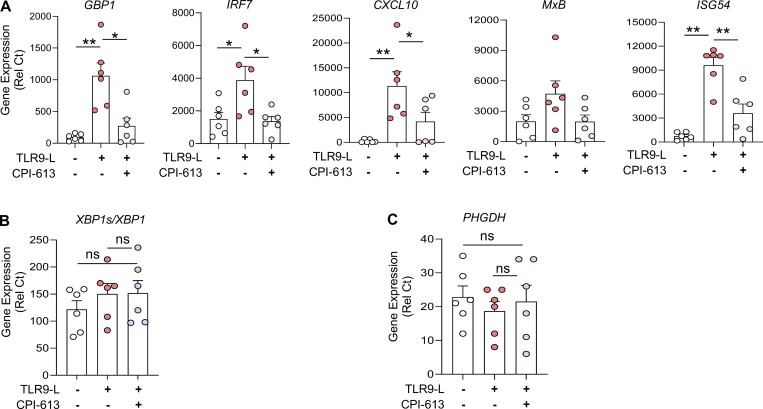
Plasmacytoid dendritic cells (pDCs) chronically produce type I interferon (IFN-I) in autoimmune diseases, including systemic sclerosis (SSc) and systemic lupus erythematosus (SLE). We report that the IRE1α-XBP1 branch of the unfolded protein response (UPR) inhibits IFN-α production by TLR7- or TLR9-activated pDCs. In SSc patients, UPR gene expression was reduced in pDCs, which inversely correlated with IFN-I-stimulated gene expression. CXCL4, a chemokine highly secreted in SSc patients, downregulated IRE1α-XBP1-controlled genes and promoted IFN-α production by pDCs. Mechanistically, IRE1α-XBP1 activation rewired glycolysis to serine biosynthesis by inducing phosphoglycerate dehydrogenase (PHGDH) expression. This process reduced pyruvate access to the tricarboxylic acid (TCA) cycle and blunted mitochondrial ATP generation, which are essential for pDC IFN-I responses. Notably, PHGDH expression was reduced in pDCs from patients with SSc and SLE, and pharmacological blockade of TCA cycle reactions inhibited IFN-I responses in pDCs from these patients. Hence, modulating the IRE1α-XBP1-PHGDH axis may represent a hitherto unexplored strategy for alleviating chronic pDC activation in autoimmune disorders.


Conflict of interest statement

Disclosures: R.L. Wiseman reported “other” from Protego Biopharma outside the submitted work; in addition, R.L. Wiseman had a patent to US20210008064 pending; and is a shareholder and scientific advisory board member of Protego Biopharma, who are developing UPR activating compounds including IXA4. M.K. Crow reported personal fees from AMPEL Biosolutions, BMS, AstraZeneca, GSK, Lilly, and Shannon Pharmaceuticals and grants from Gilead outside the submitted work; in addition, M.K. Crow had a patent number 9,809,854 issued. J.R. Cubillos-Ruiz reported “other” from Quentis Therapeutics, Inc., NextRNA Therapeutics, Inc., Autoimmunity Biologic Solutions, and Immagene, B.V. outside the submitted work; in addition, J.R. Cubillos-Ruiz had a patent to Small molecule IRE1-α inhibitors US10988461B2 issued. F.J. Barrat reported “other” from IpiNovyx Bio outside the submitted work; in addition, F.J. Barrat had a patent to CXCL4 in autoimmunity pending. No other disclosures were reported.

Figures

Figure 1.
Figure 1.
ER stress response inhibits IFN-α in pDCs. (A) Purified pDCs from HDs (n = 3) were cultured for 8 h in medium alone or medium with TM (at 3 µg/ml) or TG (at 0.5 µM), and RNA was analyzed by RNA-seq. Heatmaps of genes induced by ER stress as part of the UPR, identified by RNA-seq analysis of pDCs cultured as indicated. (B and C) Purified pDCs from HDs (n = 10–11) were first cultured with medium only or medium with TM at 3 µg/ml or TG at 0.5 µM for 3 h, before addition of the TLR9 agonist (CpG-C274 at 0.075 µM). Secreted IFN-α was quantified in conditioned medium after 13 h of culture (B) and gene expression level of IFNA was quantified at 5 h and normalized to TLR9 agonist treatment (C). (D) Volcano plot comparing gene expression analyzed by RNA-seq from pDCs of HDs (n = 3) cultured for 8 h with the TLR9 agonist CpG-C274 versus medium (left) or with CpG-C274 and TM versus CpG-C274 alone (right). Colors on all graphs indicate differentially expressed genes (DEGs) and ER stress genes (in blue); IFN genes (in green) and ISGs (in orange) are indicated. (E) pDCs (n = 9) were cultured in medium alone or with TM or TG for 3 h, before addition of a TLR7 agonist (influenza virus FLU at 0.5 pfu/cell). Secreted IFN-α was quantified in conditioned medium by ELISA after 13 h of culture. Individual donors are indicated; all results are represented as mean ± SEM; and statistical significance was evaluated using Mann–Whitney U test. ns, P > 0.05; *, P < 0.05; ***, P < 0.001.
Figure S1.
Figure S1.
Activated UPR impacts pDC response by reducing IFN-regulated genes. (A and B) Volcano plot comparing gene expression analyzed by RNA-seq of human pDCs (n = 3) from HDs cultured for 8 h in medium alone or with either TM (at 3 µg/ml; A) or TG (at 0.5 µM; B). Colors on all graphs indicate differentially expressed genes (DEGs), and UPR+ER stress genes (in blue) are indicated. logFC, log(fold-change). (C) pDCs (n = 10) were cultured in medium alone or with either TM or TG. Gene expression levels of XBP1s/XBP1, DNAJB9, and HSPA5 were quantified by qPCR after 8 h of culture and normalized to medium. (D and E) pDCs (n = 3–8) were cultured in medium alone or with either TM or TG for 3 h, before addition of TLR9 agonist. (D) Cell viability was quantified via flow cytometer. (E) Gene expression level of IL-6 was quantified at 5 h and normalized to TLR9 agonist treatment. Individual donors are indicated, all results are represented as mean ± SEM, and statistical significance was evaluated using Mann–Whitney U test. ns, P > 0.05; ***, P < 0.001.
Figure 2.
Figure 2.
ER stress response inhibits ATP production to reduce IFN-α in pDCs via the IRE1⍺-XBP pathway. (A) All differentially expressed genes identified by RNA-seq of pDCs from HDs (n = 3) cultured for 8 h with the TLR9 agonist CpG-C274 (0.075 µM) and TM versus CpG-C274 alone, were analyzed for pathway analysis using gene set enrichment analysis. NES, normalized enrichment score. (B and C) pDCs from HDs (n = 5) were cultured in medium only or medium with TM (at 3 µg/ml) for 3 h, before addition of the TLR9 agonist. XBP1s protein levels were assessed after 3 h of culture via flow cytometry. MFI, mean fluorescence intensity. (D and E) pDCs from HDs (n = 5) were cultured in medium only, medium with TM (at 3 µg/ml), or medium with TG (at 0.5 µM) alone or in combination with IRE1α inhibitors (MKC8866 at 1 µM) for 3 h, before addition of the TLR9 agonist. Gene expression levels of IFNA were quantified at 5 h and normalized to TLR9 agonist treatment. (F and G) pDCs (n = 5) were electroporated with Cas9–sgRNA complex targeting XBP1 and cultured with IL-3 (20 ng/ml) for 72 h. TM was added to culture for 3 h, before addition of the TLR9 agonist (CpG-C274 at 0.3 µM) for 5 h. Gene expression levels of XBP1 and XBP1s were quantified. (H) pDCs (n = 5) were electroporated with Cas9–sgRNA complex targeting XBP1 and cultured with IL-3 (20 ng/ml) for 72 h. TM was added to culture for 3 h, before addition of the TLR9 agonist (CpG-C274 at 0.3 µM) for 5 h. Gene expression levels of IFNA were quantified and normalized to TLR9 agonist treatment. (I and J) pDCs (n = 6–7) were cultured in medium only or medium with the IRE1α-XBP1 agonist (IXA4 at 10 and 30 μM) for 6 h (I) or 1 h (J), before addition of the TLR9 agonist for 5 h. In I, XBP1 splicing was quantified by qPCR and shown as XBP1s/XBP1. In J, IFNA gene expression was quantified at 5 h and normalized to TLR9 agonist treatment. (K) pDCs (n = 17) were cultured with TM or TG alone for 3 h, before addition of TLR9 agonist. Intracellular ATP was quantified after 2.5 h of TLR9 activation and normalized to medium. (L) pDCs (n = 4) were cultured in medium only or medium with IRE1α-XBP1 agonist (IXA4 at 30 μM) for 1 h, before addition of TLR9 agonist for 4 h. Intracellular ATP was then quantified and normalized to medium. (M) pDCs (n = 4) were cultured in medium only or medium with TM in combination with adenylyl cyclase activator (Forskolin at 5 µM) for 3 h before addition of TLR9 agonist. Gene expression levels of IFNA were quantified at 5 h and normalized to TLR9 agonist treatment. (N and O) pDCs (n = 4) were cultured in medium only or medium with the adenylyl cyclase inhibitor (KH7 at 40 µM; N) or CREB inhibitor (KG-501 at 20 µM; O) for 1 h, before addition of TLR9 agonist. IFNA gene expression was quantified at 5 h and normalized to TLR9 agonist treatment. Individual donors are indicated, all results are represented as mean ± SEM, and statistical significance was evaluated using Mann–Whitney U test. ns, P > 0.05; *, P < 0.05; **, P < 0.01; ***, P < 0.001.
Figure S2.
Figure S2.
ER stress inhibits TLR9-induced IFN-α in pDCs via IRE1⍺-XBP1–cAMP axis. (A–D) pDCs from HDs (n = 4–6) were cultured in medium alone or with either TM or with TG in combination with IRE1α inhibitors (MKC8866 at 1 µM or 4µ8c at 10 µM) for 3 h, before addition of TLR9 agonist. Gene expression levels of XBP1s/XBP1 (A and B) and IFNA (C and D) were quantified at 5 h by qPCR. IFNA was normalized to TLR9 agonist treatment. (E) pDCs from HDs (n = 5) were cultured in medium alone or with TM for 3 h, before addition of TLR9 agonist. XBP1 splicing positive pDCs were quantified after 3 h of culture via flow cytometer. (F–H) pDCs (n = 2–4) were cultured in medium alone or with TM, either alone or with a PERK inhibitor (AMG44 at 1 μM; F) or ATF6 inhibitor (Ceapin A7 at 5 μM; G) for 3 h, then the TLR9 agonist was added to culture. Secreted IFN-α was quantified by ELISA after 13 h of culture. (H) After 8 h, expression of the XBP1 isoforms quantified by qPCR. (I–K) pDCs (n = 3–4) were cultured in medium alone or with either adenylyl cyclase inhibitor (KH7 at 40 µM; I and J) or CREB inhibitor (KG-501 at 20 µM; K) for 1 h, before addition of TLR9 agonist. (I and K) Cell viability was quantified at 5 h. (J) Gene expression for XBP1s/XBP1 was quantified. (L) pDCs (n = 5) were cultured in medium only or with TM in combination with NAC (10 mM) for 3 h when a TLR9 agonist was added to the culture. Gene expression levels of IFNA were quantified at 5 h and normalized to TLR9 agonist treatment. Individual donors are indicated, all results are represented as mean ± SEM, and statistical significance was evaluated using Mann–Whitney U test. ns, P > 0.05; *, P < 0.05; **, P < 0.01.
Figure 3.
Figure 3.
ER stress response regulates ATP production via induction of PHGDH. (A and B) Purified pDCs from HDs (n = 3) were cultured in medium alone or with TM for 3 h, before addition of TLR9 agonist for 5 h. (A) Gene enrichment score of amino acid biosynthesis. (B) Heatmaps of genes involved in amino acid biosynthesis. NES, normalized enrichment score. (C) pDCs (n = 4) were cultured in medium alone or with TM or TG for 3 h, before addition of TLR9 agonist for 5 h. Gene expression of PHGDH was quantified. (D) pDCs (n = 4) were cultured with TM alone or in combination with an IRE1α inhibitor (MKC8866 at 1 μM) for 8 h. Gene expression level of PHGDH was quantified and normalized to TM treatment. (E) pDCs (n = 4) were cultured in medium alone or with IRE1α-XBP1 agonist (IXA4 at 30 µM) for 6 h. Gene expression level of PHGDH was quantified and normalized to medium. (F) pDCs (n = 3) were electroporated with Cas9–sgRNA complex targeting XBP1 and cultured with IL-3 (20 ng/ml) for 72 h. TM was added to culture for 3 h, before addition of the TLR9 agonist (CpG-C274 at 0.3 µM) for 5 h. Gene expression levels of PHGDH were quantified. Statistical significance was evaluated using two-tailed paired t test. *, P < 0.05. (G) HEK293T cells (n = 3) were cultured for 24 h in a 96-well plate and cotransfected with an PHGDH-Luc reporter plasmid and Renilla reporter plasmid with either expression vectors pcDNA3.1 or expression vectors with spliced XBP1 proteins (18 ng [+], 54 ng [++], or 90 ng [+++]). After 48 h of transfection, dual-luciferase reporter assay was performed, and PHGDH-Luc activity was normalized to Renilla Luc activity. (H) pDCs (n = 10) were cultured with TM in combination with PHGDH inhibitor (NCT-503 at 2 μM) for 3 h, before addition of the TLR9 agonist for 2.5 h. Intracellular ATP was quantified and normalized to medium. Individual donors are indicated, all results are represented as mean ± SEM, and statistical significance was evaluated using Mann–Whitney U test. ns, P > 0.05; *, P < 0.05; **, P < 0.01.
Figure S3.
Figure S3.
ER stress induces serine biosynthesis in pDCs via PHGDH. (A and B) Volcano plots comparing gene expression analyzed by RNA-seq of pDCs (n = 3) cultured for 8 h with either TM or TG vs. medium. (C and D) pDCs (n = 4) were cultured in medium alone or with either TM or TG for 3 h, before addition of TLR9 agonist for 5 h. Gene expression of PHGDH, PSAT1, and PSPH was quantified by qPCR. (E–G) pDCs (n = 4) were cultured in medium alone or with TM, either alone or in combination with an IRE1⍺ inhibitor (4μ8c at 10 µM) for 3 h, before addition of TLR9 agonist for 5 h. Gene expression of PHGDH, PSAT1, and PSPH was quantified by qPCR. (H and I) pDCs (n = 3) were electroporated with Cas9–sgRNA complex targeting PHGDH and cultured with IL-3 (20 ng/ml) for 72 h. TM was added to culture for 3 h, before addition of the TLR9 agonist (CpG-C274 at 0.3 µM) for 5 h. (H) Gene expression levels of PHGDH were quantified. (I) Gene expression levels of IFNA were quantified and normalized to TLR9 agonist treatment. (J and K) pDCs (n = 3–5) were cultured in medium alone or with inhibitor for pyruvate transporter (UK-5099 at 20 µM [+] or 40 µM [++]) for 1 h, before addition of the TLR9 agonist. (J) Cell viability was quantified at 5 h via flow cytometer. (K) Gene expression level IFNA was quantified and normalized to TLR9 agonist. Individual donors are indicated, all results are represented as mean ± SEM, and statistical significance was evaluated using Mann–Whitney U test, two-tailed paired t test, or one-way ANOVA with Turkey’s correction. ns, P > 0.05; *, P < 0.05; **, P < 0.01; ***, P < 0.001.
Figure 4.
Figure 4.
ER stress response rewires pyruvate to control IFN-I response by pDCs. (A) Graphical representation of the role of PHGDH in glucose metabolism. (B) pDCs (n = 5–7) were cultured in medium alone or with TM or TG in combination with PHGDH inhibitor (NCT-503 at 2 µM) for 3 h, before addition of TLR9 agonist. Gene expression level of IFNA was quantified at 5 h and normalized to TLR9 agonist treatment. (C) pDCs (n = 4) were cultured in medium alone or with L-serine (1 mg/ml) for 1 h, before addition of TLR9 agonist. Secreted IFN-α was quantified by ELISA after 13 h of culture. (D) pDCs (n = 6–7) were cultured with TM (left) or TG (right) in combination with PHGDH inhibitor (NCT-503 at 2 μM) for 3 h, when TLR9 agonist was added to the culture for 2.5 h. Intracellular pyruvate was quantified. (E and F) pDCs (n = 6–9) were cultured with TM or TG alone or with sodium pyruvate (pyruvate at 10 mM) for 3 h, before addition of TLR9 agonist. (E) Intracellular ATP was quantified using ATP assay kit after 2.5 h of culture and normalized to medium. (F) Gene expression level of IFNA was quantified at 5 h and normalized to TLR9 agonist treatment. (G and H) pDCs (n = 5–6) were cultured with TM or TG alone or with α-KG at 10 mM for 3 h, before addition of TLR9 agonist. (G) Intracellular ATP was quantified after 2.5 h of culture and normalized to medium. (H) Gene expression level of IFNA was quantified at 5 h and normalized to TLR9 agonist treatment. Individual donors are indicated, all results are represented as mean ± SEM, and statistical significance was evaluated using Mann–Whitney U test. ns, P > 0.05; *, P < 0.05; **, P < 0.01; ***, P < 0.001.
Figure 5.
Figure 5.
CXCL4-mediated dysregulation of ER stress response in pDCs isolated from SSc patients promotes IFN-I production. (A) pDCs were isolated from the blood of HDs (n = 10) and patients with SSc (n = 15). pDCs were lysed, and RNA was collected for gene expression of XBP1s, XBP1, DNAJB9, HSPA5, ATF4, and MANF. (B) pDCs (n = 4) were isolated from the blood of patients with SSc and cultured in medium alone or with the TLR8 agonist (ORN8L at 130 μg/ml). After 6 h of culture, RNA was collected and quantified for gene expression of IFNA and XBP1 splicing (measuring XBP1s/XBP1). (C–E) pDCs from HDs (n = 4–5) were cultured in medium alone or with TM for 3 h, before addition of TLR9 agonist alone or with CXCL4 (3 μg/ml). (C) Gene expression level of XBP1, XBP1s, and DNAJB9 quantified after 5 h of culture. (D) Secreted IFN-α was quantified in conditioned medium by ELISA after 13 h of culture. (E) Gene expression level of IFNA after 5 h of culture and normalized to TLR9 treatment. Individual donors are indicated, and all results are represented as mean ± SEM. Statistical significance was evaluated using two-tailed paired t test or Mann–Whitney U test. ns, P > 0.05; *, P < 0.05; **, P < 0.01; ***, P < 0.001.
Figure S4.
Figure S4.
ER stress gene levels negatively correlate with ISG expression in pDCs from SSc patients. (A and B) pDCs were isolated from freshly isolated blood of patients with SSc (n = 15). pDCs were lysed, and RNA was collected for gene expression of CXCL10, GBP1, XBP1, XBP1s, DNAJB9, and HSPA5. Expression of ER stress genes such as XBP1, XBP1s, DNAJB9, and HSPA5 linked with the expression of CXCL10 (A) and GBP1 (B). Pairwise correlation analysis was calculated using Spearman’s correlation coefficient (r) with P values (two-tailed), 95% confidence intervals for all correlation analysis.
Figure 6.
Figure 6.
PHGDH reduction in pDCs of patients with SSc and SLE is associated with chronic IFN-I signatures. (A) pDCs were isolated from the blood of either HDs (n = 10) or patients with SSc (n = 15) or SLE (n = 9). pDCs were lysed, and RNA was collected for gene expression of PHGDH. (B–E) pDCs (n = 4–8) were cultured in medium alone or with the inhibitor for both PDH and α-KGDH (CPI-613 at 200 µM) for 1 h, before the addition of TLR9 agonist. (B) Intracellular ATP was quantified after 4 h of culture and normalized to medium. (C) Cell viability was quantified at 5 h via flow cytometer. (D) Gene expression level of IFNA was quantified at 5 h and normalized to TLR9 agonist treatment. (E) Secreted IFN-α was quantified by ELISA after 12 h of culture. (F and G) pDCs (n = 5–6) were isolated from patients with SSc (F) or SLE (G) and cultured in medium with CPI-613 at 200 μM for 12 h. Gene expression levels of ISGs such as GBP1, IRF7, ISG54, MxB, OAS2, and CXCL10 were quantified. Individual donors are indicated, all results are represented as mean ± SEM, and statistical significance was evaluated using Mann–Whitney U test. ns, P > 0.05; *, P < 0.05; **, P < 0.01; ***, P < 0.001.
Figure S5.
Figure S5.
The TCA inhibitor CPI-613 has little to no effect on viability or ER stress gene levels in human pDCs. (A–C) pDCs (n = 6) were cultured in medium alone or with an inhibitor for both PDH and α-KGDH (CPI-613 at 200 µM for 1 h), before addition of the TLR9 agonist for 5 h. (A) Gene expression level of ISGs such as GBP1, IRF7, ISG54, MxB, OAS2, and CXCL10 were quantified at 5 h. (B and C) Gene expression levels of XBP1s/XBP1 and PHGDH were quantified by qPCR. Individual donors are indicated, all results are represented as mean ± SEM, and statistical significance was evaluated using Mann–Whitney U test. ns, P > 0.05; *, P < 0.05; **, P < 0.01.

References

    1. Acin-Perez, R., Salazar E., Kamenetsky M., Buck J., Levin L.R., and Manfredi G.. 2009. Cyclic AMP produced inside mitochondria regulates oxidative phosphorylation. Cell Metabol. 9:265–276. 10.1016/j.cmet.2009.01.012 - DOI - PMC - PubMed
    1. Adamson, B., Norman T.M., Jost M., Cho M.Y., Nunez J.K., Chen Y., Villalta J.E., Gilbert L.A., Horlbeck M.A., Hein M.Y., et al. . 2016. A multiplexed single-cell CRISPR screening Platform enables systematic dissection of the unfolded protein response. Cell. 167:1867–1882.e21. 10.1016/j.cell.2016.11.048 - DOI - PMC - PubMed
    1. Affandi, A.J., Carvalheiro T., Ottria A., de Haan J.J., Brans M.A.D., Brandt M.M., Tieland R.G., Lopes A.P., Fernandez B.M., Bekker C.P.J., et al. . 2022. CXCL4 drives fibrosis by promoting several key cellular and molecular processes. Cell Rep. 38:110189. 10.1016/j.celrep.2021.110189 - DOI - PubMed
    1. Ah Kioon, M.D., Tripodo C., Fernandez D., Kirou K.A., Spiera R.F., Crow M.K., Gordon J.K., and Barrat F.J.. 2018. Plasmacytoid dendritic cells promote systemic sclerosis with a key role for TLR8. Sci. Transl. Med. 10:eaam8458. 10.1126/scitranslmed.aam8458 - DOI - PMC - PubMed
    1. Barrat, F.J., Elkon K.B., and Fitzgerald K.A.. 2016. Importance of nucleic acid recognition in inflammation and autoimmunity. Annu. Rev. Med. 67:323–336. 10.1146/annurev-med-052814-023338 - DOI - PubMed

Publication types