. 2022 Oct;200(1-2):107-117.
doi: 10.1007/s00442-022-05237-1. Epub 2022 Sep 2.

Reduced pollinator service in small populations of Arabidopsis lyrata at its southern range limit

Affiliations

Reduced pollinator service in small populations of Arabidopsis lyrata at its southern range limit

Darío Sánchez-Castro et al. Oecologia. 2022 Oct.

Abstract

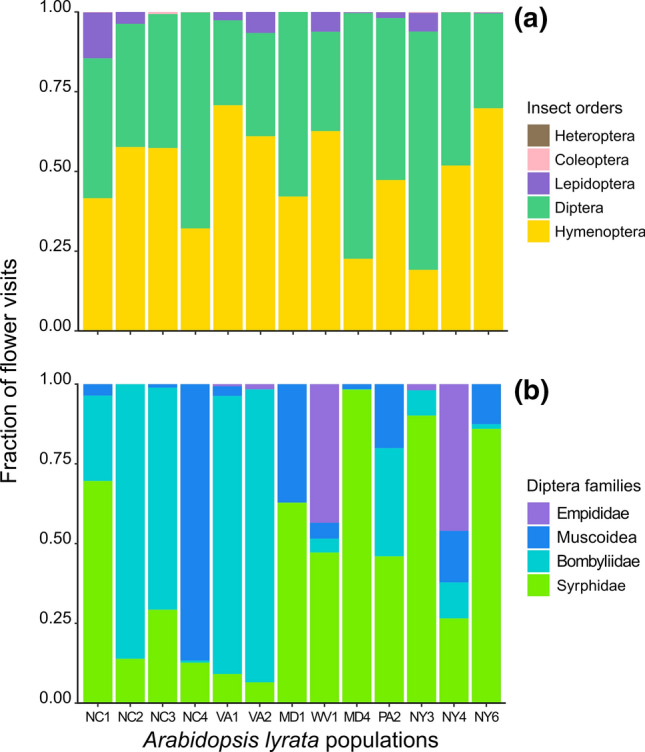
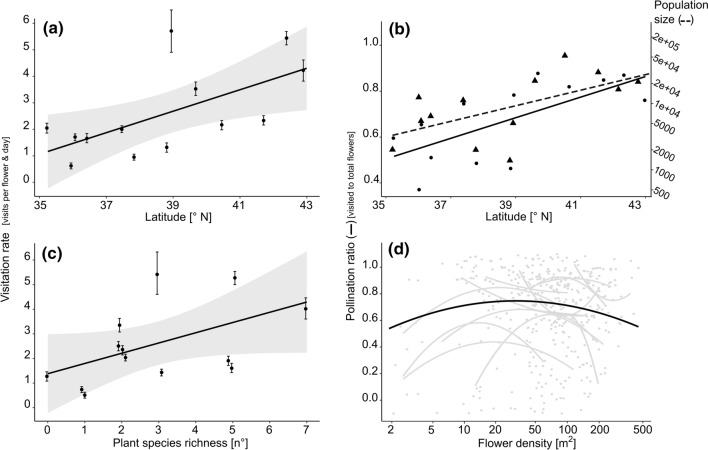
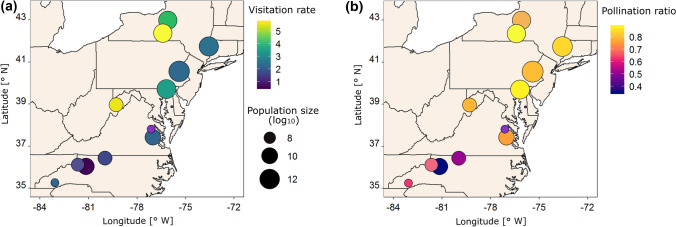
Even though a high fraction of angiosperm plants depends on animal pollinators for sexual reproduction, little is known how pollinator service changes across the ranges of plant species and whether it may contribute to range limits. Here, we tested for variation in pollinator service in the North American Arabidopsis lyrata from its southern to northern range edge and evaluated the driving mechanisms. We monitored insect pollinators using time-lapse cameras in 13 populations over two years and spotted 67 pollinating insect taxa, indicating the generalist nature of this plant-pollinator system. Pollinator service was highest at intermediate local flower densities and higher in large compared to small plant populations. Southern populations had generally smaller population sizes, and visitation rate and pollination ratio decreased with latitude. We also found that pollinator visitation was positively correlated with the richness of other flowering plants. This study indicates that plant populations at southern range edges receive only marginal pollinator service if they are small, and the effect of lower pollination is also detectable within populations across the range when the local flower density is low. Results, therefore, suggest the potential for an Allee effect in pollination that manifests itself across spatial scales.

Keywords: Allee effect; Density; Latitudinal gradient; Pollination; Preference.


Conflict of interest statement

The authors have no conflict of interest.

Figures

Fig. 1
Fig. 1
a Map of eastern North America with the 13 Arabidopsis lyrata populations studied for pollinator service, and b images of A. lyrata flowers with a wild bee visiting and c a time-lapse camera monitoring a patch of flowers in the field. In panel a, populations are indicated by dots and a three-digit abbreviation (Table S1, the two letters stand for the state in the US, and the number is the latitudinal position within the state). Shades of blue indicate habitat suitability for the species based on niche modelling, where minimum temperature in early spring and precipitation of the wettest quarter were the climatic variables that predicted the presence of the species best
Fig. 2
Fig. 2
Fraction of flower visits by a different insect orders or b families within Diptera in 13 populations of Arabidopsis lyrata. Populations are sorted from south (left) to north (right). For population abbreviations see legend Fig. 1
Fig. 3
Fig. 3
Relationship between a visitation rate (per flower and day) and latitude, b pollination ratio (visited flowers to total flowers) and latitude, c visitation rate and plant species richness, d pollination ratio and local flower density in Arabidopsis lyrata populations. In panels a and c, symbols represent population estimates, in panel d, they represent patch estimates. In b, circles represent pollination ratio and triangles population size. Population means were calculated by averaging first across replicate cameras within population and year, then across cameras, and finally across years, if applicable. In a and c, standard errors calculated on the highest level of averaging are indicated. The black lines are model-predicted relationships (dashed line for population size), with lower and upper 95% confidence intervals. In d, curves represent quadratic relationships between pollination ratio and log10-transformed local flower density, across populations (in black) and for each population separately (in grey). For statistics, see Tables 1 and 2
Fig. 4
Fig. 4
Maps illustrating the relationships among a visitation rate or b pollination ratio with population size, and the geography of the 13 populations of Arabidopsis lyrata. The size of the circles represents the population size, and the colour indicates the population mean of a visitation rate or b pollination ratio. Population means were calculated by averaging first across replicate cameras within population and year, then across cameras, and finally across years, if applicable

References

    1. Bates D, Mächler M, Bolker B, Walker S (2015) Fitting linear mixed-effects models using lme4. J Stat Softw 67:1–48. 10.18637/jss.v067.i01
    1. Battisti A, Stastny M, Buffo E, Larsson S. A rapid altitudinal range expansion in the pine processionary moth produced by the 2003 climatic anomaly. Glob Change Biol. 2006;12:662–671. doi: 10.1111/j.1365-2486.2006.01124.x. - DOI
    1. Benning JW, Moeller DA. Maladaptation beyond a geographic range limit driven by antagonistic and mutualistic biotic interactions across an abiotic gradient. Evolution. 2019;73:2044–2059. doi: 10.1111/evo.13836. - DOI - PubMed
    1. Biesmeijer JC, Roberts SPM, Reemer M, Ohlemüller R, Edwards M, Peeters T, et al. Parallel declines in pollinators and insect-pollinated plants in Britain and the Netherlands. Science. 2006;313:351–354. doi: 10.1126/science.1127863. - DOI - PubMed
    1. Briers RA. Range limits and parasite prevalence in a freshwater snail. Proc R Soc b Biol Sci. 2003;270:S178–S180. doi: 10.1098/rsbl.2003.0046. - DOI - PMC - PubMed