

Validity of microsphere depositions for regional myocardial flows
- PMID: 3605365
- PMCID: PMC3085492
- DOI: 10.1152/ajpheart.1987.253.1.H184
Validity of microsphere depositions for regional myocardial flows
Abstract
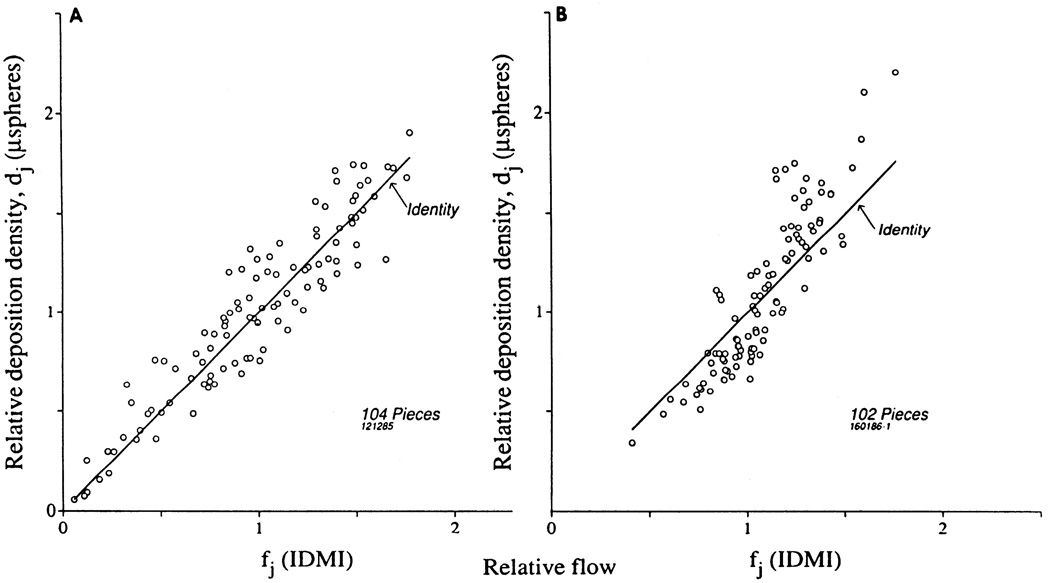
Due to the particulate nature of microspheres, their deposition in small-tissue regions may not be strictly flow dependent. To evaluate the importance of rheological and geometric factors and random error, their deposition densities in small regions of rabbit hearts were examined in comparison with those of a new "molecular microsphere," 2-iododesmethylimipramine (IDMI), whose high lipid solubility allows it to be delivered into tissue in proportion to flow, and whose binding in tissue prevents rapid washout. 141Ce- and 103Ru-labeled 16.5-micron spheres in one syringe and [125I]- and [131I]DMI in another syringe were injected simultaneously into the left atrium of open-chest rabbits, while obtaining reference blood samples from the femoral artery. Hearts were removed 1 min after injection, cut into approximately 100 pieces averaging 54 mg, and the regional deposition densities calculated for each tracer from the isotopic counts. Correlations between the differently labeled microspheres were r greater than 0.95 and for the two IDMIs were greater than 0.98. Scatter plots of sphere densities vs. IDMI densities showed that differences between microspheres and IDMI had substantial scatter, 0.87 less than r less than 0.96 and were not random. Microsphere depositions tended to be lower than IDMI depositions at low flows and higher at high flows. The tendency for spheres to be deposited preferentially in high-flow regions may be explained by a bias at bifurcations toward entering the branch with higher flow and secondarily toward entering those branches that are straighter. We conclude that microspheres are generally adequate for estimating regional flows but suffer systematic error when the regions of interest are supplied via arteries of diameters only a few times those of the microspheres.
Figures


References
-
- Baer RW, Payne BD, Verrier ED, Vlahakes GJ, Moldowitch D, Uhlig PN, Hoffman JIE. Increased number of myocardial blood flow measurements with radionuclide-labeled microspheres. Am. J Physiol. 1984;246:H418–H434. (Heart Circ. Physiol. 15) - PubMed
-
- Bassingthwaighte JB, Carlson EC. Flexibility of capillaries in the heart. Physiologist. 1981;24:106. (Abstract)
-
- Bassingthwaighte JB, Dobbs WA, Yipintsoi T. Heterogeneity of myocardial blood flow. In: Maseri A, editor. Myocardial Blood Flow in Man: Methods and Significance in Coronary Disease. Torino, Italy: Minerva Med.; 1972. pp. 197–205.
-
- Bassingthwaighte JB, Goresky CA. Handbook of Physiology. The Cardiovascular System. Microcirculation. part 1. sect. 2, vol. IV. Bethesda, MD: Am. Physiol. Soc; 1984. Modeling in the analysis of solute and water exchange in the microvasculature. chapt. 13; pp. 549–626.
Publication types
MeSH terms
Substances
Grants and funding
LinkOut - more resources
Full Text Sources
Other Literature Sources