. 2022 Nov 7;219(11):e20212228.
doi: 10.1084/jem.20212228. Epub 2022 Sep 2.

Megakaryopoiesis impairment through acute innate immune signaling activation by azacitidine

Affiliations

Megakaryopoiesis impairment through acute innate immune signaling activation by azacitidine

Ujunwa Cynthia Okoye-Okafor et al. J Exp Med. .

Abstract

Thrombocytopenia, prevalent in the majority of patients with myeloid malignancies, such as myelodysplastic syndrome (MDS) or acute myeloid leukemia (AML), is an independent adverse prognostic factor. Azacitidine (AZA), a mainstay therapeutic agent for stem cell transplant-ineligible patients with MDS/AML, often transiently induces or further aggravates disease-associated thrombocytopenia by an unknown mechanism. Here, we uncover the critical role of an acute type-I interferon (IFN-I) signaling activation in suppressing megakaryopoiesis in AZA-mediated thrombocytopenia. We demonstrate that megakaryocytic lineage-primed progenitors present IFN-I receptors and, upon AZA exposure, engage STAT1/SOCS1-dependent downstream signaling prematurely attenuating thrombopoietin receptor (TPO-R) signaling and constraining megakaryocytic progenitor cell growth and differentiation following TPO-R stimulation. Our findings directly implicate RNA demethylation and IFN-I signal activation as a root cause for AZA-mediated thrombocytopenia and suggest mitigation of TPO-R inhibitory innate immune signaling as a suitable therapeutic strategy to support platelet production, particularly during the early phases of AZA therapy.


Conflict of interest statement

Disclosures: C. Pallaud reported “other” from Novartis Pharmaceuticals during the conduct of the study. P.M. Ramos is an employee of Novartis Pharmaceuticals. A. Shastri reported grants from Kymera Therapeutics, personal fees from Janssen Pharmaceuticals, and “other” from NACE outside the submitted work. A. Verma reported “other” from Stelexis, Throws Exception, and Bakx Therapeutics; and grants from Curis, Prelude, and BMS outside the submitted work. C. Heckman reported grants from Novartis Pharmaceuticals during the conduct of the study; and grants from BMS/Celgene, Kronos Bio, Oncopeptides, Orion Pharma, Innovative Medicines Initiative Joint Undertaking project HARMONY, and WntResearch outside the submitted work. B. Will reported grants from NIH-NCI, NIH-NIDDK, GlaxoSmithKline, and Novartis; and personal fees from Novartis during the conduct of the study. No other disclosures were reported.

Figures
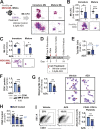
Figure 1.
Figure 1.
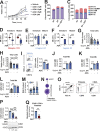
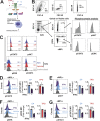
AZA inhibits Mk progenitor growth and differentiation. (A–C) Quantification of Mk CFU in primary MNC specimen by MegaCult assay (containing 0.5 µg/ml EP to stimulate Mk CFU growth) in the absence or presence of AZA (0.3 μM). (A) Experimental outline and examples of scored immature and mature Mk CFU picture inserts (scale bars indicate 100 µm). (B and C) Number of Mk CFU represented as box plots with min to max (whiskers) normalized to cultures lacking AZA (only containing EP) for healthy control-derived MNC (B; N = 5 biological specimens in independent experiments), and MDS/AML patient MNC (C; N = 3 independent biological specimens in independent experiments). Representative images of immature and mature Mk colonies are displayed below each subpanel (scale bar depicts 100 µm). (D–H) Assessment of Mk cell growth and differentiation in Mk promoting liquid cultures in the absence or presence of AZA. (D) Experimental outline. (E) The total number of CD41+ cMPL+ cells inferred from the total number of viable cells counted by Trypan Blue staining multiplied by the relative frequency of CD41+ cMPL+ cells (by FACS) on day 13 of the culture. Bar graphs depict averages ± SD for each group along with individual data points (filled squares) as fold changes normalized to Mk differentiation stimulated with EP but lacking AZA. N = 3 independent biological specimens. (F) Quantification of CD41 Mk protein following treatment of CB CD34+ in Mk differentiation cultures for 14 d by Western blot. Bar graphs represent mean CD41 protein ± SD quantified as fold change vehicle treated. N = 4 independent biological samples with technical repeats. (G) Cytomorphological assessment of maturing Mk cells (left; red arrows; scale bar depicts 30 µm). Bar graphs (right) represent means of maturing Mk cells ± SD normalized to Mk differentiation–promoting cultures lacking AZA. N = 3 independent biological samples. (H) Polyploidy quantification by propodium iodide (PI) and CD41 co-staining, followed by FACS analysis. CD41+ cells were sub-gated at 2N, 4N, or ≥8N for DNA content respectively. Bar graphs represent mean ± SD of frequencies of cells in each gate and expressed as fold changes compared with base cultures lacking Mk stimulation (by EP) and AZA (no treatment [NT] indicated by gray line); filled squares show normalized individual data values. N = 5 biological specimens in independent experiments. (I) Frequency of PLTs (CD45 CD61+) cells. Absolute counts determined by CD45 CD61+ FACS staining, manual counting, and count beads, and expressed as a fold change of vehicle control. Representative FACS plots (right). Bar graphs (left) depict mean PLT counts ± SD for three biological samples in independent experiments. Statistical significance indicated as *P < 0.05, **P < 0.01, ***P < 0.001 by Student’s t test. Source data are available for this figure: SourceData F1.
Figure S1.
Figure S1.
Decreased Mk cell growth and differentiation upon treatment with AZA or DEC. (A) Effects of increasing doses of AZA on UKE1 cell growth. Cell viability was quantified by Trypan Blue exclusion following culture of cells for the indicated time points (in hours) in technical replicates. (B and C) Quantification of myeloid colony formation of MNC in the presence or absence of AZA. MNC were seeded in Human Methylcellulose Complete Media (R&D; HSC003) either in the absence (no treatment, NT) or presence of 5 µg/ml EP alone, or in addition to 0.3 µM AZA (EP+AZA). Colony formation of healthy volunteer (B) or AML patient–derived BM-MNC (C). Shown are averages and standard deviations of the number of CFU of the granulocytic (CFU-G), granulocytic/erythroid/monocytic/Mk (CFU-GEMM), granulocytic/monocytic (CFU-GM), monocytic (CFU-M) and erythroid lineages (BFU-E). N = 3 biological/group in technical duplicate. (D–F) Quantification of immature and mature Mk CFU in healthy control–derived MNC by MegaCult assay (containing TPO [D] or EP [E and F] to stimulate Mk CFU growth) in absence or presence of AZA (0.3 μM). The number of Mk CFU is represented as box plots with min to max (whiskers) and normalized to cultures lacking AZA (containing only TPO or EP, respectively). Mk CFU upon culture in (D) 50–100 ng/ml TPO (N = 7 biological replicates), (E) 0.3 µg/ml EP (N = 4 biological replicates), and (F) 5 µg/ml EP (N = 3 biological replicates). (G–M) Assessment of cell growth, differentiation and maturation in liquid Mk differentiation–promoting cultures (containing 5 µg/ml EP) in the absence and presence of AZA (0.3 μM) at culture day 14. (G and H) Cell viability by Trypan Blue exclusion counting, absolute counts (G) and expressed as fold changes compared with EP treatment controls (H); N = 3 independent biological samples. (I) Representative FACS contour plots of CD41a-expressing (CD41+) cells (left). Bar graphs depict means ± SD of relative frequencies of CD41+ cells of as fold changes compared with EP containing cultures lacking AZA (right). N = 4 biological specimen in independent experiments. (J–L) Analysis of cell surface markers associated with Mk differentiation and maturation. Means and SD of MFI values of CD41 (J), CD61 (K), and cMPL receptors (L) gated on CD41+ cMPL+ cells as fold changes compared with EP treatment controls; filled squares show normalized individual data values. N = 3 independent experiments and biological specimens. (M) Quantification of DNA content by PI staining in CD41+ MNC at day 14 in Mk differentiation–promoting cultures (containing EP) without AZA. CD41+ cells were subgated at 2N, 4N, or ≥8N for DNA content, respectively. Bar graphs represent mean ± SD of frequencies of cells in each gate and expressed as fold changes compared with base cultures lacking Mk stimulation (by EP; vehicle, indicated by the black line); filled squares show normalized individual data values. N = 8 biological specimens in independent experiments. (N) Schematic of PLT production from HSPCs. (O) Representative gating strategy for the evaluation of CD45 CD61+ PLTs. (P) Quantification of CD41 protein levels by Western blot using CD34+ CB cells after 14 d in Mk differentiation stimulating cultures. N = 2–4 biological samples with experimental and technical replicates. Bar graphs depict mean ± SD as fold change of vehicle control. AZA treatment as in Fig. 1 F. (Q) Quantification of PLTs (CD45 CD61+). Absolute counts determined by manual counting and count beads and expressed as a fold change of vehicle control. N = 3 independent experiments and biological samples. Statistical significance indicated as *P < 0.05, **P < 0.01, ***P < 0.001 by Student’s t test; n.s., not significant. Source data are available for this figure: SourceData FS1.
Figure 2.
Figure 2.
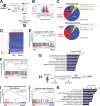
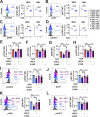
AZA impairs Mk gene expression programs and induces IFN-I. (A–G) Assessment of gene expression in FACS-sorted cMPL+ cells after culture of MNC for 16 h in TPO-R–stimulating conditions in the presence or absence of AZA. N = 3 biological samples in independent experiments. (A) Experiment outline. MNC were cultured in presence of TPO-RA (100 ng/ml hrTPO or 5 µg/ml EP) in the absence (vehicle control) or presence of AZA (0.3 µM AZA) before FACS sort for cMPL+ cells and subsequent microarray analysis. (B) Volcano plot depicting the distribution of differentially expressed genes in cMPL+ cells upon AZA treatment compared with vehicle-treated cells. (C) Assessment of genome-wide distribution of differentially expressed genes (upregulated genes, top pie chart; downregulated genes, bottom pie chart). (D) Hierarchical clustering analysis of differentially expressed genes. (E and F) GSEA identifies (E) significant upregulation of myeloid genes of granulocytic monocytic progenitors (GMP) versus Mk erythroid progenitors (MEP) in AZA-treated cells compared with vehicle control (GSE15330). (F) Significant enrichment of genes upregulated in IFNα-stimulated T cells after AZA treatment (normalized enrichment score = 1.54; nominal P value = 0.006; GSE40666). (G) IPA showing enrichment of biological processes upregulated in AZA-treated samples compared with controls (EnrichR analysis, GO Biological Process 2018). The red line represents the cutoff of significance (blue bars represent the −log10 of the significance [P value]). (H–J) Differential gene expression by RNA-seq and GSEA enrichment analysis of differentially expressed genes in MDS/AML patient–derived MNC before and after AZA exposure in vivo. N = 7. (H) Experimental outline (Helsinki cohort). (I) GSEA enrichment of genes involved in negative regulation of Mk differentiation and upregulated after AZA treatment (normalized enrichment score = 1.83; nominal P value = 0; false discovery rate = 0.027). (J) Significant upregulation of IFNα response genes in post-AZA treatment group (normalized enrichment score = 1.73; nominal P value = 0; false discovery rate = 0.006). (K) Enrichment analysis (IPA) of gene ontology biological processes of differentially expressed genes in CD34+ cells from clinical responders to AZA therapy before and after in vivo exposure to AZA (GSE77750). The red line represents the cutoff of significance (blue bars represent the −log10 of the significance [P value]). IFN-associated pathways are bolded.
Figure 3.
Figure 3.
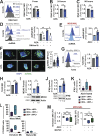
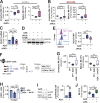
Innate immune pathway activation upon AZA in MNC and Mk cell populations. (A–C) Quantification of RNA 5-methyl cytosines (RNA 5mC) by FACS analysis of CB-MNC in the absence or presence of AZA (0.3 µM) in Mk-promoting cultures. Bar graphs represent quantifications of RNA 5mC normalized mean fluorescence intensity (MFI) at each time point as mean ± SD along with individual data points (filled squares; N = 3–11 independent experiments and biological replicates). (A) Representative FACS histogram (left; control [gray] and AZA [blue]; counts normalized to modal) and quantification of MFI (right) normalized to controls devoid of AZA at 1 h, 24 h (B), and day 4 (C). (D–F) Quantification of dsRNA in cells after a 1 h Mk-promoting culture in the absence or presence of AZA. (D and E) dsRNA quantification in MNC by FACS analysis. RNAseIII-treated cells as background controls. Representative histogram depicts counts normalized to modal. Bar graphs represent changes in dsRNA expressed as fold changes of control (mean) ± SD of CB or BM-MNC (N = 3 biological samples in independent experiments; D), and MDS/AML patient–derived MNC (N = 4 biological samples in independent experiments; E). (F) Immunocytochemistry and confocal fluorescence microscopy to visualize dsRNA (green) along with nuclear staining (DAPI/blue) in CB-derived CD34+ cells in cultures lacking AZA (vehicle [−]) or upon exposure to AZA (0.3 µM; left representative images of cells; scale bar: 10 µm). Bar graphs show significantly increased dsRNA species in the presence of AZA compared with vehicle-treated control cells. Bar graphs depict mean ± SD of MFI per cell for each group along with individual data points (N = 2 biological specimens; 21–37 cells/field of view). (G and H) Quantification of TLR3 protein levels by flow cytometry after 1 h of culture in Mk-promoting medium in the absence (vehicle, −) or presence of AZA in healthy MNC (G), or CD34+ cells (H). (I) MDA5 protein levels by Western blot analysis 24 h after treatment. Bar graphs represent mean MDA5 expression ± SD normalized to actin loading control. Representative blot displayed underneath. (J) IFNβ protein expression by Western blot within 24 h of treatment in absence or presence of AZA. Bar graphs represent mean protein ± SD normalized to actin loading control. Representative blot displayed underneath. N = 4 independent biological specimens in technical duplicates. (K) Assessment of intracellular IFNβ levels by flow cytometry after 1 h of culture in the absence (vehicle) or presence of AZA in Mk progenitor cell populations. Quantification of the fraction of IFNβ+ cells within each cell population. Graph shows relative cell frequencies of IFNβ+ cells normalized to vehicle controls represented as box plots with min to max (whiskers); N = 3 independent biological specimens in independent experiments. (L) Quantification of Mk CFU within purified CD34+ cMPL immature myeloid, CD34+cMPL+ Mk progenitor, and CD34 cMPL+ mature Mk cell populations by MegaCult assay. N = 3 independent experiments and biological samples. (M) Quantification of MDS/AML MNC-derived Mk CFU in the presence of AZA and upon TLR3 downstream signaling inhibition by TBK1/IKKe inhibition (BX795) in MegaCult assays. Box plots show the number of immature Mk (left) and mature Mk (right) CFU and min to max (whiskers) normalized to TPO only cultures. N = 4 biological replicates in independent experiments. Statistical significance indicated as *P < 0.05, **P < 0.01, ***P < 0.001 by Student’s t test; n.s., not significant. Source data are available for this figure: SourceData F3.
Figure S2.
Figure S2.
Induction of dsRNA and ERV-independent activation of IFN-I production upon AZA treatment. (A) Quantification of 5mC abundance using intracellular FACS analysis. Shown are histograms of MFI of cells stained with an anti-5mC antibody following either single RNAse (top, violet), DNAse (second from top, blue), or no RNAse or DNAse (second from bottom, brown) treatment; unstained cells (bottom, gray) as controls. MFI values are indicated for each control (in parentheses). (B and C) Quantification of dsRNA abundance in absence or presence of AZA in CB-derived CD34+ cell cultures without TPO-R stimulation by intracellular FACS after 1 h of treatment (B), and immunofluorescence after 30 min of treatment (C). (B) Representative FACS histogram (left; control [gray] lacking AZA and AZA-treated [blue] cells; counts normalized to modal) and quantification of MFI (right) normalized to controls devoid of AZA. Bar graphs represent mean ± SD along with individual data points (filled squares). N = 3 independent experiments and biological specimens. (C) dsRNA immunofluorescence (green) in contrast to nuclear stain DAPI (blue). Scale bar: 10 µm. CD34+ cells treated with AZA and incubated in RNaseIII served as background controls. dsRNA quantification within individual cells MFI as mean ± SD. (D) dsRNA abundance in CB-MNC by intracellular FACS analysis. CB-MNC treated in absence (control, gray) or presence of AZA (blue); Bar graphs represent mean ± SD of expression values as fold changes of vehicle; N = 3 independent experiments and biological samples. RNAseIII-treated cells as background controls. (E) dsRNA abundance in CB-MNC by intracellular FACS analysis. CB-MNC treated with increasing dose of AZA (0.3 µM, blue; or 1 µM, purple) compared with vehicle control (control, gray). N = 3 biological samples. Bar graphs represent mean ± SD of expression values as fold changes of vehicle control cells. (F–H) Evaluation of RNA 5mC and dsRNA changes in DEC-treated MNCs represented as mean ± SD of vehicle controls in the absence or presence of 0.3 µM AZA or DEC (0.3 or 1 µM). RNA 5mC MFI (F); dsRNA MFI (G and H). (I) MAVS transcripts by qRT-PCR of AML MNC in the absence or presence of AZA after 24 and 1 h after culture lacking TPO-R–stimulating agents. Bar graphs represent means ± SD of GAPDH normalized relative mRNA expression (arbitrary units) in technical triplicates. (J) MDA5 mRNA expression by qRT-PCR after treatment of AML MNC with or without AZA for 24 (left) or 1 h (right). Bar graphs represent means ± SD of GAPDH-normalized relative mRNA expression (arbitrary units) in technical triplicates. (K) MDA5 intracellular protein levels quantified by intracellular FACS analysis. Healthy donor MNC cultured for 1, 24, or 96 h in the absence or presence of 0.3 μM AZA in TPO-R stimulating cultures (containing 5 µg/ml EP). Bar graphs represent means ± SD of MDA5 protein levels expressed as fold changes compared with controls (EP); N = 3 independent experiments and biological samples. (L) Measurement of secreted IFNα by ELISA in patient-derived MNC in after 1 h in Mk differentiation–stimulating cultures in presence or absence of AZA. IFNα levels are represented as box plots with min to max (whiskers) as pg/cell; N = 6 independent experiments and biological samples. (M) IFNβ protein expression within 24 h of treatment in absence (−) or presence (+) of AZA or DEC by Western blot analysis. Bar graphs represent mean protein ± SD normalized to actin loading control. Representative blot displayed. N = 4 independent biological specimens in technical duplicates. AZA-only data displayed in Fig. 3 J. (N–P) qRT-PCR of ERV transcripts, SATA (N), LTR57 (O), MERD4 (P) of healthy volunteer and AML patient–derived MNC treated for 24 h with AZA in TPO-R–stimulating cultures (with 5 µg/ml EP). Graph depicts mean expression (black line) for four independent experiments; symbols represent independent samples. (Q) Assessment of ERV-associated gene expression correlation in AZA- and control-treated MPL-expressing cells. Shown are expression averages of 125 genes embedded with 189 ERVs as detected by microarray analysis (Fig. 2, A and B). Linear regression model shows the expression of ERV-associated genes is statistically correlated (R2 = 0.95). Red lines indicate genes with detectable expression levels. (R) Enrichment analysis of TE (counts) in 679 genes differentially expressed (DEGs) in MPL+ MNC exposed to AZA (vs. mock controls) or 100× randomly sampled transcripts (not-DEGs). (S) Quantification of DNA 5mC levels in MNC upon 1, 24, and 96 h in culture in the absence or presence of AZA by intracellular FACS analysis. Bar graphs depict means ± SD of MFI normalized to cultures lacking AZA along with individual data points. N = 3–4 independent experiments and biological samples. Statistical significance indicated as *P < 0.05, **P < 0.01, ***P < 0.001 by Student’s t test; n.s. or no asterisk, not significant (O, P, and R) or no statistical testing possible as individual specimen were investigated (I and J). Source data are available for this figure: SourceData FS2.
Figure 4.
Figure 4.
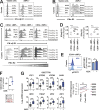
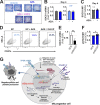
Activation of IFNAR signaling upon AZA exposure. (A) Mechanistic scheme on autocrine IFNAR receptor activation. (B and C) Quantification of IFNAR1 and IFNAR2 cell surface proteins on CD34+ cMPL, CD34+ cMPL+, and CD34 cMPL+ cells by FACS. Representative FACS plots for IFNα/β R1 IFNα/β R2 expression in parental cell populations (indicated on top of plots; B) and (C) quantification of relative frequencies of cells expressing responsive heterodimeric IFNAR receptors (IFNα/β R1+ IFNα/β R2+ cells) within parental cell populations represented as box plots with min to max (whiskers); N = 4 biological specimens in independent experiments. (D and E) Quantification of phosphorylated (pSTAT1) and total STAT1 protein levels by Western blot analysis upon AZA treatment of CB MNCs for 1 h in Mk-promoting cultures (containing 5 µg/ml EP) in the absence or presence of AZA (0.3 µM). Example blot (D) and bar graphs representing mean pSTAT1 protein levels ± SD normalized to total STAT1 protein and actin loading controls (E). N = 3 independent biological specimens in technical duplicates. (F–H) Quantification of STAT1/IFN-I target expression, IFIT1 (left), and ISG15 (right) by qRT-PCR analysis in cells after Mk prompting culture (containing 5 µg/ml EP) in the absence (control) or presence of AZA. Bar graphs represent GAPDH-normalized average expression values ± SD depicted as fold changes to control cultures as well as individual data points in healthy MNC after culture for 2 h (F), and AML patient–derived MNC after culture for 2 h (G), as well as 24 h (H). (I) SOCS1 protein expression by Western blot analysis in healthy or AML MNC after 1 h culture in the absence or presence of 0.3 μM AZA. Black line represents mean expression of actin-normalized individual protein levels depicted as fold changes to vehicle control. N = 2 (healthy) and 2 (AML) in independent experiments. Statistical significance indicated as *P < 0.05, **P < 0.01, ***P < 0.001 by Student’s t test (C, E, F, and I); n.s., not significant. Source data are available for this figure: SourceData F4.
Figure S3.
Figure S3.
Differential sensitivity of HSPC to IFN-I activation. (A–D) Assessment of IFNAR1 and IFNAR2 expressing cells by FACS. (A and B) Characterization of IFNAR1 (A) and IFNAR2 (B) expression in healthy donor MNCs (CB- and BM-derived; gated on total viable cells, left; and cMPL+ Mk cells, right). N = 4 biological samples. (C and D) Quantification of the number of cells with IFNAR1 and IFNAR2 receptor expression on CD34+ cMPL immature myeloid cells, CD34+ cMPL+ immature Mk cells, and CD34 cMPL+ mature Mk cells. N = 4 biological samples in independent experiments. Representative FACS plots (C) depict receptor expression in order of increasing Mk differentiation. Graphs (D) show means (black line) and individual data points of percentages of IFNAR-positive cells within purified cell populations) expressed as fold changes compared with the frequency of IFNAR+ cells within CD34 cMPL+ mature Mk cell populations. (E) Quantification of phosphorylated STAT1 protein levels by phosphoflow analysis in CD34+ cMPL+ cells. MNC were cultured for 1 h in Mk differentiation cultures (containing 5 µg/ml EP) in the absence or presence of AZA. Representative FACS histogram of pSTAT1 signal in CD34+ cMPL+ cells (left; vehicle control [light blue] and AZA [dark blue]; counts normalized to modal) and quantification of pSTAT1 MFI (right) normalized to vehicle. Bar graphs represent mean ± SD along with individual data points; N = 3 biological samples in independent experiments. (F) SOCS1 mRNA by qRT-PCR after a 24 h culture of healthy or AML MNCs in the absence or presence of AZA. Individual data points expressed as fold change vehicle for each sample; N ≥ 5 independent specimen and experiments. (G) Expression of IFN-stimulated genes (specified on top of graphs) in CD34+ cells from responders to AZA therapy before and after AZA treatment (GSE77750). Normalized log2 expression values as box plots (N = 10 [control] and 13 [AZA]). (H) Quantification of SOCS1 mRNA expression in paired MDS/AML patient BM-MNC specimen before and after AZA treatment (N = 5). Statistical significance indicated as *P < 0.05, **P < 0.01, ***P < 0.001 by Student’s t test (D–G) and Welch’s t test (H); n.s., not significant.
Figure S4.
Figure S4.
AZA-mediated impairment of TPO-R signaling can be rescued by inhibition of IFN-I signaling. (A) Mechanistic scheme of TPO-R/cMPL activation by EP or TPO leading to phosphorylation of STAT5, AKT, and ERK. (B) Gating strategy for evaluation of phosphorylated STAT5, STAT3, AKT, and ERK by intracellular phosphoflow. FSC/SSC FVD (intact, single, viable) cells were subgated for MPL expression. cMPL+ cells were analyzed for phospho-STAT5, phospho-AKT, phospho-STAT3, and phospho-ERK1/2. Example histogram plots for a specimen derived from a patient with AML are shown. Background fluorescence from unstained cells (equivalent to isotype controls) are used as negative controls. (C) Representative histograms showing counts normalized to modal from healthy donor MNC in vehicle or AZA-treated samples compared with unstimulated control in TPO-R stimulating cultures. (D–G) TPO-R downstream signaling in CB MNC stimulated with 5 µg/ml EP or 100 ng/ml TPO (as indicated) in the absence or presence of 10 ng/ml IFNα. N = 3 independent experiments and biological samples. Bar graphs depict mean MFI ± SD of pSTAT5 (D), pAKT (E), pERK (F), and pSTAT3 (G) in MPL+ cells normalized to vehicle-treated controls. Statistical significance indicated as *P < 0.05, **P < 0.01, ***P < 0.001 by Student’s t test; n.s., not significant.
Figure 5.
Figure 5.
AZA impairs stimulation of TPO-R signaling in an IFN-I–dependent manner. (A–D) Quantification of TPO-R downstream signaling by phosphoflow analysis in MDS and AML patient BM-derived NC upon a 1 h culture to stimulate TPO-R (with 1 µg/ml EP) in the absence (vehicle) or presence of AZA (0.3 µM); cells in cultures lacking TPO-R stimulation as base line (gray). pSTAT5 (A), pAKT (B), pERK (C), and pSTAT3 (D) were measured on viable, single CD45 expressing cells. Representative histograms (left) show counts normalized to modal from healthy donor MNC. Graphs (right) depict mean MFI levels as fold change of baseline (no TPO-R) controls ± SD; N = 2–4 biological samples in independent experiments. (E–H) TPO-R downstream signaling in CB MNC stimulated with 100 ng/ml TPO, in the absence or presence of 0.3 μM AZA, or in combination with either VX-509 (JAK3i; 0.3 μM) or B18R peptide (1 µg/ml). Bar graphs depict mean MFI ± SD of pSTAT5 (E), pAKT (F), pERK (G), and pSTAT3 (H) in CD34+ cMPL+ immature Mk cells normalized to vehicle control. (I–L) Analysis of TPO-R stimulation (by EP) in healthy MNC treated for 1 h in the presence or absence of 10 ng/ml rhIFNα. Followed by evaluation of pSTAT5 (I), pAKT (J), pERK (K), and pSTAT3 (L) by phosphoflow analysis. Representative histogram plots depicting counts normalized to modal are shown. Bar graphs depict means ± SD of MFI values normalized to EP or TPO continuing control cultures lacking AZA; N = 3 independent experiments and biologic specimens. Statistical significance indicated as *P < 0.05, **P < 0.01, ***P < 0.001 by Student’s t test; n.s., not significant.
Figure 6.
Figure 6.
Inhibition of IFN-I signaling restores megakaryopoiesis in the presence of AZA. (A and B) Quantification of Mk CFU in MNC specimen by MegaCult assay (containing TPO-RA [100 ng/ml hrTPO or 5 µg/ml EP]) in the absence or presence of AZA (0.3 µM) alone or in combination with 0.3 μM JAK3i (VX-509). Box plots show the number of immature Mk (left) and mature Mk (right) CFU and min to max (whiskers) normalized to EP single agent control cultures. N = 9 biological replicates in independent experiments. Mk CFU quantification using healthy CB MNC specimen (A), or (B) MDS/AML patient–derived MNC (B). (C–E) Quantification of SOCS1 expression after TPO-R–stimulating culture (containing 100 ng/ml TPO or 5 µg/ml EP) in the absence or presence of AZA alone, or along with 0.3 μM VX-509 or 1 mg/ml B18R peptide. (C) Quantification of SOCS1 mRNA by qRT-PCR after 2 h. Bar graphs represent GAPDH normalized relative mRNA expression means (arbitrary units) ± SD normalized to vehicle control. (D and E) SOCS1 protein quantification measured by (D) Western blot and (E) intracellular flow cytometry. Left: Representative FACS histogram depicting cell counts normalized to modal. Right: Box plots show the MFI values and min to max (whiskers) for SOCS1 protein expressed as fold changes vehicle control. N = 7 biological samples in independent experiments. (F–H) Sequential treatment with AZA rescues its inhibitory effects on Mk progenitor growth, differentiation, and maturation. (F) Experimental scheme outlining the sequential treatment culture model using CD34+ cells. (G) Number of Mk CFU represented as box plots with min to max (whiskers) enumeration by MegaCult assays in the presence of either EP alone throughout (EP; group A), EP and AZA throughout (EP+AZA; group B), or AZA in liquid pre-culture and subsequent addition of EP (AZA → D4 EP; group C) as fold changes compared with EP single agent cultures (group A); N = 3 biological replicates in four independent experiments. (H) FACS analysis of CD41 expressing cells after 14 d in sequential treatment liquid culture (as outlined in F). Bar graphs depict means of CD41-positive cell frequencies within viable singe cell parental populations normalized to EP single agent containing cultures ± SD for three independent experiments and biological samples. (I) Total p38, phospho-p38 (p-p38), and β-actin protein levels in healthy control or AML-derived MNC cultured in Mk-stimulating conditions (containing 5 µg/ml EP) in the absence or presence of AZA by Western blot (representative blot image [left] and automated image analysis assisted signal quantification [right]). Bar graphs represent β-actin normalized mean signal intensity (area under the curve) ± SEM of independent biological samples and experiments (N = 3). (J) Quantification of Mk CFU (MegaCult assays containing 5 µg/ml EP) of healthy control or AML patient–derived MNC cultured in the absence or presence of AZA with and without addition of 5 μM p38 inhibitor (p38i) SB203580. Box plots show the total number of Mk CFU and min to max (whiskers) normalized to EP single agent control cultures. N = 4 independent biological samples. Statistical significance indicated as *P < 0.05, **P < 0.01, ***P < 0.001 by Student’s t test (A–H, and J) or Kolmogorov–Smirnov (I); n.s., not significant. Source data are available for this figure: SourceData F6.
Figure S5.
Figure S5.
Inhibition of IFN-I rescues AZA mediated inhibition of megakaryopoiesis. (A) Representative MegaCult slides following culture of CB-derived MNC (healthy; scale bars indicate 10 mm). (B) SOCS1 mRNA by qRT-PCR upon treatment of healthy MNC treated for 4 d in the absence or presence of AZA in unstimulated cells (gray) or TPO-R stimulating culture containing EP (light blue). Bar graphs represent GAPDH normalized relative mRNA expression means (arbitrary units) ± SD normalized to vehicle controls (sample assayed in triplicates). (C) Quantification of SOCS1 protein by intracellular FACS of MNC treated for 4 d in the absence or presence of AZA. Bar graphs represent SOCS1 protein mean ± SD normalized to vehicle control for two independent experiments and biological samples. (D) Flow cytometry analysis of CD41a-expressing cells after 14 d in Mk-promoting conditions (containing 5 μg/ml EP) in the absence (EP) or presence of 0.3 μM AZA (EP + AZA) or sequentially (AZA → D4 EP). (E and F) Downregulation of SOCS1 by small hairpin (sh)RNA. Lentiviral knockdown in CB-derived cells for 48 h, followed by treatment for 2 h and subsequent phosphoflow analysis of pSTAT5. N = 2 independent experiments in technical triplicates. (F) pSTAT5 MFI mean ± SD after SOCS1 knockdown and treatment with AZA calculated as fold-change of scrambled (SCR) control. N = 5 independent experiments and biological samples with technical repeats. (G) Schematic of molecular mechanism of action proposed by this study. AZA triggers rapid and acute RNA demethylation and accumulation of immunogenic dsRNA species (1), which elicits TLR3/MDA5-dependent innate immune signaling activation (2), including the increase in IFN-I cytokine production and release independent of DNA hypomethylation and the reactivation of ERVs (3) in MNC, including stem and progenitor cells with Mk potential. Cells expressing high levels of functional heterodimeric IFN1R1/2 receptors at their cell surface activate downstream signaling (4), which increases SOCS1 abundance (5) in MNC including stem and progenitor cells with Mk potential. In progenitors with Mk lineage capacity, this leads to the inhibition of TPO-R agonist (endogenous TPO, or small molecule mimetic EP [EPAG])-mediated TPO-R activation (6) and an increase in megakaryopoiesis and PLT production (7). Mitigation of acute IFN-I activation can normalize TPO-R signaling, proliferation, and differentiation of Mk-potent stem and progenitor cells (8). Statistical significance indicated as *P < 0.05; **P < 0.01, ***P < 0.001 by Student’s t test; no asterisk or n.s., not significant.

References

    1. Abramovich, C., Shulman L.M., Ratovitski E., Harroch S., Tovey M., Eid P., and Revel M.. 1994. Differential tyrosine phosphorylation of the IFNAR chain of the type I interferon receptor and of an associated surface protein in response to IFN-alpha and IFN-beta. EMBO J. 13:5871–5877. 10.1002/j.1460-2075.1994.tb06932.x - DOI - PMC - PubMed
    1. Alcami, A., Symons J.A., and Smith G.L.. 2000. The vaccinia virus soluble alpha/beta interferon (IFN) receptor binds to the cell surface and protects cells from the antiviral effects of IFN. J. Virol. 74:11230–11239. 10.1128/jvi.74.23.11230-11239.2000 - DOI - PMC - PubMed
    1. Aparicio, A., and Weber J.S.. 2002. Review of the clinical experience with 5-azacytidine and 5-aza-2'-deoxycytidine in solid tumors. Curr. Opin. Investig. Drugs. 3:627–633 - PubMed
    1. Bachegowda, L., Morrone K., Winski S.L., Mantzaris I., Bartenstein M., Ramachandra N., Giricz O., Sukrithan V., Nwankwo G., Shahnaz S., et al. . 2016. Pexmetinib: A novel dual inhibitor of Tie2 and p38 MAPK with efficacy in preclinical models of myelodysplastic syndromes and acute myeloid leukemia. Cancer Res. 76:4841–4849. 10.1158/0008-5472.CAN-15-3062 - DOI - PMC - PubMed
    1. Benjamin, R., Khwaja A., Singh N., McIntosh J., Meager A., Wadhwa M., Streck C., Ng C., Davidoff A.M., and Nathwani A.C.. 2007. Continuous delivery of human type I interferons (alpha/beta) has significant activity against acute myeloid leukemia cells in vitro and in a xenograft model. Blood. 109:1244–1247. 10.1182/blood-2006-02-002915 - DOI - PubMed

Publication types

MeSH terms