. 2022 Nov;37(11):2186-2200.
doi: 10.1002/jbmr.4688. Epub 2022 Sep 14.

Characterization of Extracellular Vesicles in Osteoporotic Patients Compared to Osteopenic and Healthy Controls

Affiliations

Characterization of Extracellular Vesicles in Osteoporotic Patients Compared to Osteopenic and Healthy Controls

Jessica Pepe et al. J Bone Miner Res. 2022 Nov.

Abstract

Extracellular vesicles (EVs) are mediators of a range of pathological conditions. However, their role in bone loss disease has not been well understood. In this study we characterized plasma EVs of 54 osteoporotic (OP) postmenopausal women compared to 48 osteopenic (OPN) and 44 healthy controls (CN), and we investigated their effects on osteoclasts and osteoblasts. We found no differences between the three groups in terms of anthropometric measurements and biochemical evaluation of serum calcium, phosphate, creatinine, PTH, 25-hydroxy vitamin D and bone biomarkers, except for an increase of CTX level in OP group. FACS analysis revealed that OP patients presented a significantly increased number of EVs and RANKL+ EVs compared with both CN and OPN subjects. Total EVs are negatively associated with the lumbar spine T-score and femoral neck T-score. Only in the OPN patients we observed a positive association between the total number of EVs and RANKL+ EVs with the serum RANKL. In vitro studies revealed that OP EVs supported osteoclastogenesis of healthy donor peripheral blood mononuclear cells at the same level observed following RANKL and M-CSF treatment, reduced the ability of mesenchymal stem cells to differentiate into osteoblasts, while inducing an increase of OSTERIX and RANKL expression in mature osteoblasts. The analysis of miRNome revealed that miR-1246 and miR-1224-5p were the most upregulated and downregulated in OP EVs; the modulated EV-miRNAs in OP and OPN compared to CN are related to osteoclast differentiation, interleukin-13 production and regulation of canonical WNT pathway. A proteomic comparison between OPN and CN EVs evidenced a decrease in fibrinogen, vitronectin, and clusterin and an increase in coagulation factors and apolipoprotein, which was also upregulated in OP EVs. Interestingly, an increase in RANKL+ EVs and exosomal miR-1246 was also observed in samples from patients affected by Gorham-Stout disease, suggesting that EVs could be good candidate as bone loss disease biomarkers. © 2022 The Authors. Journal of Bone and Mineral Research published by Wiley Periodicals LLC on behalf of American Society for Bone and Mineral Research (ASBMR).

Keywords: MICROVESICLES; MIRNA; OSTEOCLAST; OSTEOPOROSIS; PROTEOMIC ANALYSIS.


Conflict of interest statement

The authors declare no conflict of interest.

Figures

Fig. 1
Fig. 1
Extracellular vesicle (EV) characterization. (A) Transmission electron microscopy analysis of EVs from controls (CN), osteopenic (OPN) and osteoporotic (OP) patients. (B) Dot‐plot of EVs isolated from CN, OPN, and OP women isolated by ultracentrifugation. Extracellular vesicles were loaded with CFSE and analyzed by FACS. (C) Quantification of EV number in 28 controls, 10 OPN and 12 OP samples. (D) Protein amounts in EV samples from different groups (28 CN, 30 OPN and 47 OP subjects). (E) Dot‐plot of 28 CN, 10 OPN and 12 OP EVs loaded with CFSE and labeled with RANKL antibody. (F) Absolute quantification of RANKL+ EVs. Boxplots with individual data points and exact p‐values are shown.
Fig. 2
Fig. 2
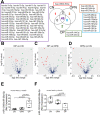
miRNome analysis of extracellular vesicles (EVs). (A) Venn diagram comparing miRNAs detected in EVs from eight controls (CN), nine osteopenic (OPN) and eight osteoporotic (OP) patients. MiRNAs for each group are listed in the colored box (purple: shared miRNAs between CN, OPN and OP; red: exclusive for CN; orange: exclusive for OPN; green: exclusive for OP; light blue: shared between OPN and OP). (B–D) Volcano plot of differentially expressed human mature miRNAs in (B) OP vs CN, (C) OP vs OPN, and (D) OPN vs CN. p‐value (−log10) is plotted on y‐axis and the expression fold change between the two experimental groups on the x‐axis. Statistically significant upregulated and downregulated miRNAs are marked in green and red, respectively. (E, F) Validation by Real‐Time RT‐PCR expression analysis of (E) miR‐1246 and (F) miR‐1224‐5p in EVs from seven CN, six OPN and six OP subjects. Boxplots with individual data points and exact p‐values are shown.
Fig. 3
Fig. 3
(A) Venn diagram showing number of identified proteins and their distribution in the three extracellular vesicles (EVs) groups [nine controls (CN), nine osteopenic (OPN), and nine osteoporotic (OP) patients. Proteins for each group are listed in the colored box (purple: shared protein expressed in CN, OPN and OP; red: exclusive for CN; orange: exclusive for OPN; light blue: exclusive for OP; yellow: shared between OP and CN; black: shared between CN and OPN; green: shared between OPN and OP). (B) Graphical representation of most represented biological processes and number of proteins involved in EV groups derived from PANTHER analysis.
Fig. 4
Fig. 4
Weighted gene co‐expression network analysis (WGCNA). (A) Clustering dendrogram of samples. Sample clustering was conducted to detect outliers. The Euclidean distance correlation was used as distance metrics. All samples are located in the clusters and passed the cutoff thresholds. The horizontal bars represent how the osteoporotic (OP)/osteopenic (OPN)/control (CN) conditions relate to the sample dendrogram: White (low value) represents control samples, light red (median value) represents OPN samples, and red (high value) represents OP samples. (B) Calculation and selection of optimal soft‐thresholding power. Influence of different powers on scale independence (left panel) and on mean connectivity (right panel). The selected soft‐thresholding power is indicated by a red arrow. (C) WGCNA module barplot. The bars show the size of each WGCNA detected module and the color represents the corresponding module labels. (D) Module‐trait associations. In a heatmap, each row corresponds to a module eigengene, and each cell contains the corresponding correlation and p‐value with OP/OPN/CN condition. The table is color‐coded by correlation according to the color legend on the right. (E) WGCNA network. The highlighted brown module represents a unique statistically significant module, associated with the OP/OPN/CN condition. In the WGCNA correlation network, the color of nodes is associated with the detected modules according to the labels. (F) WGCNA network. Correlation‐based interactions among proteins belonging to brown module in the WGCNA network (left panel). Protein–protein interaction network. Physical interactions among proteins of brown module in human interactome (right panel).
Fig. 5
Fig. 5
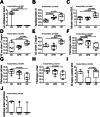
Detailed graphs of the 10 statistically significant proteins of the brown module in extracellular vesicles (EVs) from nine controls (CN), nine osteopenic (OPN), and nine osteoporotic (OP) patients. (A) von Willebrand factor, (B) apolipoprotein AI, (C) myosin reactive immunoglobulin light chain variable region (IGVL), (D) immunoglobulin (IG) mu chain C region, (E) IG γ chain C region, (F) fibrinogen α chain, (G) fibrinogen β chain, (H) fibrinogen γ chain, (I) IG kappa variable 2D2, (J) carboxyl ester hydrolase protein expression in CN, OPN and OP EVs. Boxplots with individual data points and exact p‐values are shown.
Fig. 6
Fig. 6
Effect of extracellular vesicles (EVs) on healthy donor (HD) osteoclasts. (A) PKH26 EVs are able to fuse with HD osteoclasts and osteoclast precursors (white arrows). Original magnification: ×20. (B, C) HD peripheral blood mononuclear cells were treated for 2 weeks with (i) medium with 1% ultracentrifuged FBS + 20 ng/mL M‐CSF + 30 ng/mL RANKL, (ii) medium with 1% ultracentrifuged FBS + control (CN) EVs, (iii) medium with 1% ultracentrifuged FBS + osteopenic (OPN) EVs, (iv) medium with 1% ultracentrifuged FBS + osteoporotic (OP) EVs. For treatment an EV pool from 10 CN, 10 OPN, and 10 OP subjects was used. (B) Representative pictures of TRAcP staining. Original magnification ×20. (C) Number of TRAcP positive multinucleated (>3 nuclei) cells. (D–J) HD osteoclasts were treated with pool of EVs from 10 CN, 10 OPN, or 10 OP patients, and after 48 hours RNA was extracted. Real‐time RT‐PCR expression analysis was performed for (D) c‐FMS, (E) TRAF6, (F) DC‐STAMP, (G) ATP6V0D2, (H) CTSK, (I) CLC7, and (J) TCIRG1 genes. (K) Bone resorption analysis of three HD osteoclasts plated on bovine bone slices and treated with an EV pool of 10 CN, 10 OPN, and 10 OP patients. Boxplots with individual data points and exact p‐values are shown.
Fig. 7
Fig. 7
Effect of extracellular vesicles (EVs) on healthy donor (HD) osteoblasts. (A) PKH26 EVs from control (CN), osteopenic (OPN), and osteoporotic (OP) subjects are able to fuse with HD osteoblasts. Original magnification: ×20. (B, C) Mesenchymal stem cells (MSCs) from three HDs were differentiated with osteogenic medium and 10 CN, 10 OPN, and 10 OP EV pools. (B) Alkaline phosphatase staining (original magnification ×10) and (C) densitometric analysis. (D, E) Real‐time RT‐PCR expression analysis of RNA extracted from three HD osteoblasts treated for 48 hours with pool of EVs from 10 CN, 10 OPN, and 10 OP patients. Gene expression analysis of (D) SP7 and (E) RANKL. Boxplots with individual data points and p‐values are shown.
Fig. 8
Fig. 8
MiR‐1246 upregulation in bone cells. (A–C) Three healthy donor (HD) peripheral blood mononuclear cells were treated for 10 days with M‐CSF/RANKL to obtain osteoclast precursors and then with (i) medium with 10% FBS + 20 ng/mL M‐CSF + 30 ng/mL RANKL +500 nM negative control of miRNA mimic, (ii) medium with 10% FBS + 20 ng/mL M‐CSF + 30 ng/mL RANKL +500 nM miR‐1246 mimic for 4 days. (A) Real‐time RT‐PCR expression analysis of miR‐1246. (B) Representative pictures of TRAcP staining. Original magnification ×20. (C) Number of TRAcP positive multinucleated (>3 nuclei) cells. (D) Real‐time RT‐PCR expression analysis of miR‐1246 during osteoblast differentiation. RNA was isolated from four HD mesenchymal stem cell (MSC) and osteoblast (OBS) cultures; OBSs were obtained after 21 weeks of MSC differentiation with osteogenic medium. (E–G) Real‐time RT‐PCR expression analysis of four HD OBS treated for 48 hours with (i) medium with 10% FBS + lipofectamine +200 nM negative control of miRNA mimic and (ii) medium with 10% FBS + lipofectamine +200 nM miR‐1246 mimic. Expression analysis of (E) miR‐1246, (F) SP7, and (G) RUNX2.

References

    1. Cocucci E, Racchetti G, Meldolesi J. Shedding microvesicles: artefacts no more. Trends Cell Biol. 2009;19(2):43‐51. - PubMed
    1. Raposo G, Stoorvogel W. Extracellular vesicles: exosomes, microvesicles, and friends. J Cell Biol. 2013;200(4):373‐383. - PMC - PubMed
    1. Mathivanan S, Ji H, Simpson RJ. Exosomes: extracellular organelles important in intercellular communication. J Proteomics. 2010;73(10):1907‐1920. - PubMed
    1. van der Pol E, Boing AN, Harrison P, Sturk A, Nieuwland R. Classification, functions, and clinical relevance of extracellular vesicles. Pharmacol Rev. 2012;64(3):676‐705. - PubMed
    1. Rossi M, Battafarano G, D'Agostini M, Del Fattore A. The role of extracellular vesicles in bone metastasis. Int J Mol Sci. 2018;19(4):1‐13. - PMC - PubMed

Publication types

LinkOut - more resources