

An exploration of Canadian government officials' COVID-19 messages and the public's reaction using social media data
- PMID: 36054094
- PMCID: PMC9439209
- DOI: 10.1371/journal.pone.0273153
An exploration of Canadian government officials' COVID-19 messages and the public's reaction using social media data
Abstract
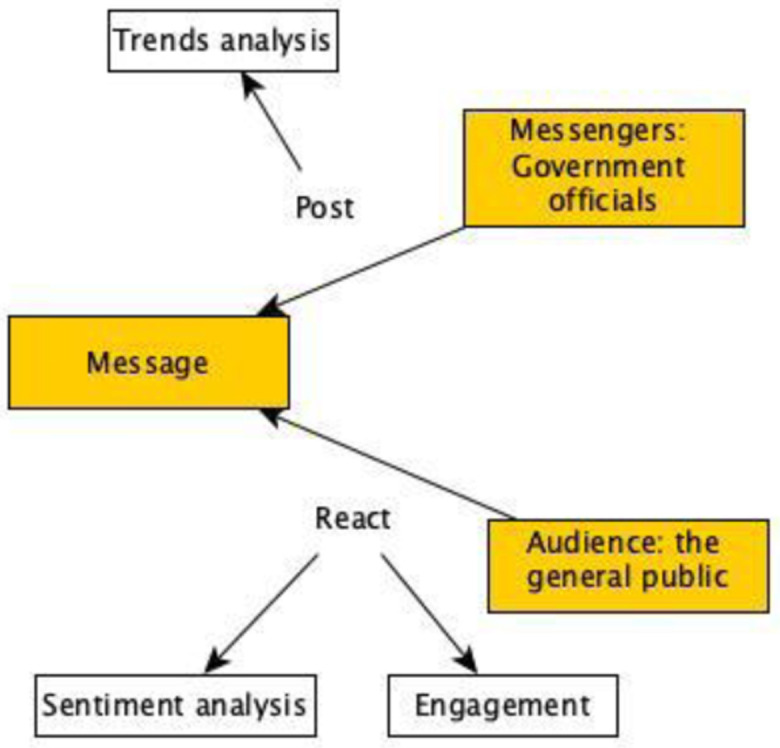
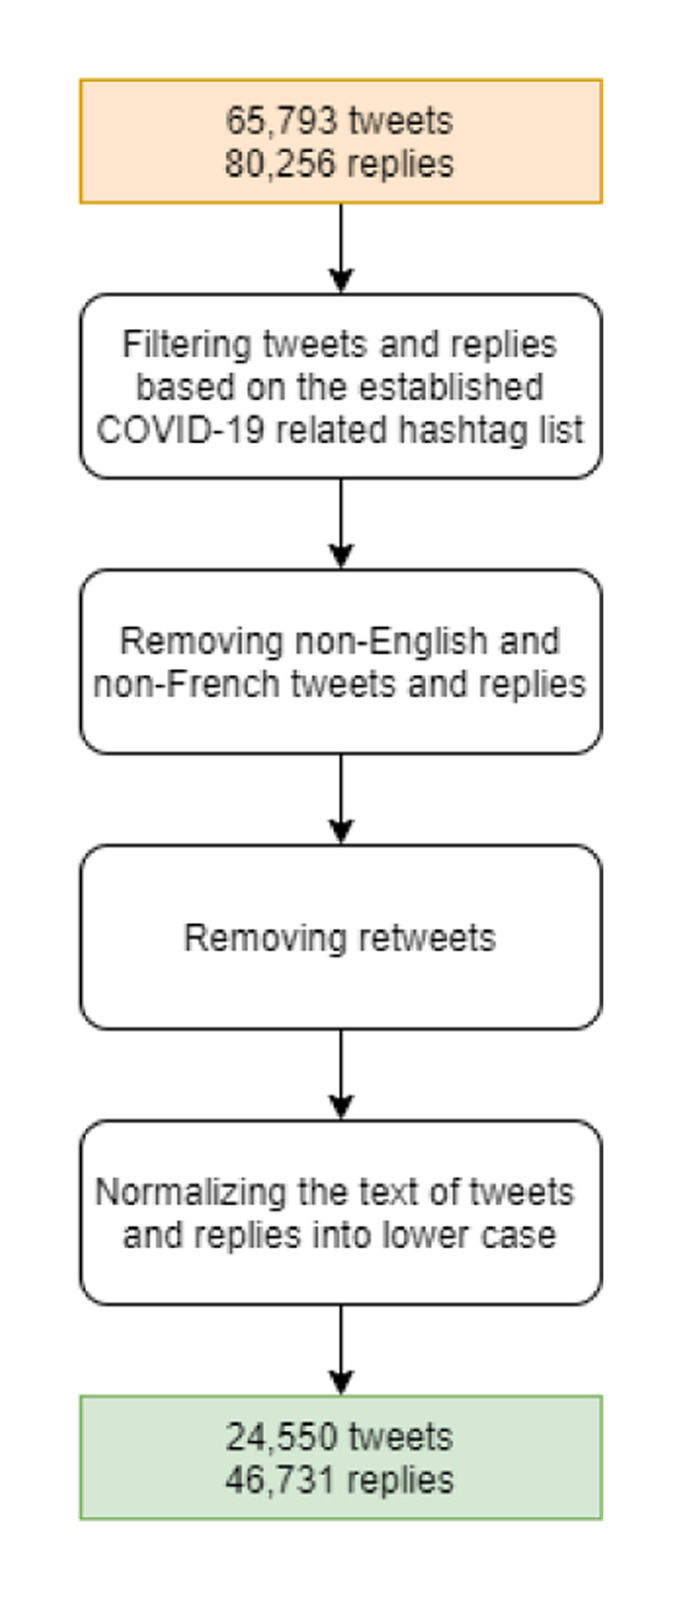
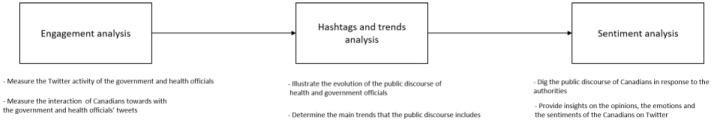
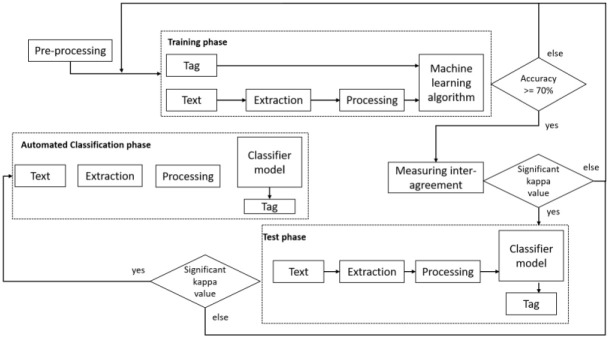
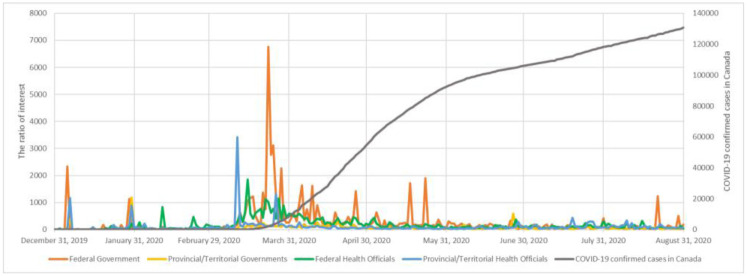
Governments can use social media platforms such as Twitter to disseminate health information to the public, as evidenced during the COVID-19 pandemic [Pershad (2018)]. The purpose of this study is to gain a better understanding of Canadian government and public health officials' use of Twitter as a dissemination platform during the pandemic and to explore the public's engagement with and sentiment towards these messages. We examined the account data of 93 Canadian public health and government officials during the first wave of the pandemic in Canada (December 31, 2019 August 31, 2020). Our objectives were to: 1) determine the engagement rates of the public with Canadian federal and provincial/territorial governments and public health officials' Twitter posts; 2) conduct a hashtag trend analysis to explore the Canadian public's discourse related to the pandemic during this period; 3) provide insights on the public's reaction to Canadian authorities' tweets through sentiment analysis. To address these objectives, we extracted Twitter posts, replies, and associated metadata available during the study period in both English and French. Our results show that the public demonstrated increased engagement with federal officials' Twitter accounts as compared to provincial/territorial accounts. For the hashtag trends analysis of the public discourse during the first wave of the pandemic, we observed a topic shift in the Canadian public discourse over time between the period prior to the first wave and the first wave of the pandemic. Additionally, we identified 11 sentiments expressed by the public when reacting to Canadian authorities' tweets. This study illustrates the potential to leverage social media to understand public discourse during a pandemic. We suggest that routine analyses of such data by governments can provide governments and public health officials with real-time data on public sentiments during a public health emergency. These data can be used to better disseminate key messages to the public.
Conflict of interest statement
To the best of our knowledge, the authors have no competing interests.
Figures
Similar articles
-
Public Officials' Engagement on Social Media During the Rollout of the COVID-19 Vaccine: Content Analysis of Tweets.JMIR Infodemiology. 2023 Jul 20;3:e41582. doi: 10.2196/41582. JMIR Infodemiology. 2023. PMID: 37315194 Free PMC article.
-
The Saudi Ministry of Health's Twitter Communication Strategies and Public Engagement During the COVID-19 Pandemic: Content Analysis Study.JMIR Public Health Surveill. 2021 Jul 12;7(7):e27942. doi: 10.2196/27942. JMIR Public Health Surveill. 2021. PMID: 34117860 Free PMC article.
-
Public engagement in government officials' posts on social media during coronavirus lockdown.PLoS One. 2023 Jan 23;18(1):e0280889. doi: 10.1371/journal.pone.0280889. eCollection 2023. PLoS One. 2023. PMID: 36689430 Free PMC article.
-
Governments' accountability for Canada's pandemic response.J Public Health Policy. 2022 Jun;43(2):222-233. doi: 10.1057/s41271-022-00350-0. Epub 2022 Apr 12. J Public Health Policy. 2022. PMID: 35414692 Free PMC article. Review.
-
Health authorities' health risk communication with the public during pandemics: a rapid scoping review.BMC Public Health. 2021 Jul 15;21(1):1401. doi: 10.1186/s12889-021-11468-3. BMC Public Health. 2021. PMID: 34266403 Free PMC article.
Cited by
-
Exploring perceptions and experiences of stigma in Canada during the COVID-19 pandemic: a qualitative study.BMC Glob Public Health. 2023;1(1):26. doi: 10.1186/s44263-023-00020-7. Epub 2023 Dec 2. BMC Glob Public Health. 2023. PMID: 38798820 Free PMC article.
References
-
- World Health Organization (WHO). (2019). Novel Coronavirus (2019-nCoV) SITUATION REPORT—1. World Heal Organ. https://www.who.int/docs/default-source/coronaviruse/situation-reports/2....
-
- World Health Organization (WHO). (2020). Coronavirus disease 2019 (COVID-19) Situation Report– 51. World Health Organization. https://www.who.int/docs/default-source/coronaviruse/situation-reports/2....
-
- Johns Hopkins University. (2021). COVID-19 Dashboard by the Center for Systems Science and Engineering (CSSE) at Johns Hopkins University (JHU). https://coronavirus.jhu.edu/map.html. Published 2020. Accessed January 10, 2021.
-
- World Health Organization (WHO). (2003). Summary of probable SARS cases with onset of illness from 1 November 2002 to 31 July 2003. http://www.who.int/csr/sars/country/table2004_04_21/en/index.html.
Publication types
MeSH terms
LinkOut - more resources
Full Text Sources
Medical
