. 2022 Sep 2;17(9):e0271236.
doi: 10.1371/journal.pone.0271236. eCollection 2022.

Measuring turfgrass canopy interception and throughfall using co-located pluviometers

Affiliations

Measuring turfgrass canopy interception and throughfall using co-located pluviometers

Don Wesley Dyer et al. PLoS One. .

Abstract

Turfgrass management relies on frequent watering events from natural precipitation or irrigation. However, most irrigation scheduling strategies in turfgrass ignore the magnitude of canopy interception. Interception is the process by which precipitation or irrigation water is intercepted by and evaporated from plant canopies or plant residue. The objective of this study was to quantify the magnitude of precipitation interception and throughfall in 'Meyer' zoysiagrass (Zoysia japonica L.) and '007' creeping bentgrass (Agrostis stolonifera L.). We used a new method consisting of co-located pluviometers with and without circular turfgrass patches to measure interception and throughfall. The resulting dataset includes 15 storms and 25 individual rainfall events ranging in precipitation totals from 0.3 mm to 42.4 mm throughout the research study. Throughfall amount resulted in a strong (r = 0.98) positive linear relationship with precipitation totals. On average, zoysiagrass and creeping bentgrass canopies intercepted a minimum of 4.4 mm before throughfall occurred. This indicates that, on average, no precipitation reaches the soil surface for precipitation events <4.4 mm. After the point of throughfall, 16% of each additional millimeter of precipitation or irrigation is lost due to interception. Nearly, 45% of the area of the contiguous U.S. could result in >50% of the annual precipitation being intercepted by canopies of zoysiagrass and bentgrass. This study provides detailed insights to understanding the interception dynamics in turfgrass and highlights the inefficient nature of small precipitation and irrigation events in turfgrass systems.


Conflict of interest statement

The authors have declared that no competing interests exist.

Figures

Fig 1
Fig 1
Figure illustrating A) the process of delineating and cutting the turfgrass patch using the pluviometer collector as template to ensure close fit, B) the top and bottom of a turfgrass patch after removing the soil attached to the bottom of the thatch layer and ready to be inserted into the pluviometer collector, C) a top view example of the pluviometers with and without the turfgrass patches of zoysiagrass and creeping bentgrass before the occurrence of a precipitation event, and D) the replicated field set up with showing three sets of three co-located pluviometers, a sensor for measuring air temperature and relative humidity, soil moisture sensors deployed in bare soil and below the surrounding zoysiagrass canopy, and associated logging hardware.
Fig 2
Fig 2. Relationship between precipitation and throughfall amount of patches of zoysiagrass and creeping bentgrass for all 15 natural storms.
The x-intercept of 4.4 mm (95% CI [3.6, 5.3]) represents the minimum canopy interception before throughfall begins. The linear fitting exercise was done only using storm events that had throughfall >0 mm. Error bars represent the standard deviation of throughfall and precipitation. For some markers error bars are masked by the marker size.
Fig 3
Fig 3
Comparison of cumulative precipitation, cumulative throughfall, and canopy interception for patches of zoysiagrass and creeping bentgrass during a storm with a single rainfall event (A and B, storm 14 in Table 1) and a storm with three rainfall events of variable lengths (C and D, storm 10 in Table 1). Both storms resulted in similar precipitation amount but had a different number of intra-storm precipitation events. The point of throughfall denoted by arrows.
Fig 4
Fig 4
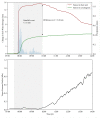
A) Changes in 1-minute soil water storage in the 0–12 cm soil layer measured with a vertically inserted soil water reflectometer in bare soil and in a Zoysiagrass canopy during a 13.3 mm rainfall event with a duration 2.5 hours on 22 May 2020 (Storm 14a); B) Vapor pressure deficit during and after the rainfall event. The post-storm decrease in soil water storage in Figure A is a result of soil moisture redistribution to deeper soil layer and evaporation driven by the increasing evaporative demand.
Fig 5
Fig 5
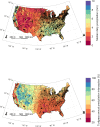
Maps showing the A) median daily precipitation totals for the contiguous United States in the period 2017–2020 from a multi-sensor gridded precipitation product at 4-km spatial resolution; and B) the estimated average percentage of annual precipitation intercepted by zoysiagrass and creeping bentgrass for the period 2017–2020 calculated using Eqs 2 and 3. Interception amount for daily precipitation events exceeding 45 mm was kept constant at a value of 11.4 mm [i.e., Itf+0.16(45−Itf), where Itf = 4.4 mm] since our study did not include larger events. Only days with precipitation >0 mm were used to compute the maps. Black markers represent the locations of golf courses throughout the U.S. Black markers represent the locations of golf courses throughout the U.S. Precipitation data was obtained from the U.S. National Weather Service (water.weather.gov/precip). The dataset of golf courses was obtained from the Golf Course Superintendents Association of America (GCSAA).

References

    1. Morris KE. National turfgrass research initiative. National Turfgrass Federation, Inc., and National Turfgrass Evaluation Program, Beltsville. 2003.
    1. Throssell CS, Lyman GT, Johnson ME, Stacey GA, Brown CD, Golf Course Environmental Profile Measures Water Use, source, cost, quality, management and conservation strategies. Applied Turfgrass Science. 2009;6(1):1–20.
    1. Beard JB, Turfgrass root basics. TURFAX. 2001;9(3), 4–5.
    1. Burgy RH, Pomeroy CR, Interception losses in grassy vegetation. Transactions, American Geophysical Union. 1958;39(6):1095.
    1. Ochsner TE, Rain or shine: An introduction to soil physical properties and processes. 2022; p. 94–99. Published by Oklahoma State University Libraries under the Creative Commons Attribution 4.0 International License. doi: 10.17605/OSF.IO/Z4RBT - DOI

Publication types