. 2022 Sep 2;18(9):e1010431.
doi: 10.1371/journal.pcbi.1010431. eCollection 2022 Sep.

High-order functional redundancy in ageing explained via alterations in the connectome in a whole-brain model

Affiliations

High-order functional redundancy in ageing explained via alterations in the connectome in a whole-brain model

Marilyn Gatica et al. PLoS Comput Biol. .

Abstract

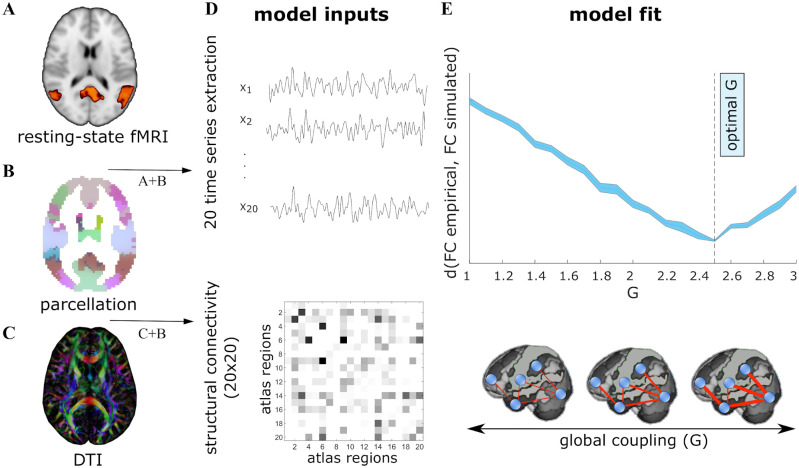
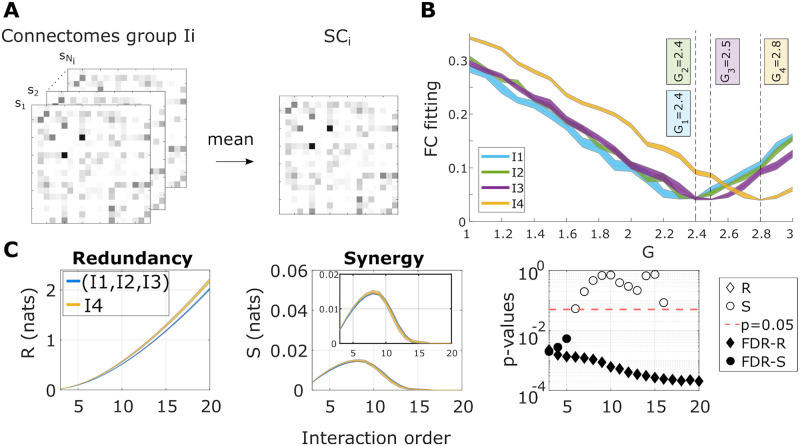
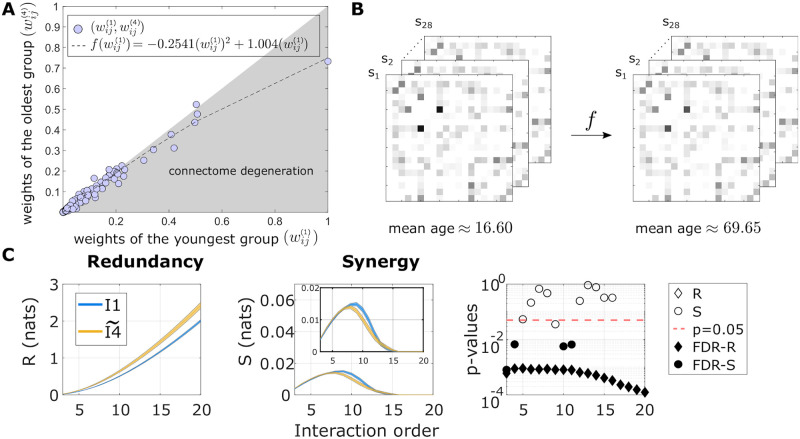
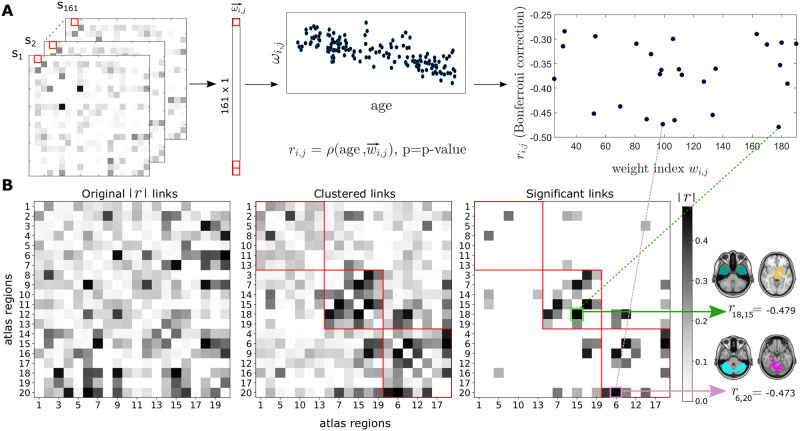
The human brain generates a rich repertoire of spatio-temporal activity patterns, which support a wide variety of motor and cognitive functions. These patterns of activity change with age in a multi-factorial manner. One of these factors is the variations in the brain's connectomics that occurs along the lifespan. However, the precise relationship between high-order functional interactions and connnectomics, as well as their variations with age are largely unknown, in part due to the absence of mechanistic models that can efficiently map brain connnectomics to functional connectivity in aging. To investigate this issue, we have built a neurobiologically-realistic whole-brain computational model using both anatomical and functional MRI data from 161 participants ranging from 10 to 80 years old. We show that the differences in high-order functional interactions between age groups can be largely explained by variations in the connectome. Based on this finding, we propose a simple neurodegeneration model that is representative of normal physiological aging. As such, when applied to connectomes of young participant it reproduces the age-variations that occur in the high-order structure of the functional data. Overall, these results begin to disentangle the mechanisms by which structural changes in the connectome lead to functional differences in the ageing brain. Our model can also serve as a starting point for modeling more complex forms of pathological ageing or cognitive deficits.


Conflict of interest statement

The authors have declared that no competing interests exist.

Figures

Fig 1
Fig 1. Whole-brain dynamic mean field model.
The DMF model has several inputs. A: BOLD signals from fMRI data, B: a parcellation, in our case comprising 20 atlas regions, and C: the individual connectome obtained from DTI. D: Applying the parcellation to the fMRI and DTI datasets, we obtained 20 time-series signals and a 20 × 20 matrix representing the connectome. E: BOLD-like signals are simulated using the connectome and different values of the coupling parameter G. For each G, we compare the simulated and empirical data using the Kolmogorov-Smirnov distance (d) over the distribution of values of the FC matrices. Finally, the selected optimal G is the value that minimizes this distance.
Fig 2
Fig 2. The DMF model reproduces the statistically significant differences in the high-order interactions of redundancy.
A: First, the within age-group average SC matrix was calculated. B: Next, the optimal G value for each group was obtained. C: We simulated brain activity within each group using the average SC and the corresponding optimal Gi, computed the O-information as a function of the interaction order, and separated sets of elements into the dominantly redundant (positive O-information values) and synergistic (negative O-information values). Here, the total redundancy (R) and synergy (S) was obtained as the average O-information over the redundant and synergistic sets, respectively. The p-values of the Wilcoxon rank-sum test are also depicted as a function of the interaction order, after comparing the values in I4 versus the ones obtained from the combination of (I1, I2, and I3). When the value of redundancy (or synergy) survived the false discovery rate (FDR) correction, the diamonds (or circles) were filled.
Fig 3
Fig 3. Connectome-based ageing model.
A: A polynomial fit of second degree was used to link the weights of the average connectome within I1, denoted by wij(1), and the corresponding ones in I4 (wij(4)). B: (left) Twenty-eight empirical young connectomes are transformed by the second-order polynomial fit, obtaining the synthetic aged connectomes (right). C: We simulated the DMF model of the aged connectomes and the optimal value G4. The O-information was assessed and separated into the total redundancy (left) and synergy (center). The third panel at the right corresponds to the p-values of the Wilcoxon rank-sum test after comparing the redundancy and synergy of the synthetic I4 group with the ones in I1. When the value of redundancy or synergy survived multiple-comparison correction, both the diamonds and circles were filled.
Fig 4
Fig 4. Heterogeneity of the connectome degeneration.
A: The non-parametric Spearman’s rank-correlation r between age and individual weights wij of the SC matrix was calculated across all different participants (N = 161). The final number of weights that survived to multiple comparisons is represented in the right panel, with values ranging from -0.25 to -0.50. B: We built a new connectivity matrix using as links the absolute values of r obtained for each weight (left panel). Next, the Leuven community detection method was applied before correcting for multiple comparison and three main communities (center) were found. The links that belong to each community and that survived Bonferroni correction are also shown (right). As an illustration, we show one arbitrary link within each of these communities (colored in green and pink). Here, |r| denotes the absolute values of all elements of matrix r.

References

    1. Economic UND, Social Affairs PD. World Population Ageing 2020 Highlights: Living arrangements of older persons. United Nations, ST/ESA/SERA/451. 2020;.
    1. Raz N, Lindenberger U, Rodrigue KM, Kennedy KM, Head D, Williamson A, et al. Regional brain changes in aging healthy adults: General trends, individual differences and modifiers. Cerebral Cortex. 2005;. doi: 10.1093/cercor/bhi044 - DOI - PubMed
    1. Ferreira LK, Regina ACB, Kovacevic N, Martin MDGM, Santos PP, Carneiro CDG, et al. Aging effects on whole-brain functional connectivity in adults free of cognitive and psychiatric disorders. Cerebral Cortex. 2016;. doi: 10.1093/cercor/bhv190 - DOI - PubMed
    1. Varangis E, Habeck CG, Razlighi QR, Stern Y. The Effect of Aging on Resting State Connectivity of Predefined Networks in the Brain. Frontiers in Aging Neuroscience. 2019;. doi: 10.3389/fnagi.2019.00234 - DOI - PMC - PubMed
    1. Puxeddu MG, Faskowitz J, Betzel RF, Petti M, Astolfi L, Sporns O. The modular organization of brain cortical connectivity across the human lifespan. NeuroImage. 2020;. doi: 10.1016/j.neuroimage.2020.116974 - DOI - PubMed

Publication types