. 2022 Sep 2;7(75):eabk2541.
doi: 10.1126/sciimmunol.abk2541. Epub 2022 Sep 2.

Rhythmicity of intestinal IgA responses confers oscillatory commensal microbiota mutualism

Affiliations

Rhythmicity of intestinal IgA responses confers oscillatory commensal microbiota mutualism

Hugo A Penny et al. Sci Immunol. .

Abstract

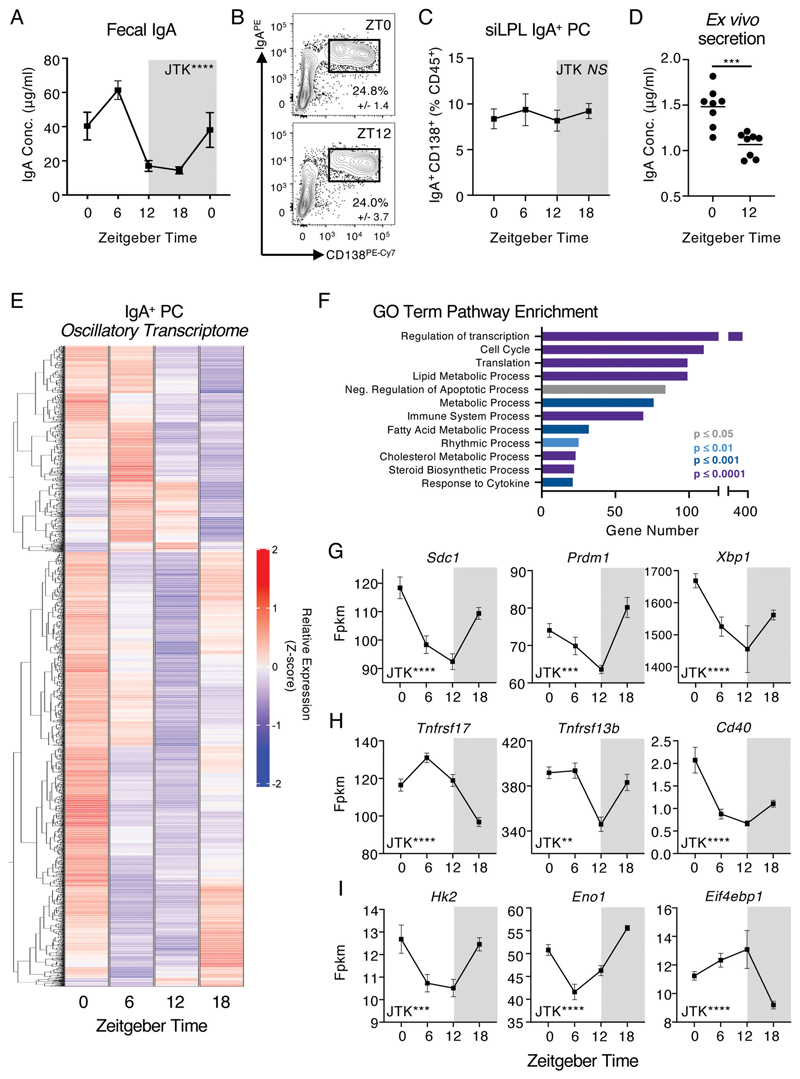
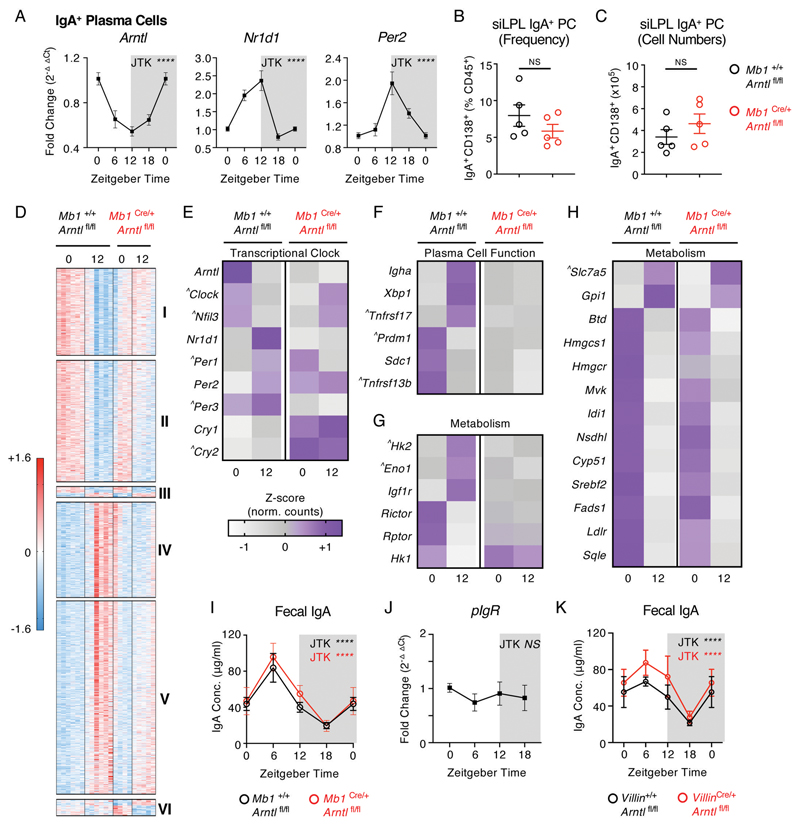
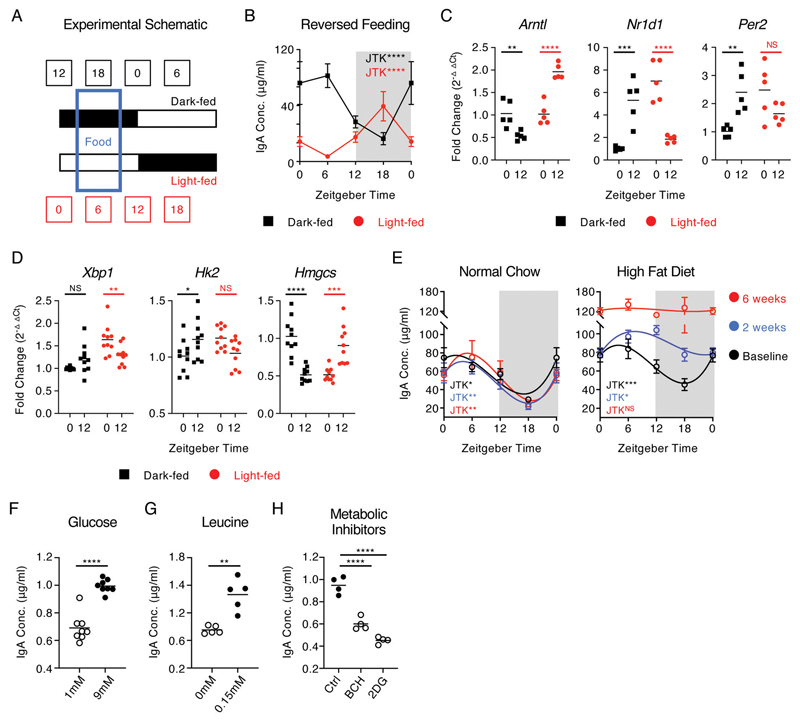
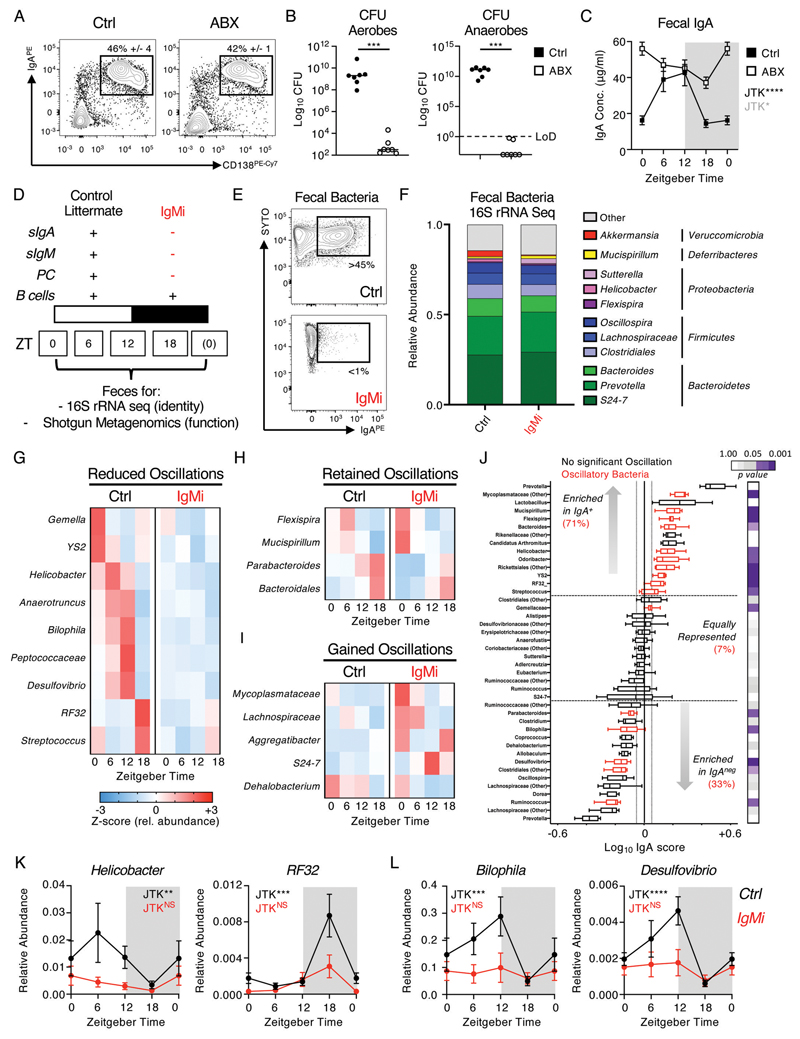
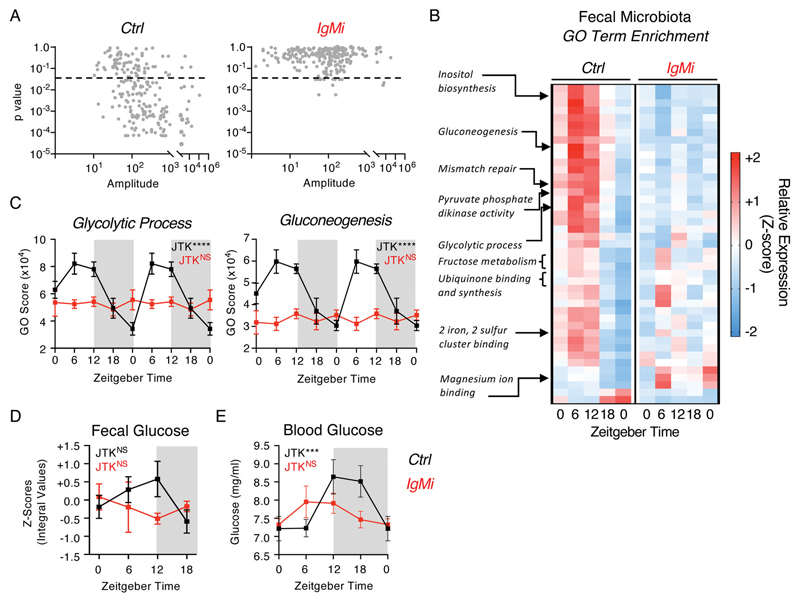
Interactions between the mammalian host and commensal microbiota are enforced through a range of immune responses that confer metabolic benefits and promote tissue health and homeostasis. Immunoglobulin A (IgA) responses directly determine the composition of commensal species that colonize the intestinal tract but require substantial metabolic resources to fuel antibody production by tissue-resident plasma cells. Here, we demonstrate that IgA responses are subject to diurnal regulation over the course of a circadian day. Specifically, the magnitude of IgA secretion, as well as the transcriptome of intestinal IgA+ plasma cells, was found to exhibit rhythmicity. Oscillatory IgA responses were found to be entrained by time of feeding and were also found to be in part coordinated by the plasma cell-intrinsic circadian clock via deletion of the master clock gene Arntl. Moreover, reciprocal interactions between the host and microbiota dictated oscillatory dynamics among the commensal microbial community and its associated transcriptional and metabolic activity in an IgA-dependent manner. Together, our findings suggest that circadian networks comprising intestinal IgA, diet, and the microbiota converge to align circadian biology in the intestinal tract and to ensure host-microbial mutualism.


Conflict of interest statement

Competing Interests: The Authors declare that they have no competing interests.

Figures

Figure 1
Figure 1. Mucosal antibody secretion and small intestinal IgA+ Plasma Cell activity exhibit diurnal rhythmicity.
A) Serial fecal sampling of C57BL/6 mice at five 6 hour intervals over a circadian day (ZT 0, 6, 12, 18, 0), n=10 (pooled from two independent data sets). Data representative of at least 4 independent experiments. B) Exemplar flow plots of small intestinal CD138+ IgA+ PC, pregated as Live CD45+CD3-CD5-NK1.1-MHCII+/-B220-IgD-, at ZT0 and ZT12 and C) Quantification of IgA+ plasma cell frequencies at ZT0, 6, 12 and 18. B+C n=5 and representative of three independent experiments. D) Ex vivo secretion of IgA by sort-purified IgA+ PC (from ZT0 and ZT12) cultured for 18 hours. Data pooled from two independent experiments, n=8. E) Heatmap of significantly oscillatory genes (JTK Cycle, p<0.01) identified from bulk RNA Sequencing of sort-purified small intestinal IgA+ PC taken at ZT0, 6, 12 and 18, z-score of average relative gene expression (fpkm) values of n=5 per timepoint. F) GO-Term pathway enrichment analysis on oscillatory gene signatures. Selected relative expression (fpkm) values for oscillatory gene signatures related to G) Plasma Cell function, survival and identitity, H) Extrinsic survival and antibody secretion signals, and I) Cellular Metabolism, values representative of n=5 per timepoint. P values were determined using JTK Cycle, with the exception of panel D which was determined via a parametric, unpaired t-test. All data shown as +/- SEM, * p< 0.05, ** p< 0.01, *** p< 0.001, **** p< 0.0001.
Figure 2
Figure 2. Rhythmic IgA+ Plasma Cell activity is in part dictated by the cell-intrinsic circadian clock.
A) Relative expression of circadian clock genes in sort-purified small intestinal IgA+ PC at ZT 0, 6, 12 and 18 (ZT0 double plotted), determined by RT-PCR. n=10 (pooled from two independent experimental cohorts). Data representative of at least 3 independent experiments. B) Frequency and C) numbers of small intestinal IgA+ PC in Mb1Cre/+ x Arntlfl/fl mice in comparison to Mb1+/+ x Arntlfl/fl littermate control animals, n=5 representative of two independent experiments. D) Heatmap comparison of significantly differentially expressed genes (Benjami-Hochberg adjusted p<0.05) identified by bulk RNA sequencing of sort-purified small intestinal IgA+ PC at ZT0 and 12, and found to significantly differ between ZT0 and ZT12 in control animals. Z-scores of relative gene expression (fpkm) values in individual animals of n=6 Mb1+/+ x Arntlfl/fl mice and n=4-5 Mb1Cre/+ x Arntlfl/fl mice per timepoint. Gene clusters: I+II (decrease in gene expression between ZT0 + ZT12 in controls, loss of suppression in Mb1Cre/+ x Arntlfl/fl mice), III (time of day difference retained in both genotypes), IV+V (increase in gene expression between ZT0 + ZT12 in controls, loss of suppression in Mb1Cre/+ x Arntlfl/fl mice) and VI (enhanced time of day difference in Mb1Cre/+ x Arntlfl/fl mice). E-H) Average z-score values (representative of n=6 Mb1+/+ x Arntlfl/fl mice and n=4-5 Mb1Cre/+ x Arntlfl/fl mice) in IgA+ PC at ZT0 and ZT12, in respect to E) Circadian clock genes, F) Plasma Cell-associated genes, G+H) Metabolism-associated genes. ^ identifies genes where time of day differences either did not reach statistical significance in control animals in this analysis but were either previously identified in Figure 1 as oscillatory, or are directly related and relevant to the biological pathway described. I) Serial fecal sampling of Mb1Cre/+ x Arntlfl/fl mice and Mb1+/+ x Arntlfl/fl mice at four time points over a circadian day (ZT 0, 6, 12, 18; ZT0 double plotted), n=8-9 and pooled from two independent experimental cohorts. J) RT-PCR expression of pIgR relative to housekeeping gene in whole small intestinal tissue samples (n=5 mice, represenative of two indepednent experiments). K) Serial fecal sampling of VillinCre/+ x Arntlfl/fl mice and Villin+/+ x Arntlfl/fl mice at four time points over a circadian day (ZT 0, 6, 12, 18; ZT0 double plotted), n=5 and representative of two independent experiments. P values for panels A and I-K were determined using JTK Cycle, D-H with Benjami-Hochberg test (DESeq2, see also methods) and panels B+C which with a parametric, unpaired t-test. All data shown as +/- SEM unless otherwise indicated, * p< 0.05, ** p< 0.01, *** p< 0.001, **** p< 0.0001.
Figure 3
Figure 3. Oscillations in secretory IgA are aligned by feeding cues and cellular metabolic activity.
A) Schematic of reversed feeding regimen, B) Serial fecal sampling of light-fed or dark-fed C57BL/6 mice at four 6 hour intervals over a circadian day (ZT 0, 6, 12, 18; ZT0 double plotted), n=9-10 (pooled from two independent experimental cohorts). Data representative of at least 4 independent experiments. RT-PCR analysis of C) circadian clock genes (n=5 mice per group and representative of two independent experiments) and D) plasma cell associated and metabolic genes (n=10 mice per group, pooled from two independent experiments) at ZT0 and ZT12 in sort-purified small intestinal IgA+ PC isolated from light-fed or dark-fed mice, n=5 per group, data representative of two independent experiments. E) Serial fecal sampling of C57BL/6 mice fed normal chow or high fat diet (HFD at five 6 hour intervals over a circadian day (ZT 0, 6, 12, 18; ZT0 double plotted), taken at baseline, two weeks or six weeks on the indicated diet, n=4-5 and data representative of at least 2 independent experiments. F-H) Ex vivo secretion of IgA by sort-purified small intestinal IgA+ PC cultured with differing concentrations of F) glucose (n= 8, representative of pooled data from two independent experiments) G) leucine (n= 5, representative of data from two independent experiments) or H) in the presence of metabolic inhibitors (n= 4, representative of data from three independent experiments). P values for panels B+E were determined using JTK Cycle. P values for panels C and D were determined using a two-way ANOVA, H with a parametric, unpaired One-Way ANOVA, and F and G with parametric, unpaired t-test. All data shown as +/- SEM unless otherwise indicated, * p< 0.05, ** p< 0.01, *** p< 0.001, **** p< 0.0001.
Figure 4
Figure 4. Bidirectional interactons between the microbiota and host IgA responses regulate circadian rhythmicity of commensal microbes.
A) Small intestinal IgA+ PC frequencies in mice receiving a cocktail of antibiotics (ABX) ad lib for 4 days (representative of n=5 mice per group and two independent experiments), B) colony forming units (CFU) or commensal microbes measured under aerobic and anaerobic culture conditions (representative of n=7 mice per group, pooled from two independent experiments) and C) fecal IgA measured over four circadian time points (ZT0 double plotted) from control and ABX treated mice representative of n=5 mice per group and two independent experiments. D) Summary of features of the IgMi mouse model. E) Representative measurement of IgA-binding to fecal bacteria in IgMi mice or littermate wild type control mice (Ctrl). F) Global analysis of average microbiota composition in Ctrl and IgMi animals elucidated by 16S rRNA Sequencing of fecal pellet-derived bacteria. G-I) Z-score heatmaps indicating average relative abundance of significantly oscillatory microbial genera in Ctrl mice and IgMi mice from serially sampled fecal bacteria taken at ZT0, 6, 12 and 18 (JTK cycle p<0.05). J) IgA-Seq analysis of fecal bacteria isolated from Ctrl animals. Bacteria determined to exhibit oscillatory patterns in G-I are highlighted in red and the relative percent enrichment of oscillatory bacteria in IgA+ or negative fractions are indicated, legend indicates JTK cycle p values. IgA enrichment indicate as log10 score. K+L) Individual data sets for selected bacteria identified as oscillatory in Ctrl animals and perturbed in IgMi mice (ZT0 data double plotted). All 16S rRNA sequencing and IgA Seq data representative of two independent experiments with n=4-5 animals per genotype, per ZT time point. P values for panel B were determined using a non-parametric, unpaired Mann-Whitney t-test and panels C and G-L using JTK Cycle. All data shown as +/- SEM unless otherwise indicated, * p< 0.05, ** p< 0.01, *** p< 0.001, **** p< 0.0001.
Figure 5
Figure 5. Mucosal antibody regulation of microbiome circadian rhythmicity modulates nutrient and metabolite availability and uptake.
A) JTK analysis of GO Term pathway scores identified by shotgun metagenomics of serially sampled feces of Ctrl and IgMi mice over five 6 hour intervals over a circadian day (ZT 0, 6, 12, 18, 0), n=5 per group per timepoint, and representative of a single experiment. Significance cutoff = p<0.05. B) Z-score heatmap of average GO Term scores identified to be significantly oscillatory in Ctrl mice and perturbed in IgMi mice by JTK cycle analysis (p<0.05), and C) select exemplar pathways double plotted. D) Glucose levels in serially sampled feces of Ctrl and IgMi mice over five 6 hour intervals over a circadian day (ZT 0, 6, 12, 18, 0), n=5 per group per timepoint, and representative of a single experiment. E) Glucose levels in serially sampled blood of Ctrl and IgMi mice over five 6 hour intervals over a circadian day (ZT 0, 6, 12, 18; ZT0 double plotted), n=8-12 per group per timepoint, representative of data pooled from three independent experiments. P values determined via JTK Cycle. All data shown as +/- SEM unless otherwise indicated, * p< 0.05, ** p< 0.01, *** p< 0.001, **** p< 0.0001.

Comment in

  • Feeding IgA+ plasma cells.
    Minton K. Minton K. Nat Rev Immunol. 2022 Nov;22(11):654-655. doi: 10.1038/s41577-022-00788-z. Nat Rev Immunol. 2022. PMID: 36127478 No abstract available.

References

    1. Alexander M, Turnbaugh PJ. Deconstructing Mechanisms of Diet-Microbiome-Immune Interactions. Immunity. 2020;53:264–276. - PMC - PubMed
    1. Belkaid Y, Hand TW. Role of the microbiota in immunity and inflammation. Cell. 2014;157:121–141. - PMC - PubMed
    1. Honda K, Littman DR. The microbiota in adaptive immune homeostasis and disease. Nature. 2016;535:75–84. - PubMed
    1. Hooper LV, Littman DR, Macpherson AJ. Interactions between the microbiota and the immune system. Science. 2012;336:1268–1273. - PMC - PubMed
    1. Kolodziejczyk AA, Zheng D, Elinav E. Diet-microbiota interactions and personalized nutrition. Nat Rev Microbiol. 2019;17:742–753. - PubMed

Publication types

Substances