. 2022 Dec;70(12):2361-2377.
doi: 10.1002/glia.24257. Epub 2022 Aug 17.

Human repair-related Schwann cells adopt functions of antigen-presenting cells in vitro

Affiliations

Human repair-related Schwann cells adopt functions of antigen-presenting cells in vitro

Jakob Berner et al. Glia. 2022 Dec.

Abstract

The plastic potential of Schwann cells (SCs) is increasingly recognized to play a role after nerve injury and in diseases of the peripheral nervous system. Reports on the interaction between immune cells and SCs indicate their involvement in inflammatory processes. However, the immunocompetence of human SCs has been primarily deduced from neuropathies, but whether after nerve injury SCs directly regulate an adaptive immune response is unknown. Here, we performed comprehensive analysis of immunomodulatory capacities of human repair-related SCs (hrSCs), which recapitulate SC response to nerve injury in vitro. We used our well-established culture model of primary hrSCs from human peripheral nerves and analyzed the transcriptome, secretome, and cell surface proteins for pathways and markers relevant in innate and adaptive immunity, performed phagocytosis assays, and monitored T-cell subset activation in allogeneic co-cultures. Our findings show that hrSCs are phagocytic, which is in line with high MHCII expression. Furthermore, hrSCs express co-regulatory proteins, such as CD40, CD80, B7H3, CD58, CD86, and HVEM, release a plethora of chemoattractants, matrix remodeling proteins and pro- as well as anti-inflammatory cytokines, and upregulate the T-cell inhibiting PD-L1 molecule upon pro-inflammatory stimulation with IFNγ. In contrast to monocytes, hrSC alone are not sufficient to trigger allogenic CD4+ and CD8+ T-cells, but limit number and activation status of exogenously activated T-cells. This study demonstrates that hrSCs possess features and functions typical for professional antigen-presenting cells in vitro, and suggest a new role of these cells as negative regulators of T-cell immunity during nerve regeneration.

Keywords: PD-L1; Schwann cell; antigen-presenting cell; immunocompetence; immunoregulatory; inflammation; nerve injury; neuropathies.


Conflict of interest statement

The authors declare no conflict of interest.

Figures
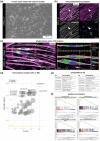
FIGURE 1
FIGURE 1
Phagocytosis potential and inflammatory response of hrSCs. (a) Phase contrast image of a representative passage 1 (p1) hrSC culture. (b) Immunostaining of p1 hrSCs for SC marker NGFR (magenta), intermediate filament vimentin (gray) and nuclear stain DAPI (blue); arrowheads indicate a NGFR negative and vimentin positive fibroblast. (c) 3D confocal image analysis of hrSCs exposed to 1 μm in diameter green fluorescent latex beads for 15 h. Cross sections show internalized beads within the SC cytoplasm. (d) Gene ontology (GO) analysis of differentially expressed genes by RNA‐seq between hrSCs (n = 5) and NB cultures (n = 5 independent biological replicates of 3 donors), −log10 of the enrichment p‐values (cut‐off <0.05) for filtered GO categories are plotted relative to Z‐scores of average ratios in each category. Circle size represents the fraction of regulated genes per GO term. (e) Top 12 GO terms among genes upregulated in hrSCs vs NB cultures. (f) Gene set enrichment analysis (GSEA) plots of hrSCs compared to NB cultures. Source data are provided in Supplementary Tables 2–4.
FIGURE 2
FIGURE 2
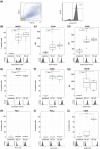
Flow cytometry phenotyping of MHCII and co‐signaling molecules present on human repair‐related Schwann cells. (a) Gating strategy for the identification of S100 positive hrSCs illustrated for one representative experiment. Intact cells are gated in the FSC vs SSC blot and S100 positive cells were selected for further analysis (b–j). Box plots show the expression status of MHCII and co‐signaling molecules CD40, CD80, B7H3, CD58, HVEM, PD‐L1, PD‐L2, and CD86 of S100 positive hrSCs in passage 1 (p1) and p2; technical replicates (same color); biological replicates (different colors). The histograms underneath depict one representative experiment (b, e, f, h, and j). Box plots represent the percentage of positive cells based on gates set in relation to unstained controls as displayed in the histograms (c, d, g, and i). Boxplots represent the mean fluorescence intensity (MFI). Boxes contain 50% of data and whiskers the upper and lower 25%; means are displayed as black horizontal lines. Each biological replicate is conducted with hrSCs isolated from a different donor nerve (b‐j). A two‐way ANOVA using a post‐hoc Holm p‐value correction was performed. *p ≤ 0.05; **p ≤ 0.01; and ***p ≤ 0.001
FIGURE 3
FIGURE 3
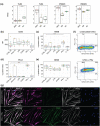
Immunophenotyping of human repair‐related Schwann cells upon toll‐like receptor and cytokine stimulation. (a) Enrichment of toll‐like receptor (TLR)‐related pathways. GSEA of RNA‐seq data sets of hrSCs compared to NB cultures. Box plots show the mRNA expression in reads per kilobase million (RPKM) of TLR3, IFNGR1, and IFNGR2 by RNA‐seq in NB cultures (NB, n = 5) and hrSCs (SC, n = 5). Bone marrow mononuclear cells (MNC, n = 5) are shown as reference (B‐E). FACS analysis of p1 cultures of hrSCs stimulated with POLY:IC, LPS, CD40L, IFNγ, and IL‐1β for 24 h. Box plots show the MFI of CD40 (B), percentage of HVEM (C), PD‐L1 (D), and MHCII (E) positive hrSCs in p1 cultures stimulated with POLY:IC, LPS, CD40L, IFNγ, and IL‐1β. Each biological replicate is conducted with hrSCs isolated from a different donor nerve. Boxes contain 50% of data and whiskers the upper and lower 25%. Means are displayed as black horizontal lines. All experiments were performed in at least four independent biological replicates. A two‐way ANOVA using a post‐hoc Holm p‐value correction was performed; *p ≤ 0.05; **p ≤ 0.01; and ***p ≤ 0.001. (f) Representative FACS plots showing PD‐L1 versus MHCII expression of p1 hrSCs either unstimulated (upper plot) and after IFNy stimulation. (g) Immunofluorescence image of p1 hrSCs at day 2 after purification without (upper panels) or with (lower panels) IFNy stimulation. HrSC cultures are stained for S100 (magenta), PD‐L1 (green), vimentin (gray), and DAPI (blue)
FIGURE 4
FIGURE 4
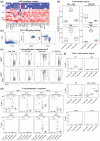
HrSCs secrete immunoactive mediators and inhibit allogenic T‐cell activation. (a) Secretome analysis by antibody array. Heatmap displays the top 32 differentially secreted proteins (q < 0.05, ∣log2FC >0.3∣) of hrSCs (n = 5) and SC‐NB co‐cultures (n = 5) versus NB cultures (as neuronal cell model) (n = 5). (b–f) allogeneic CD3+ T‐cells were cultured for 2, 4, or 10 days in the absence (Tcell) or presence of hrSCs (SC) and stimulated with anti‐CD3/CD28 beads and analyzed by flow cytometry. As control unstimulated T‐cells (Tcell unst.) were cultured. (b) Representative FACS plots show the gating strategy for CD4+ and CD8+ T‐cells. (c) Representative FACS plots showing CD25 expression against CFSE of T‐cells at day 2 of co‐cultivation and in control cultures. (d) Boxplots show the absolute number of CFSE+/CD25+ and CFSE CD4+ and CD8+ T‐cells at day 2 and day 4 based on gates set as illustrated in (b and c). (e) Boxplots show the absolute number of alive CD4+, CD8+ or combined CD4+and CD8+ cells, or the ratio of CD4+ over CD8+ and (F) percentage of CD4+ subsets evaluated via flow cytometry at day 10 based on gates set as published by Mahnke et al. (2013). (d–f) Boxes contain 50% of data and whiskers the upper and lower 25% means are displayed as black horizontal lines. All experiments were performed in at least three independent biological replicates. A two‐way ANOVA using a post‐hoc Holm p‐value correction was performed; *p ≤ 0.05; **p ≤ 0.01; and ***p ≤ 0.001

References

    1. Ambros, I. M. , Rumpler, S. , Luegmayr, A. , Hattinger, C. M. , Strehl, S. , Kovar, H. , Gadner, H. , & Ambros, P. F. (1997). Neuroblastoma cells can actively eliminate supernumerary MYCN gene copies by micronucleus formation–sign of tumour cell revertance? European Journal of Cancer (Oxford, England: 1990), 33(12), 2043–2049. 10.1016/s0959-8049(97)00204-9 - DOI - PubMed
    1. Ambros, I. M. , Zellner, A. , Roald, B. , Amann, G. , Ladenstein, R. , Printz, D. , … Ambros, P. F. (1996). Role of ploidy, chromosome 1p, and Schwann cells in the maturation of Neuroblastoma. New England Journal of Medicine, 334(23), 1505–1511. 10.1056/NEJM199606063342304 - DOI - PubMed
    1. Armati, P. J. , Pollard, J. D. , & Gatenby, P. (1990). Rat and human Schwann cells in vitro can synthesize and express MHC molecules. Muscle & Nerve, 13(2), 106–116. 10.1002/mus.880130204 - DOI - PubMed
    1. Arthur‐Farraj, P. J. , Morgan, C. C. , Adamowicz, M. , Gomez‐Sanchez, J. A. , Fazal, S. V. , Beucher, A. , Razzaghi, B. , Mirsky, R. , Jessen, K. R. , & Aitman, T. J. (2017). Changes in the coding and non‐coding transcriptome and DNA Methylome that define the Schwann cell repair phenotype after nerve injury. Cell Reports, 20(11), 2719–2734. 10.1016/j.celrep.2017.08.064 - DOI - PMC - PubMed
    1. Ashkar, S. , Weber, G. F. , Panoutsakopoulou, V. , Sanchirico, M. E. , Jansson, M. , Zawaideh, S. , … Cantor, H. (2000). Eta‐1 (Osteopontin): An early component of Type‐1 (cell‐mediated) immunity. Science, 287(5454), 860–864. 10.1126/science.287.5454.860 - DOI - PubMed

Publication types

MeSH terms