Rapid restructuring of the odontocete community in an ocean warming hotspot
- PMID: 36054792
- PMCID: PMC9804436
- DOI: 10.1111/gcb.16382
Rapid restructuring of the odontocete community in an ocean warming hotspot
Abstract
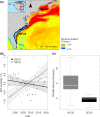
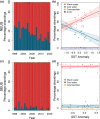
Cetaceans are important consumers in marine ecosystems, but few studies have quantified their climate responses. The rapid, directional warming occurring in the Northeast United States (NEUS) provides a unique opportunity to assess climate impacts on cetaceans. We used stranding data to examine changes to the distribution and relative abundance of odontocetes from 1996 to 2020 in both the NEUS and the Southeast United States (SEUS), which is not warming. We conducted simulations to determine the number of stranding events needed to detect a distributional shift for each species given the speed of the shift and the spatial variability in strandings. We compared observed shifts to climate velocity. Smaller sample sizes were needed to detect more rapid poleward shifts, particularly for species with low spatial variability. Poleward shifts were observed in all species with sufficient sample sizes, and shifts were faster than predicted by climate velocity. For species whose trailing edge of distribution occurred in the NEUS, the center of distribution approached the northern limit of the NEUS and relative abundance declined through time, suggesting shifts north out of US waters. The relative abundance of warm water species in the stranding record increased significantly in the NEUS while that of cool water species declined significantly as their distributions shifted north out of the NEUS. Changes in the odontocete community were less apparent in the SEUS, highlighting the importance of regional warming. Observed poleward shifts and changes in species composition suggest a reorganization of the odontocete community in the NEUS in response to rapid warming. We suggest that strandings provide a key dataset for understanding climate impacts on cetaceans given limitations of survey effort and modeling approaches for predicting distributions under rapidly changing conditions. Our findings portend marked changes to the distribution of highly mobile consumer species across international boundaries under continued warming.
Keywords: cetacean; climate response; distributional shift; rapid warming; regional change; trailing edge.
© 2022 The Authors. Global Change Biology published by John Wiley & Sons Ltd.
Conflict of interest statement
The authors declare no conflict of interest.
Figures


References
-
- Aguirre, A. A. , & Tabor, G. M. (2004). Introduction: Marine vertebrates as sentinels of marine ecosystem health. EcoHealth, 1, 236–238.
-
- Araújo, M. B. , Pearson, R. G. , Thuiller, W. , & Erhard, M. (2005). Validation of species–climate impact models under climate change. Global Change Biology, 11, 1504–1513.
-
- Bates, A. E. , Bird, T. J. , Stuart‐Smith, R. D. , Wernberg, T. , Sunday, J. M. , Barrett, N. S. , Edgar, G. J. , Frusher, S. , Hobday, A. J. , & Pecl, G. T. (2015). Distinguishing geographical range shifts from artefacts of detectability and sampling effort. Diversity and Distributions, 21, 13–22.
-
- Becker, E. , Foley, D. , Forney, K. , Barlow, J. , Redfern, J. , & Gentemann, C. (2012). Forecasting cetacean abundance patterns to enhance management decisions. Endangered Species Research, 16, 97–112.
MeSH terms
Substances
LinkOut - more resources
Full Text Sources
Medical

