. 2022 Dec 15;151(12):2265-2277.
doi: 10.1002/ijc.34270. Epub 2022 Sep 15.

The immunosuppression pathway of tumor-associated macrophages is controlled by heme oxygenase-1 in glioblastoma patients

Affiliations

The immunosuppression pathway of tumor-associated macrophages is controlled by heme oxygenase-1 in glioblastoma patients

Sara Magri et al. Int J Cancer. .

Abstract

The immunosuppressive tumor microenvironment (TME) in glioblastoma (GBM) is mainly driven by tumor-associated macrophages (TAMs). We explored whether their sustained iron metabolism and immunosuppressive activity were correlated, and whether blocking the central enzyme of the heme catabolism pathway, heme oxygenase-1 (HO-1), could reverse their tolerogenic activity. To this end, we investigated iron metabolism in bone marrow-derived macrophages (BMDMs) isolated from GBM specimens and in in vitro-derived macrophages (Mφ) from healthy donor (HD) blood monocytes. We found that HO-1 inhibition abrogated the immunosuppressive activity of both BMDMs and Mφ, and that immunosuppression requires both cell-to-cell contact and soluble factors, as HO-1 inhibition abolished IL-10 release, and significantly reduced STAT3 activation as well as PD-L1 expression. Interestingly, not only did HO-1 inhibition downregulate IDO1 and ARG-2 gene expression, but also reduced IDO1 enzymatic activity. Moreover, T cell activation status affected PD-L1 expression and IDO1 activity, which were upregulated in the presence of activated, but not resting, T cells. Our results highlight the crucial role of HO-1 in the immunosuppressive activity of macrophages in the GBM TME and demonstrate the feasibility of reprogramming them as an alternative therapeutic strategy for restoring immune surveillance.

Keywords: glioblastoma; heme oxygenase-1; iron metabolism; macrophages; tumor microenvironment.


Conflict of interest statement

The authors report that there are no competing interests to declare.

Figures

FIGURE 1
FIGURE 1
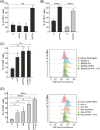
HO‐1 expression in BMDMs and MG in GBM tissue. (A) Representative flow cytometry analysis of HO‐1 and CD163 protein expression in BMDMs and MG. After dead cell exclusion and determination of CD45+ cells, BMDMs and MG cells were further identified in the CD33+ gate as HLA‐DR+/CD49d+ and HLA‐DR+/CD49d, respectively (upper part of the figure). In the bottom part, on the left, the red peak represents the HO‐1 mean fluorescence intensity (MFI) of BMDMs, while the light blue peak corresponds to the HO‐1 MFI of MG cells. HO‐1+ cells were defined using fluorescence minus one (FMO) control (gray peak). On the right part of the figure, HO‐1/CD163 co‐expression is shown in BMDMs and MG cells. (B) HMOX1 gene expression level analyzed by means of qRT‐PCR in BMDMs (red bar) and MG (blue bar), sorted from GBM specimens by a FACS sorter and expressed as a fold change (FC). HMOX1 expression was normalized to the β‐actin gene. Mean ± SE of four GBM patients. Comparison by Mann‐Whitney test. *<.05. (C) Correlation between PPIX fluorescence emission and HMOX1 FC in BMDMs (red dots) and MG (blue dots). Pearson correlation on four paired samples. (D) Representative composite images showing two fields of the same GBM tissue labeled with CD68 (red, macrophages), HO‐1 (green), CD8 (pink, T cells) and GFAP (light blue, tumor cells); nuclei were counterstained with DAPI (blue). Magnification ×20. (E) Analysis of the immune infiltrate by multispectral imaging. The bar plots show the mean ± SE of cell density per megapixel of CD68+ and CD68+/HO‐1+ cells together, CD68+, HO‐1+, CD68+/HO‐1+ and CD8+ cells calculated by considering 10 different fields from the FFPE tissue slides of nine GBM patients. Comparison by Mann‐Whitney test. *<.05; **<.01; ***<.001
FIGURE 2
FIGURE 2
HO‐1 inhibition in myeloid cells relieves immune suppression exerted on T cells. T cells were cultured with BMDMs (black bars) isolated from GBM specimens or with Mφ (gray bars) for 96 hours; data were normalized assuming the proliferation of T cells alone to be 100% (represented by a dotted line). The bars represent the mean ± SE. Comparison by t‐test. *<.05; **<.01; ****<.0001. (A) Proliferation of T cells cultured with BMDMs (ratio 1:1) isolated by immunomagnetic sorting from the central region of GBM specimens, untreated (nt) or pretreated with HO‐1 inhibitors (n = 3). (B) Proliferation of T cells cultured with BMDMs (black bars, ratio 1:1) isolated by immunomagnetic sorting from the central region of GBM specimens (n = 7) or with Mφ (gray bars, ratio 1:0.5, n = 10), nt or pretreated with 5 μM ZnPPIX. (C,D) Proliferation of T cells in the presence of (C) BMDMs and (D) Mφ, nt, pretreated with 5 μM ZnPPIX or treated in co‐culture with 1 mM 1‐MT or 0.5 mM NN (C: n = 4, except for ZnPPIX + 1‐MT—n = 3; D: nt and 1‐MT—n = 9, ZnPPIX—n = 8, NN—n = 5, ZnPPIX + 1‐MT—n = 6). On the right side of each panel, CellTrace histograms from two representative experiments with either BMDMs or Mφ. αCD3/αCD28 PBMCs (red plots, with dashed line) are set as a control of proliferation
FIGURE 3
FIGURE 3
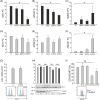
Modulation of molecules involved in immunosuppression after HO‐1 inhibition. Expression (FC) of (A) IDO1, (B) ARG2 and (C) HMOX1 by qRT‐PCR in BMDMs (black bars) from GBM specimens 24 hours after treatment with HO‐1 inhibitors. Mean ± SE of four experiments. Comparison by Mann‐Whitney test. *<.05. Expression of (D) IDO1, (E) ARG2 and (F) HMOX1 by qRT‐PCR in Mφ (gray bars) from HDs. Mean ± SE of four experiments. Comparison by Mann‐Whitney test. *<.05. (G) HO‐1 protein evaluation by flow cytometry in Mφ, nt or treated with 5 μM ZnPPIX. On the upper part, the bars represent the average MFI of HO‐1 protein ± SE of three experiments. On the bottom, representative flow cytometry plots of HO‐1 expression in nt (left) and ZnPPIX‐treated (right) Mφ. For each plot, the light blue peak corresponds to cell autofluorescence. (H) Western blot analysis of HO‐1 protein in Mφ, untreated (gray histograms) or treated with 5 μM ZnPPIX (black histograms). Cellular fractions were collected every 24 hours from the treatment for 4 days and hybridized with anti‐HO‐1 and anti‐α‐tubulin antibodies. The bars represent the HO‐1 expression normalized to each time point's untreated condition and calculated relative to the loading control. (I) CD163 expression in Mφ treated with HO‐1 modulators. On the upper part, the bars represent the average MFI calculated as a percentage reduction of CD163 in treated cells compared to untreated samples, set at 100%. The whiskers show the SE (n = 3 for OB 24 and SnPPIX; n = 5 for nt and ZnPPIX; n = 4 for CoPPIX). Comparison by Mann‐Whitney test. **<.01. On the bottom, representative flow cytometry plots of CD163 expression in nt (red histogram) and ZnPPIX‐treated (light‐blue histogram) Mφ
FIGURE 4
FIGURE 4
Modulation of PD‐L1 by HO‐1. (A) PD‐L1 expression in Mφ treated with HO‐1 modulators. The bars represent the average MFI calculated as a percentage reduction of PD‐L1 in treated cells compared to untreated cells, set at 100%; the whiskers denote the SE (n = 4, except for Stattic n = 3). Comparison by t‐test. *<.05; **<.01. (B) Western blot analysis of p‐STAT3 (MW = 86 kDa) and STAT3 (MW = 79 kDa) proteins in Mφ, untreated or treated with HO‐1 modulators. β‐Actin (MW = 42 kDa) was used as a control. (C) The bars represent the average p‐STAT3/STAT3 protein expression ratio normalized to the nt condition ± SE (n = 3, except for CoPPIX—n = 4 and ZnPPIX—n = 5). Comparison by t‐test. *<.05; ***<.001. (D) Representative flow cytometry histograms of PD‐L1 expression in Mφ cultured with or without activated or resting T cells for 24 hours. (E) The bars represent the average geometric MFI of PD‐L1 ± SE (n = 3). Comparison by t‐test. *<.05; **<.01
FIGURE 5
FIGURE 5
IDO1 activity measured by HPLC as L‐kynurenine release in cell supernatants. (A) BMDMs isolated from GBM specimens and (B) Mφ, untreated or treated with 5 μM ZnPPIX, were cultured for 24 hours with activated or resting T cells. The bars represent the median ± SE (A: n = 5 except for T‐cells + BMDM ZnPPIX, BMDM alone, BMDM ZnPPIX, αCD3/αCD28‐T‐cells and T‐cells alone n = 3; B: n = 7, except for αCD3/αCD28‐T‐cells and T‐cells alone n = 5). Comparison by t‐test. *<.05; ****<.0001
FIGURE 6
FIGURE 6
The role of HO‐1 in IL‐10 release by Mφ and T cells upon contact. Mφ, untreated, pre‐treated with 5 μM ZnPPIX or treated in co‐culture with 1 mM 1‐MT, were cultured with or without T cells for 14 hours. IL‐10‐expressing cells were evaluated. Comparison by Mann‐Whitney test. *<.05; **<.01. The bars represent the mean ± SE of (A) IL‐10‐expressing Mφ and (B) IL‐10‐expressing T cells (n = 3 for αCD3/αCD28‐T‐cells + 1‐MT; n = 4 for T cells, T‐cells + Mφ 1‐MT, αCD3/αCD28‐T‐cells + Mφ 1‐MT, Mφ 1‐MT; n = 5 for T‐cells + ZnPPIX‐treated Mφ, αCD3/αCD28‐T‐cells + ZnPPIX‐treated Mφ, ZnPPIX‐treated Mφ; n = 6 for αCD3/αCD28‐T‐cells, T‐cells + nt Mφ, αCD3/αCD28‐T‐cells + nt Mφ, nt Mφ)

Similar articles

Cited by

References

    1. Bejarano L, Jordao MJC, Joyce JA. Therapeutic targeting of the tumor microenvironment. Cancer Discov. 2021;11(4):933‐959. doi:10.1158/2159-8290.CD-20-1808 - DOI - PubMed
    1. Porta C, Sica A, Riboldi E. Tumor‐associated myeloid cells: new understandings on their metabolic regulation and their influence in cancer immunotherapy. FEBS J. 2018;285(4):717‐733. doi:10.1111/febs.14288 - DOI - PubMed
    1. Mantovani A, Marchesi F, Malesci A, Laghi L, Allavena P. Tumour‐associated macrophages as treatment targets in oncology. Nat Rev Clin Oncol. 2017;14(7):399‐416. doi:10.1038/nrclinonc.2016.217 - DOI - PMC - PubMed
    1. Noy R, Pollard JW. Tumor‐associated macrophages: from mechanisms to therapy. Immunity. 2014;41(1):49‐61. doi:10.1016/j.immuni.2014.06.010 - DOI - PMC - PubMed
    1. Molgora M, Colonna M. Turning enemies into allies‐reprogramming tumor‐associated macrophages for cancer therapy. Med (N Y). 2021;2(6):666‐681. doi:10.1016/j.medj.2021.05.001 - DOI - PMC - PubMed

Publication types