. 2022 Dec 1;140(22):2371-2384.
doi: 10.1182/blood.2022016741.

Epo-IGF1R cross talk expands stress-specific progenitors in regenerative erythropoiesis and myeloproliferative neoplasm

Affiliations

Epo-IGF1R cross talk expands stress-specific progenitors in regenerative erythropoiesis and myeloproliferative neoplasm

Hsi-Hsien Hsieh et al. Blood. .

Abstract

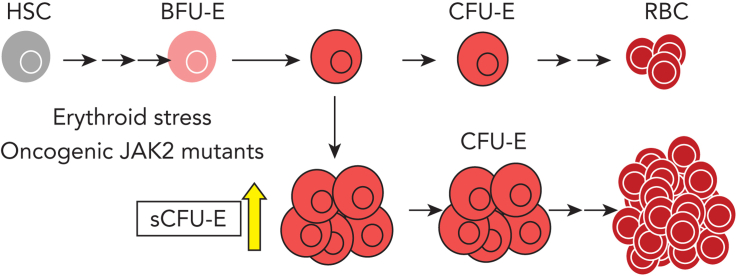
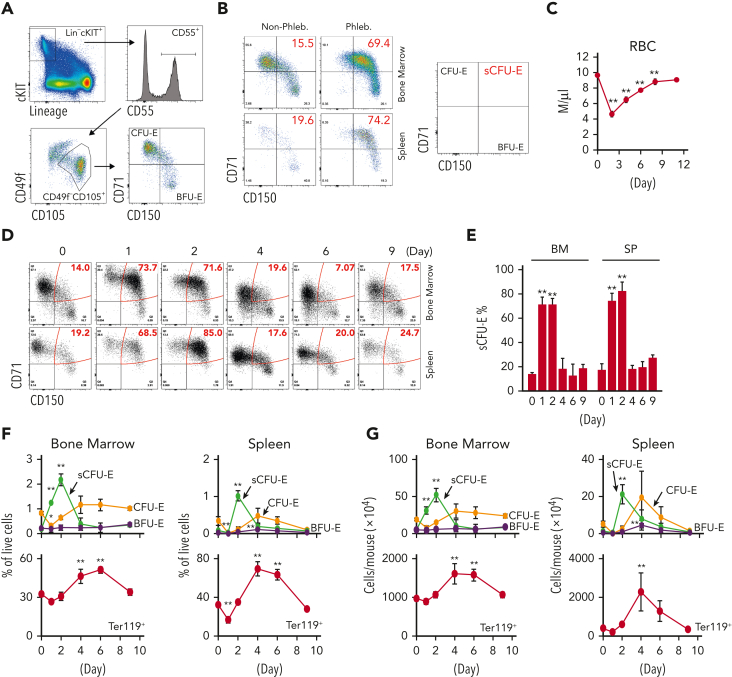
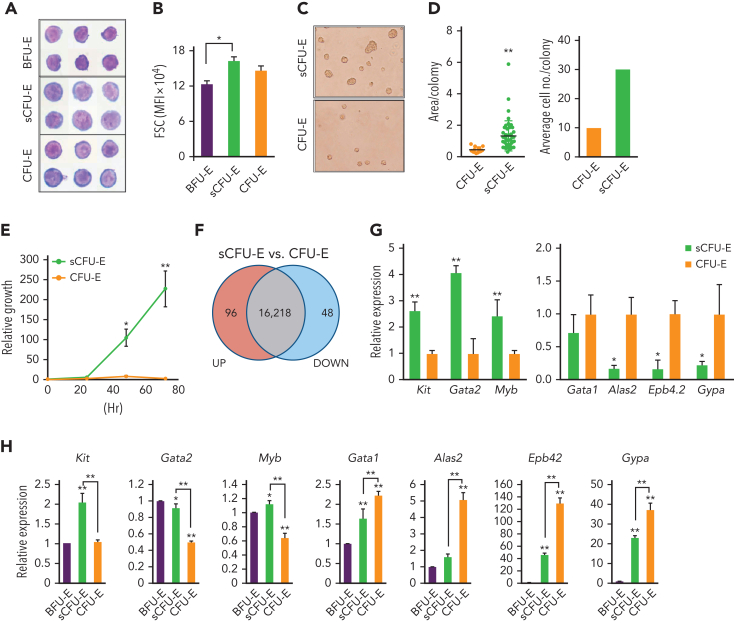
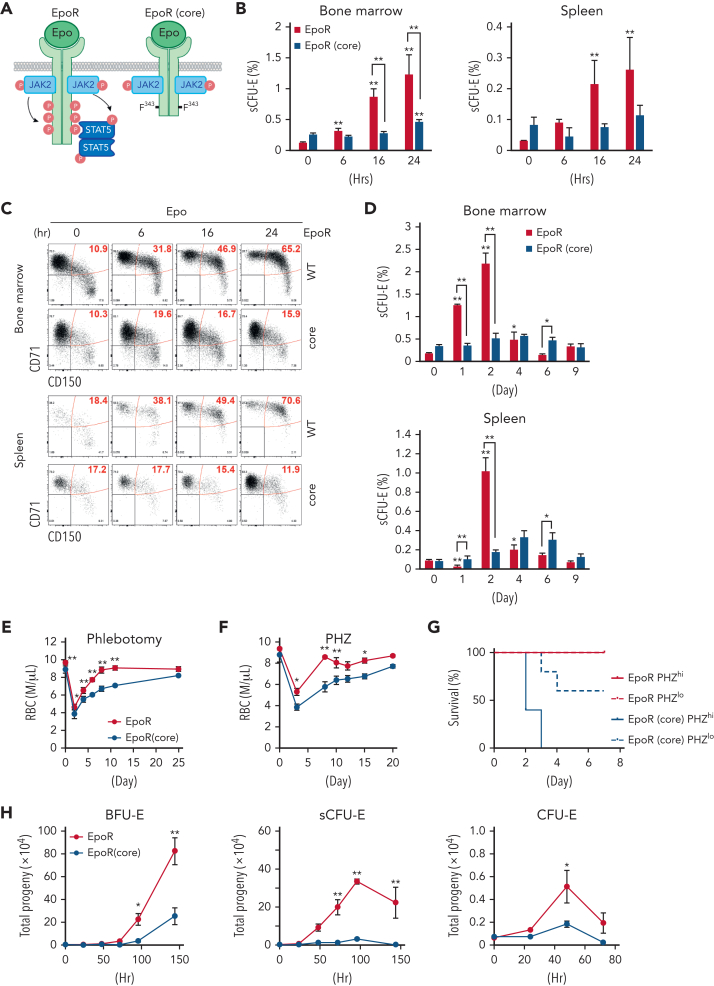
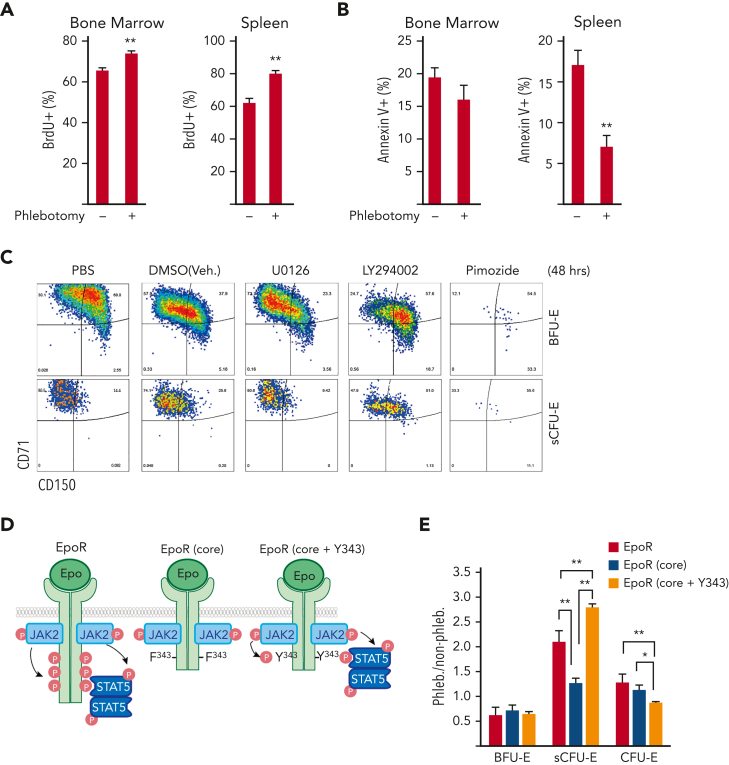
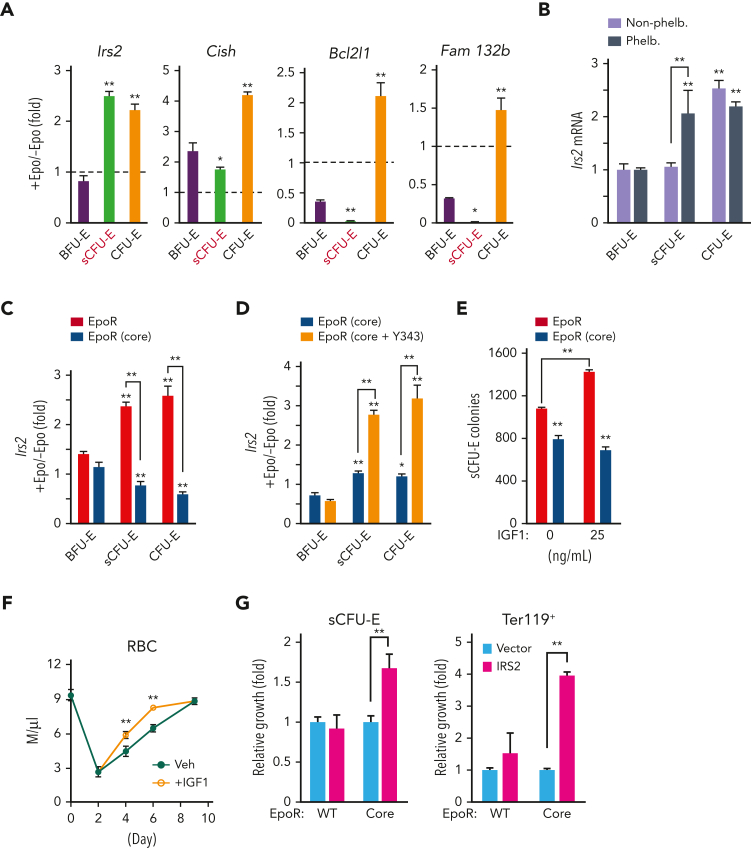
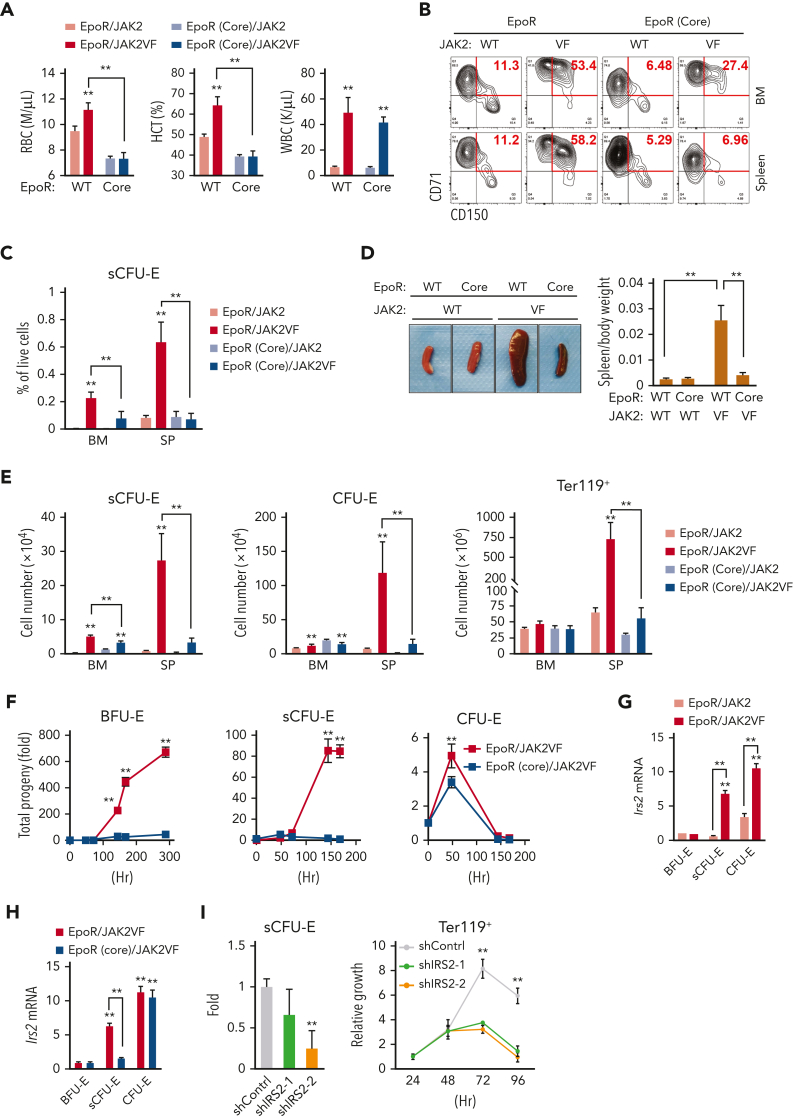
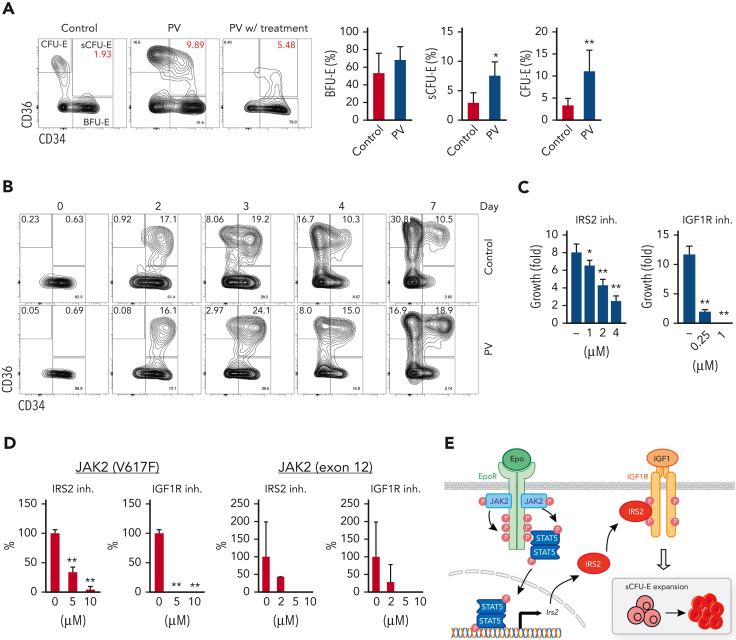
We found that in regenerative erythropoiesis, the erythroid progenitor landscape is reshaped, and a previously undescribed progenitor population with colony-forming unit-erythroid (CFU-E) activity (stress CFU-E [sCFU-E]) is expanded markedly to restore the erythron. sCFU-E cells are targets of erythropoietin (Epo), and sCFU-E expansion requires signaling from the Epo receptor (EpoR) cytoplasmic tyrosines. Molecularly, Epo promotes sCFU-E expansion via JAK2- and STAT5-dependent expression of IRS2, thus engaging the progrowth signaling from the IGF1 receptor (IGF1R). Inhibition of IGF1R and IRS2 signaling impairs sCFU-E cell growth, whereas exogenous IRS2 expression rescues cell growth in sCFU-E expressing truncated EpoR-lacking cytoplasmic tyrosines. This sCFU-E pathway is the major pathway involved in erythrocytosis driven by the oncogenic JAK2 mutant JAK2(V617F) in myeloproliferative neoplasm. Inability to expand sCFU-E cells by truncated EpoR protects against JAK2(V617F)-driven erythrocytosis. In samples from patients with myeloproliferative neoplasm, the number of sCFU-E-like cells increases, and inhibition of IGR1R and IRS2 signaling blocks Epo-hypersensitive erythroid cell colony formation. In summary, we identified a new stress-specific erythroid progenitor cell population that links regenerative erythropoiesis to pathogenic erythrocytosis.


Conflict of interest statement

Conflict-of-interest disclosure: R.K.R. has received consulting fees from Constellation, Incyte, Celgene/BMS, Novartis, Promedior, CTI, Jazz Pharmaceuticals, Blueprint, Stemline, Galecto, Pharmaessentia, Abbvie, Sierra Oncology, and Disc Medicines. The remaining authors declare no competing financial interests.

Figures

None
Graphical abstract
Figure 1.
Figure 1.
sCFU-E cells expand in erythropoietic stress. (A) Flow cytometric gating strategy. (B) Percentages of sCFU-E cells increase in the bone marrow and spleen of phlebotomized (Phleb.) mice 2 days after phlebotomy. (C) RBC counts on indicated day after phlebotomy. (D) Representative flow cytometry plots of temporal sCFU-E cell increases in the bone marrow (BM) and spleen (SP) of phlebotomized mice. (E) Quantification of percentage changes of sCFU-E cells in (D). (F) Quantification of BFU-E, sCFU-E, CFU-E, and Ter119+ cell percentages in phlebotomized mice at indicated times. (G) Total numbers of BFU-E, sCFU-E, CFU-E, and Ter119+ cells in phlebotomized mice at indicated times. Data represent the mean ± SD. ∗P < .05; ∗∗P < .01, 1-way ANOVA.
Figure 2.
Figure 2.
sCFU-E cells exhibit higher growth potential and express lower levels of erythroid-committed genes compared with CFU-E cells. (A) Histologic staining of sorted BFU-E, sCFU-E, and CFU-E cells. (B) Quantification of forward scatter (FSC) median fluorescence intensity, an indicator of cell size, by flow cytometry. (C) sCFU-E cells generate unifocal colonies on day 2. Colonies generated from sCFU-E cells are larger than those from CFU-E cells. (D) Quantification of area per colony and average cell number per colony in (C). (E) Sorted sCFU-E cells generate more progenies than CFU-E cells in vitro. (F) Comparison of sCFU-E and CFU-E cell transcriptome by RNA-seq. The number of genes with expression greater (up) or less (down) than 1.5-fold are indicated. (G) Relative expression of indicated genes in sCFU-E vs CFU-E cells from RNA-seq data. (H) Expression of indicated genes in sorted BFU-E, sCFU-E, and CFU-E by qPCR. Gene expression is normalized first to β-actin and then to expression in BFU-E cells. Significant differences between sCFU-E and CFU-E cells are specified. Data represent mean ± SD. Statistically significant differences indicated on top of each bar are in comparison with BFU-E cells. ∗P < .05; ∗∗P < .01, Student’s t test or 1-way ANOVA.
Figure 3.
Figure 3.
sCFU-E cells expansion is impaired in mice expressing truncated EpoR. (A) Diagrams of full-length EpoR and EpoR(core). (B) Epo-induced sCFU-E expansion is defective in EpoR(core) mice. Percentages of sCFU-E cells in the bone marrow or spleen were quantified at indicated times after Epo injection in mice expressing wild-type EpoR or EpoR(core). Statistically significant differences indicated on top of each bar are in comparison with time 0, whereas significant differences between EpoR and EpoR(core) at specific time points are specified. (C) Representative flow cytometry data from (B). (D) sCFU-E expansion after phlebotomy is defective in EpoR(core) mice. Statistically significant differences indicated on top of each bar are comparison with day 0, whereas significant differences between EpoR and EpoR(core) at specific time points are specified. (E) RBC counts after phlebotomy in mice expressing EpoR or EpoR(core) at indicated times. (F) RBC counts after PHZ-induced hemolysis in mice expressing EpoR or EpoR(core) at indicated times. (G) EpoR(core) mice die of erythropoietic stress elicited by PHZ treatment. Dosing of 62.5 mg/kg (PHZlo) or 87.5 mg/kg (PHZhi) is as indicated. (H) Sorted BFU-E and sCFU-E cells from EpoR(core) mice generated dramatically fewer erythroid progenies. Ter119+ erythroid progenies are enumerated at indicated time harvested from in vitro culture. Data represent the mean ± SD. ∗P < .05; ∗∗P < .01, 2-way ANOVA.
Figure 4.
Figure 4.
STAT5 signaling is essential for sCFU-E growth. (A) Proliferation increases in sCFU-E cells after phlebotomy. (B) Apoptosis decreases in sCFU-E cells after phlebotomy. In (A) and (B), sCFU-E cells from freshly isolated bone marrow were gated for analyses. (C) Inhibitors to STAT5 abolish sCFU-E growth. Sorted BFU-E and sCFU-E cells are cultured in 10 μM of inhibitors or vehicle control (dimethyl sulfoxide [DMSO]) and analyzed after 48 hours. Phosphate-buffered saline (PBS)-treated samples also are shown as controls. (D) Diagrams of EpoR(core) and EpoR(core+Y343). (E) Y343 in EpoR rescues STAT5 binding and sCFU-E expansion in EpoR(core+Y343) mice. Data represent the mean ± SD. BrdU, bromodeoxyuridine; Phleb., phlebotomized. ∗P < .05; ∗∗P < .01, Student’s t test or 2-way ANOVA.
Figure 5.
Figure 5.
STAT5-induced IRS2 engages IGF1R signaling to promote sCFU-E growth. (A) Epo-induced expression of candidate STAT5 target genes in sorted BFU-E, sCFU-E, and CFU-E cells by qPCR. (B) Phlebotomy induces IRS2 expression in sCFU-E cells. Statistically significant differences indicated on top of each bar are comparison with BFU-E cells, whereas significant differences between nonphlebotomized and phlebotomized (phleb.) conditions are specified. (C) Epo-induced IRS2 expression is defective in sCFU-E and CFU-E cells of EpoR(core) mice. (D) Y343 rescues Epo-induced IRS2 expression in EpoR(core+Y343) sCFU-E and CFU-E cells. (E) IGF1 increases sCFU-E colonies in mice expressing wild-type (WT) but not EpoR(core). (F) IGF1 injection accelerates RBC recovery after phlebotomy. (G) Exogenous expression of IRS2 increases the growth of sCFU-E cells and the number of Ter119+ progenies generated in bone marrow cells from EpoR(core). GFP+ cells were gated for analyses and normalized to vector controls. Veh., vehicle control. ∗P < .05; ∗∗P < .01, 1-way or 2-way ANOVA.
Figure 6.
Figure 6.
Impaired sCFU-E expansion prevents JAK2(V617F)-driven erythrocytosis in MPN. (A) Blood cell counts in transplanted mice expressing EpoR or EpoR(core) together with JAK2 or JAK2(V617F) 3 months after transplantation. (B-C) JAK2(V617F)-driven sCFU-E expansion is defective in transplant-recipient mice expressing EpoR(core). Representative flow plots are shown in (B) and quantifications in (C). (D) Expression of EpoR(core) prevents JAK2(V617F)-induced splenomegaly in JAK2(V617F)KI mice. (E) The numbers of sCFU-E, CFU-E, and Ter119+ cells are reduced significantly in EpoR(core)/JAK2(V617F)KI mice compared with EpoR/JAK2(V617F)KI mice. (F) Sorted BFU-E and sCFU-E cells from EpoR(core)/JAK2(V617F)KI mice fail to generate Ter119+ progenies in vitro. Cells were cultured in media with SCF, but devoid of Epo. (G) In mice expressing wild-type (WT) EpoR, JAK2(V617F) increases IRS2 messenger RNA (mRNA) expression in sCFU-E and CFU-E cells. (H) IRS2 mRNA expression is reduced significantly in sCFU-E cells from EpoR(core)/JAK2(V617F) mice. (I) IRS2 knockdown inhibits sCFU-E and erythroid progeny growth in vitro. GFP+ cells are gated for analyses. sCFU-E fold changes are normalized to shControl, and the relative growth of Ter119+ cells are normalized to cell numbers at 24 hours. BM, bone marrow; HCT, hematocrit; SP, spleen; VF, JAK2(V617F); WBC, white blood cell. ∗P < .05, ∗∗P < .01, 2-way ANOVA.
Figure 7.
Figure 7.
sCFU-E cells are expanded in human PV, and inhibition of IGF1R/IRS2 signaling suppresses Epo-hypersensitive erythroid colonies. (A) Percentages of CD34+CD36+ and CD34CD36+cells increase in PV samples. (B) In vitro culture of sorted BFU-E cells from PV or controls. Cells are examined by flow cytometry on indicated day after culture. (C) Inhibitors of IRS2 or IGF1R kinase activity reduce sorted murine sCFU-E growth in vitro. Data presented are 48 hours in culture. (D) IRS2 and IGF1R kinase inhibitors reduce the number of erythroid colonies grown from peripheral mononuclear cells from patients with PV. Cells are cultured in methylcellulose media with SCF (50 ng/mL) and low Epo (0.05 U/mL), and colonies are scored on day 14. (E) Current model of EpoR-IGF1R/IRS2 signaling cross talk. inh., inhibitor .∗P < .05; ∗∗P < .01, Student’s t test or 1-way ANOVA.

Similar articles

Cited by

References

    1. Constantinescu SN, Ghaffari S, Lodish HF. The erythropoietin receptor: structure, activation and intracellular signal transduction. Trends Endocrinol Metab. 1999;10(1):18–23. - PubMed
    1. Kuhrt D, Wojchowski DM. Emerging EPO and EPO receptor regulators and signal transducers. Blood. 2015;125(23):3536–3541. - PMC - PubMed
    1. Wu H, Liu X, Jaenisch R, Lodish HF. Generation of committed erythroid BFU-E and CFU-E progenitors does not require erythropoietin or the erythropoietin receptor. Cell. 1995;83(1):59–67. - PubMed
    1. Ihle JN. STATs: signal transducers and activators of transcription. Cell. 1996;84(3):331–334. - PubMed
    1. Darnell JE., Jr. STATs and gene regulation. Science. 1997;277(5332):1630–1635. - PubMed

Publication types

MeSH terms