. 2022 Sep:83:104242.
doi: 10.1016/j.ebiom.2022.104242. Epub 2022 Aug 30.

Survey of extracellular communication of systemic and organ-specific inflammatory responses through cell free messenger RNA profiling in mice

Affiliations

Survey of extracellular communication of systemic and organ-specific inflammatory responses through cell free messenger RNA profiling in mice

Jiali Zhuang et al. EBioMedicine. 2022 Sep.

Abstract

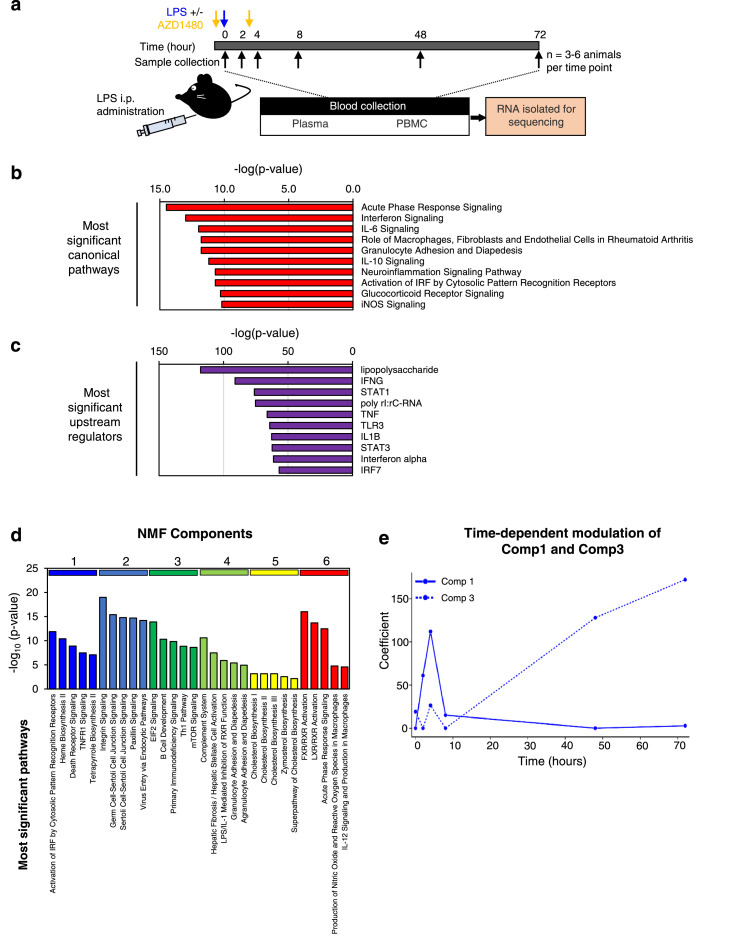
Background: Inflammatory and immune responses are essential and dynamic biological processes that protect the body against acute and chronic adverse stimuli. While conventional protein markers have been used to evaluate systemic inflammatory response, the immunological response to stimulation is complex and involves modulation of a large set of genes and interacting signalling pathways of innate and adaptive immune systems. There is a need for a non-invasive tool that can comprehensively evaluate and monitor molecular dysregulations associated with inflammatory and immune responses in circulation and in inaccessible solid organs.

Methods: Here we utilized cell-free messenger RNA (cf-mRNA) RNA-Seq whole transcriptome profiling and computational biology to temporally assess lipopolysaccharide (LPS) induced and JAK inhibitor modulated inflammatory and immune responses in mouse plasma samples.

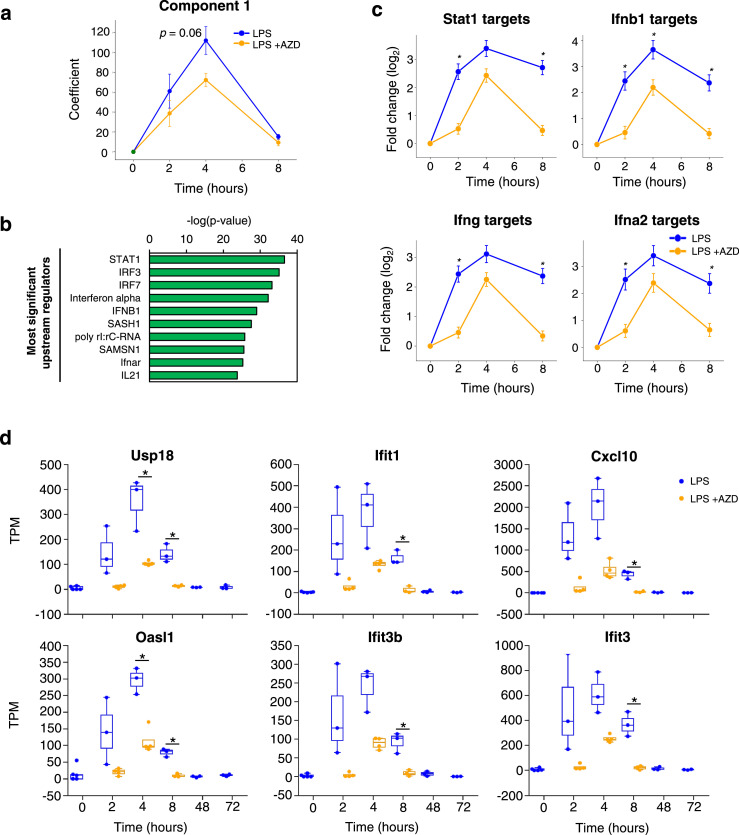
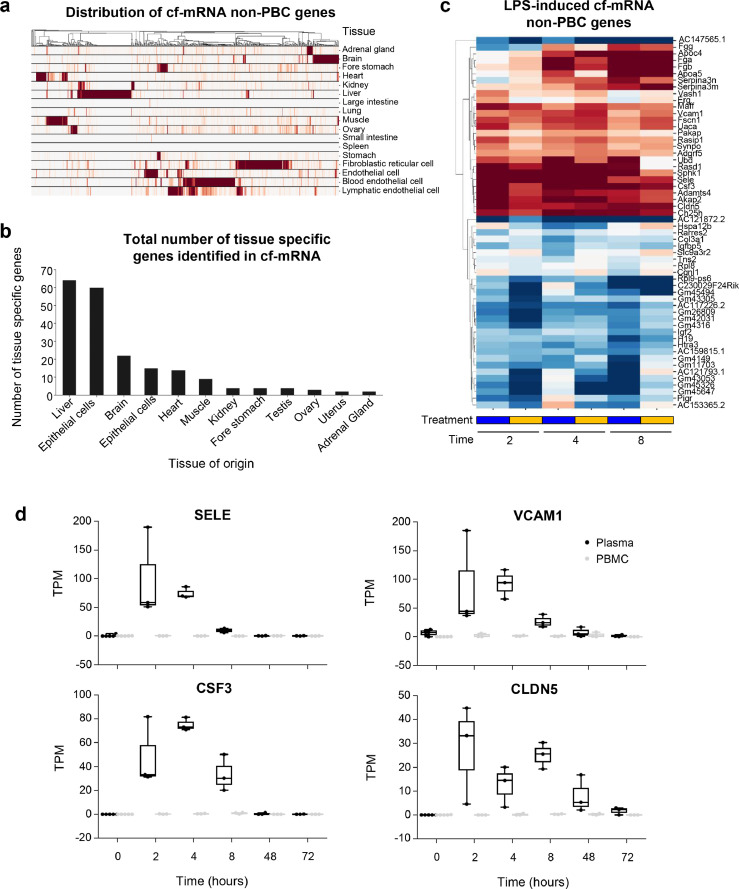
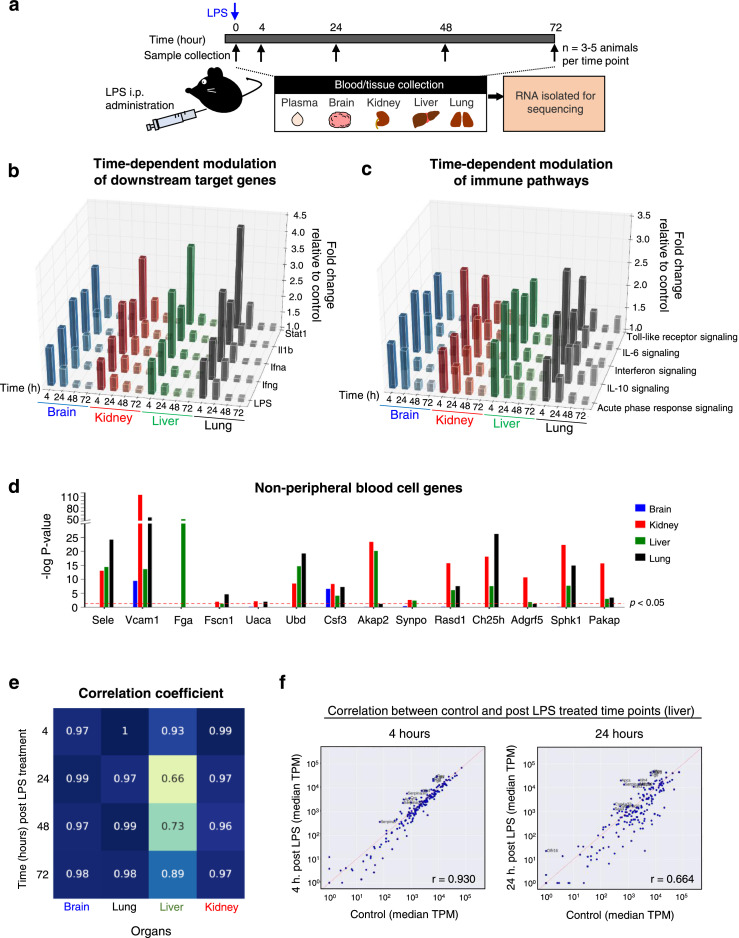
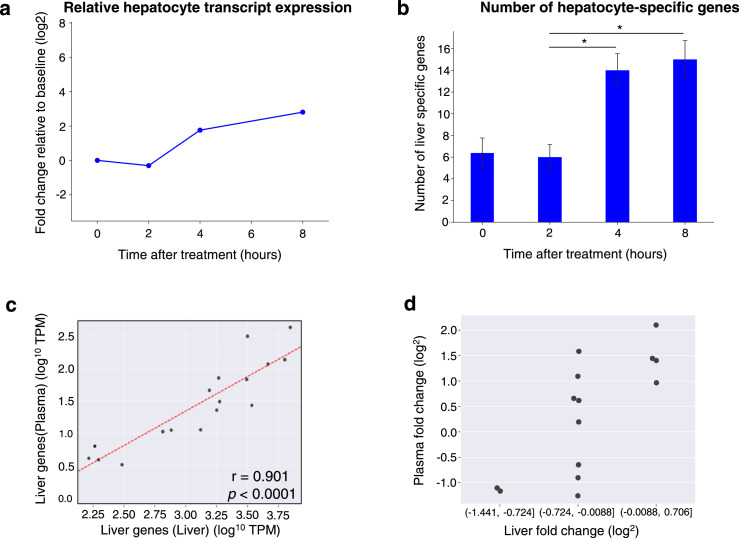
Findings: Cf-mRNA profiling displayed a pattern of systemic immune responses elicited by LPS and dysregulation of associated pathways. Moreover, attenuation of several inflammatory pathways, including STAT and interferon pathways, were observed following the treatment of JAK inhibitor. We further identified the dysregulation of liver-specific transcripts in cf-mRNA which reflected changes in the gene-expression pattern in this generally inaccessible biological compartment.

Interpretation: Using a preclinical mouse model, we demonstrated the potential of plasma cf-mRNA profiling for systemic and organ-specific characterization of drug-induced molecular alterations that are associated with inflammatory and immune responses.

Funding: Molecular Stethoscope.

Keywords: Cell free messenger RNA; Inflammation; Liquid biopsy; Systemic inflammatory response.


Conflict of interest statement

Declaration of interests JZ, AI, AA, APK, JA, MN JJS and ST are past/current employees at Molecular Stethoscope Inc. JJS, SRQ and ST have company stock options. SRQ is a founder of Molecular Stethoscope Inc. and a member of scientific advisory board.

Figures

Figure 1
Figure 1
Identification of 6 cf-mRNA sub-clusters following LPS treatment. (a) A schematic overview of the experimental design. (b) Most significant IPA canonical pathways identified using 750 dysregulated cf-mRNA transcripts as inputs (Control vs 4 h. post LPS treatment). (c) Upstream regulators identified using 750 dysregulated cf-mRNA transcripts as inputs (Control vs 4 h. post LPS treatment). (d) Most significant canonical pathways for individual NMF components. (e) Temporal patterns of component 1 (solid line) and component 3 (dashed line) transcripts. For all pathway analyses, p-values were calculated using Fisher's exact test.
Figure 2
Figure 2
Cf-mRNA profiling captures anti-inflammatory property of immunomodulators. (a) Time-dependent temporal patterns of component 1 transcripts following LPS treatment with (blue) or without (orange) AZD. (b) Upstream regulators identified using 87 dysregulated cf-mRNA transcripts as inputs (2 h. post LPS treatment with or without AZD). p-values were calculated using Fisher's exact test. (c) Average fold changes of target transcripts of JAK/STAT related upstream regulators relative to the untreated controls. (d) Temporal changes in expression levels of Interferon-γ related transcripts. Mann-Whitney test was used to compare LPS vs LPS+AZD groups (Figures, a, c and d) * represents p <0.05.
Figure 3
Figure 3
Identification of tissue-specific gene-expression signals for inflammatory responses. (a) Expression patterns of non-peripheral blood cell (PBC) transcripts across tissues and cell types. Each row represents a tissue or cell type while each column represents a gene. Each column (gene) is normalized by its maximum value. A hierarchical clustering was performed on the columns. (b) Number of tissue specific transcripts. A transcript with expression level in a particular tissue >5 fold higher than any other tissue is considered specific to that particular tissue. (c) A heatmap depicting fold changes relative to baseline at various time points for non- PBC transcripts. Only transcripts that are significantly differentially expressed compared to baseline (FDR < 0.01) and with TPM > 30 in at least one condition are shown. Hierarchical clustering was performed on the transcripts (rows). Animals treated with LPS treatment with (blue) or without (orange) AZD. (d) Examples of LPS-induced expression changes for non-PBC transcripts. Expression levels in the plasma samples were denoted in black while those in the matching PBMC samples were denoted in grey.
Figure 4
Figure 4
Identification of organ-specific transcript dysregulation. (a) A schematic overview of the experimental design. (b) Bar plots showing the median fold changes of transcripts in inflammation related canonical pathways relative to untreated controls. (c) Bar plots showing the median fold changes of downstream target transcripts for immune related regulators Stat1, Il1b, Interferon-α, Interferon-β and LPS relative to untreated controls. (d) Bar plots showing the statistical significance (corrected p-value) of differential expression in the tissues 4 hours after LPS treatment. Those transcripts were chosen because they were significantly upregulated in the plasma and with TPM > 30. The red dashed line indicates the p = 0.05 significance level.  (e) Heatmap showing the correlation of tissue specific transcript expression levels between LPS-treated samples and untreated control samples. The columns correspond to different tissues while rows correspond to different time points after treatment. The numbers in each grid represents the Pearson Correlation Coefficient for each comparison. (f) Scatter plots comparing expression levels of liver specific transcripts 4 hours (left) and 24 hours (right) after LPS treatment against untreated controls (x-axis).
Figure 5
Figure 5
LPS-induced transcriptional changes of liver-specific transcripts are reflected in cf-mRNA (a) Gene-expression changes of liver specific transcripts following LPS treatment (represented as fold change). Each light blue line represents one liver specific transcript, the blue curve represents the median of all the liver specific transcripts. The fold changes are relative to untreated controls. (b) Number of liver specific transcripts detected in plasma samples at specific time points (TPM > 5 was used as a detection cut off for individual genes). Mann-Whitney test was used to compared different time points. *represents p < 0.05. (c) Scatter plot directly comparing expression levels of liver specific transcripts in the liver tissue (x-axis) and the plasma sample (y-axis). The comparison shown was based on liver tissues and plasma samples harvested from mice 8 hours after LPS treatment. (d) Liver specific transcripts were grouped by their expression fold change in the liver tissue between 4-hour and 8-hour after LPS treatment. The group with higher fold change in the liver tissue also have higher fold change in the plasma and vice versa.

References

    1. Chen L, Deng H, Cui H, et al. Inflammatory responses and inflammation-associated diseases in organs. Oncotarget. 2018;9(6):7204–7218. - PMC - PubMed
    1. Lis K, Kuzawińska O, Bałkowiec-Iskra E. Tumor necrosis factor inhibitors - state of knowledge. Arch Med Sci. 2014;10(6):1175–1185. - PMC - PubMed
    1. Rose-John S, Schooltink H. Cytokines are a therapeutic target for the prevention of inflammation-induced cancers. Recent Results Cancer Res. 2007;174:57–66. - PubMed
    1. Rawlings JS, Rosler KM, Harrison DA. The JAK/STAT signaling pathway. J Cell Sci. 2004;117(Pt 8):1281–1283. - PubMed
    1. Samadi A, Ahmad Nasrollahi S, Hashemi A, Nassiri Kashani M, Firooz A. Janus kinase (JAK) inhibitors for the treatment of skin and hair disorders: a review of literature. J Dermatolog Treat. 2017;28(6):476–483. - PubMed