. 2022 Sep 1;29(9):1346-1365.e10.
doi: 10.1016/j.stem.2022.08.001.

Modeling human extraembryonic mesoderm cells using naive pluripotent stem cells

Affiliations

Modeling human extraembryonic mesoderm cells using naive pluripotent stem cells

Thi Xuan Ai Pham et al. Cell Stem Cell. .

Abstract

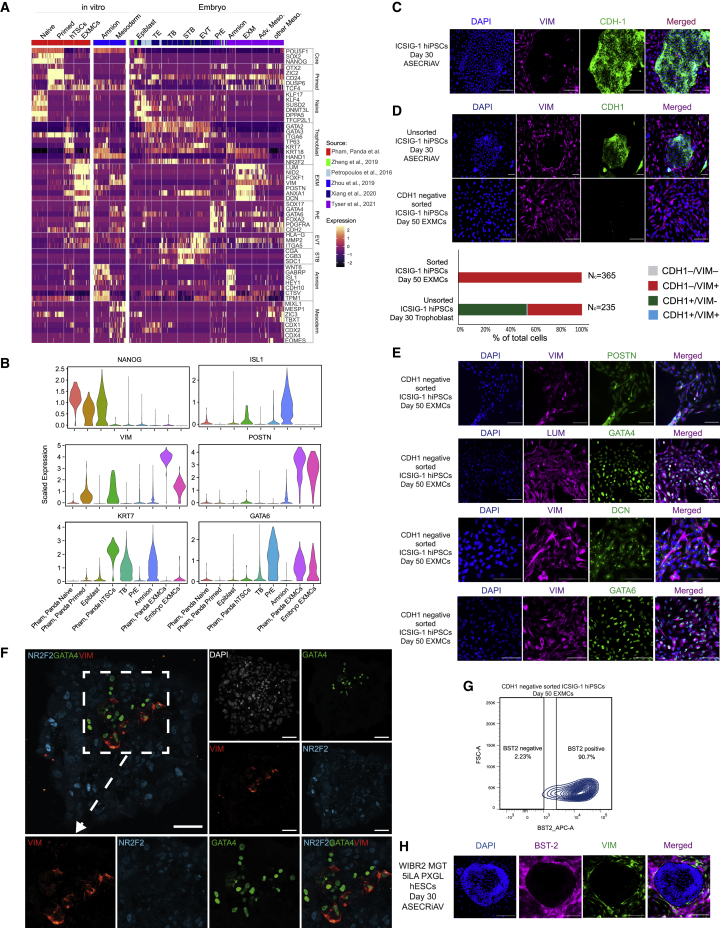
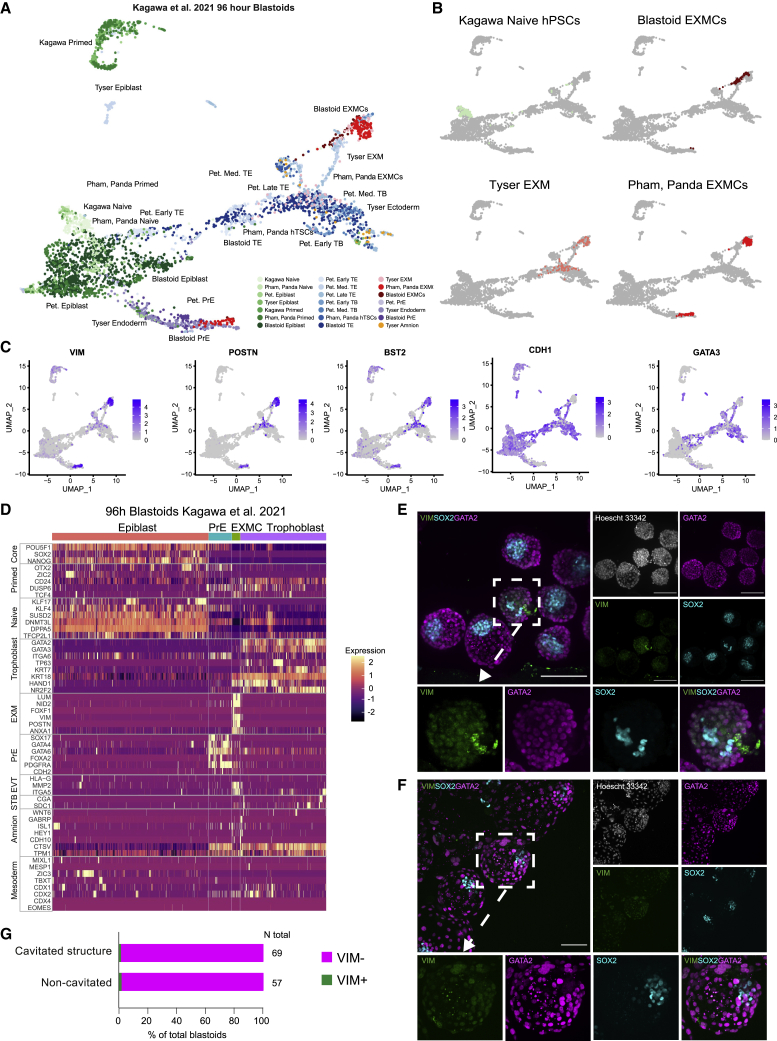
A hallmark of primate postimplantation embryogenesis is the specification of extraembryonic mesoderm (EXM) before gastrulation, in contrast to rodents where this tissue is formed only after gastrulation. Here, we discover that naive human pluripotent stem cells (hPSCs) are competent to differentiate into EXM cells (EXMCs). EXMCs are specified by inhibition of Nodal signaling and GSK3B, are maintained by mTOR and BMP4 signaling activity, and their transcriptome and epigenome closely resemble that of human and monkey embryo EXM. EXMCs are mesenchymal, can arise from an epiblast intermediate, and are capable of self-renewal. Thus, EXMCs arising via primate-specific specification between implantation and gastrulation can be modeled in vitro. We also find that most of the rare off-target cells within human blastoids formed by triple inhibition (Kagawa et al., 2021) correspond to EXMCs. Our study impacts our ability to model and study the molecular mechanisms of early human embryogenesis and related defects.

Keywords: extraembryonic mesoderm; human blastoids; human embryos; human naive pluripotent stem cells.


Conflict of interest statement

Declaration of interests The Institute for Molecular Biotechnology, Austrian Academy of Sciences has filed patent application EP21151455.9 describing the protocols for human blastoid formation. H.K. and N.R. are the inventors of this patent. All other authors declare no competing interests. J.R. is a member of the Cell Stem Cell advisory board.

Figures

None
Graphical abstract
Figure 1
Figure 1
Derivation of EXMCs from naive hPSCs (A) Experimental strategy. Created with Biorender. (B) Bright-field microscopy images showing ICSIG-1 naive hPSCs and converted cells under ASECRiAV. Scale bar 500 μm. (C) IF for the indicated marker in PXGL and ASECRiAV. Scale bar 100 μm. (D) Flow cytometry contour plot of day 30 ASECRiAV cells analyzed for CDH1. Microscopy images of naive hPSCs converted under ASECRiAV for 30 days and cells sorted for lack of CDH1. Scale bar 500 μm. (E) UMAP of day 30 TB conversion, naive and primed hPSCs scRNA-seq data. (F) UMAP of integrated datasets of published human embryos, reference hPSCs, and this study. (G) Selected cell type annotations from (F). (H) UMAP of integrated datasets from monkey embryos, human-monkey chimera, and data from this study. (I) Selected cell type annotations from (H). See also Figure S1, Tables S1, and S5.
Figure 2
Figure 2
Characterization of EXMCs (A) Marker genes expression heatmap. (B) Marker gene expression violin plots. (C) IF for the indicated markers in day 30 ASECRiAV cells. Scale bar 200 μm. (D) As in 2C for the indicated cell types. Scale bar 200 μm; bottom: quantification; nc: total nuclei count. (E) IF for the indicated markers and cell types. Scale bar 100 μm. (F) IF for the indicated markers in a day 10 human embryo. Scale bar 100 μm. (G) BST2 flow cytometry of sorted CDH1- EXMCs. (H) IF for the indicated markers in day 30 ASECRiAV cells. Scale bar 200 μm. See also Figure S2, Videos S1 and S2, and Table S2.
Figure 3
Figure 3
Gene regulatory networks and scATAC-seq profiles of EXMCs (A) Activity of the top differentially active regulons (SCENIC). (B) Regulon activity for indicated TFs. Significant difference between regulon activity, Wilcoxon rank-sum test, adjusted p < 210−16, ∗∗ adjusted p = 3.910−8. See Table S5 for the n number of cells included in each cell type. (C) Median regulon activity in naive hPSCs versus EXMCs. Points colored by –log(Bonferroni adjusted p value). See Table S5 for the n number of cells included in each cell type. (D) IF for the indicated markers in the indicated cell types. Scale bar 100 μm. (E) Dot plot of marker genes chromatin accessibility (scATAC-seq). (F) scATAC-seq motif enrichment. See also Figure S3 and Table S4.
Figure 4
Figure 4
Signaling pathways in EXMCs (A) Western blot analysis for the indicated proteins in naive ICSIG-1 hPSCs and EXMCs with and without BMP4 inhibition (LDN-193189). (B) Quantification of (A). AU: arbitrary unit. Quantification from n = one experiment. (C) IF for the indicated markers in the indicated cell types. Scale bar 200 μm. (D) Number of EXMCs grown for 5 or 10 days under either BMP4 inhibition (1 μM LDN-193189) or mTOR inhibition (1 μM GSK1059615). n = 2 experiments. Biological replicates are shown as individual data points. See also Figure S4.
Figure 5
Figure 5
Single-cell time course analysis (A) Experimental strategy. Image created with Biorender. (B) UMAP of time course scRNA-seq data during differentiation of naive hPSCs under ASECRiAV condition as well as day 70 EXMCs, colored by days. (C) As in (B), colored by cell types. (D) Expression of selected markers in (B). (E) Proportion of cell types during ASECRiAV conversion in (B). Cell numbers can be found in Table S5. (F) Expression of selected genes during conversion. (G) IF for the indicated markers during naive hPSC to ASECRiAV conversion. Scale bar 100 μm. Please note feeders have background staining for NR2F2 in D0-D4 images. (H) Quantification of (G). n = two rounds of differentiation. See also Figure S5 and Table S5.
Figure 6
Figure 6
Origins of EXMCs (A) Flow cytometry analysis of naive hPSCs (ICSIG-1). (B) Bright-field microscopy images of SUSD2+ and –ICSIG-1 naive hPSCs 24 h after sorting and cultured back in PXGL (Top) and 8 days after switching to ASECRiAV (Bottom). Scale bar 500 μm. (C) IF for the indicated markers in day 12 ASECRiAV cells converted from SUSD2 sorted naive cells. Scale bar 100 μm. (D) Quantification of C. Nuclei counted from 5 random fields. (E) IF for the indicated markers in TROP2+/BST2– sorted ICSIG-1 hPSCs, BST2+/TROP2– sorted ICSIG-1 hPSCs and TROP2–/BST2– sorted cells at day 12 of ASECRiAV conversion. Scale bar 100 μm. (F) Quantification of E. Nuclei counted from 5 random fields. (G) As in (E) in TROP2+/BST2– sorted ICSIG-1 hPSCs, BST2+/TROP2– sorted ICSIG-1 hPSCs and TROP2–/BST2– sorted cells at day 12 of ASECRiAV conversion. Scale bar, 100 μm. (H) As in (F) but for (G). See also Figure S6.
Figure 7
Figure 7
Blastoids contain EXM-like cells (A) UMAP of the integration of 96 h blastoid data (Kagawa et al., 2021) with embryonic data sets (Petropoulos et al., 2016; Tyser et al., 2021) and our ASECRiAV conversion containing TB and EXMCs from Figure 1. (B) Selected cell type annotations from (A). (C) Selected gene expression from (A). (D) Selected gene expression. Expression scaled as Z score, 0 is mean expression per gene across all cells, and 1 indicates cells with expression 1 standard deviation higher than the mean. (E and F) IF for the indicated markers after 96 h of blastoid generation. VIM+ structures indicated with white box (top left), enlarged at the bottom. Scale bar 200 μm. Non-cavitated (E, box) and cavitated structure (F, box). (G) Quantification of (E) and (F). See also Figure S7.

Comment in

References

    1. Aibar S., González-Blas C.B., Moerman T., Huynh-Thu V.A., Imrichova H., Hulselmans G., Rambow F., Marine J.-C., Geurts P., Aerts J., et al. SCENIC: single-cell regulatory network inference and clustering. Nat. Methods. 2017;14:1083–1086. doi: 10.1038/nmeth.4463. - DOI - PMC - PubMed
    1. Angerer P., Haghverdi L., Büttner M., Theis F.J., Marr C., Buettner F. destiny: diffusion maps for large-scale single-cell data in R. Bioinformatics. 2016;32:1241–1243. doi: 10.1093/bioinformatics/btv715. - DOI - PubMed
    1. Arnold S.J., Robertson E.J. Making a commitment: cell lineage allocation and axis patterning in the early mouse embryo. Nat. Rev. Mol. Cell Biol. 2009;10:91–103. doi: 10.1038/nrm2618. - DOI - PubMed
    1. Arora S., Morgan M., Carlson M., Pagès H. 2022. GenomeInfoDb: Utilities for manipulating chromosome names, including modifying them to follow a particular naming style.
    1. Bianchi D.W., Wilkins-Haug L.E., Enders A.C., Hay E.D. Origin of extraembryonic mesoderm in experimental animals: Relevance to chorionic mosaicism in humans. Am. J. Med. Genet. 1993;46:542–550. doi: 10.1002/ajmg.1320460517. - DOI - PubMed

Publication types