. 2022 Sep 1;185(18):3356-3374.e22.
doi: 10.1016/j.cell.2022.07.025.

Sublethal cytochrome c release generates drug-tolerant persister cells

Affiliations

Sublethal cytochrome c release generates drug-tolerant persister cells

Halime Kalkavan et al. Cell. .

Abstract

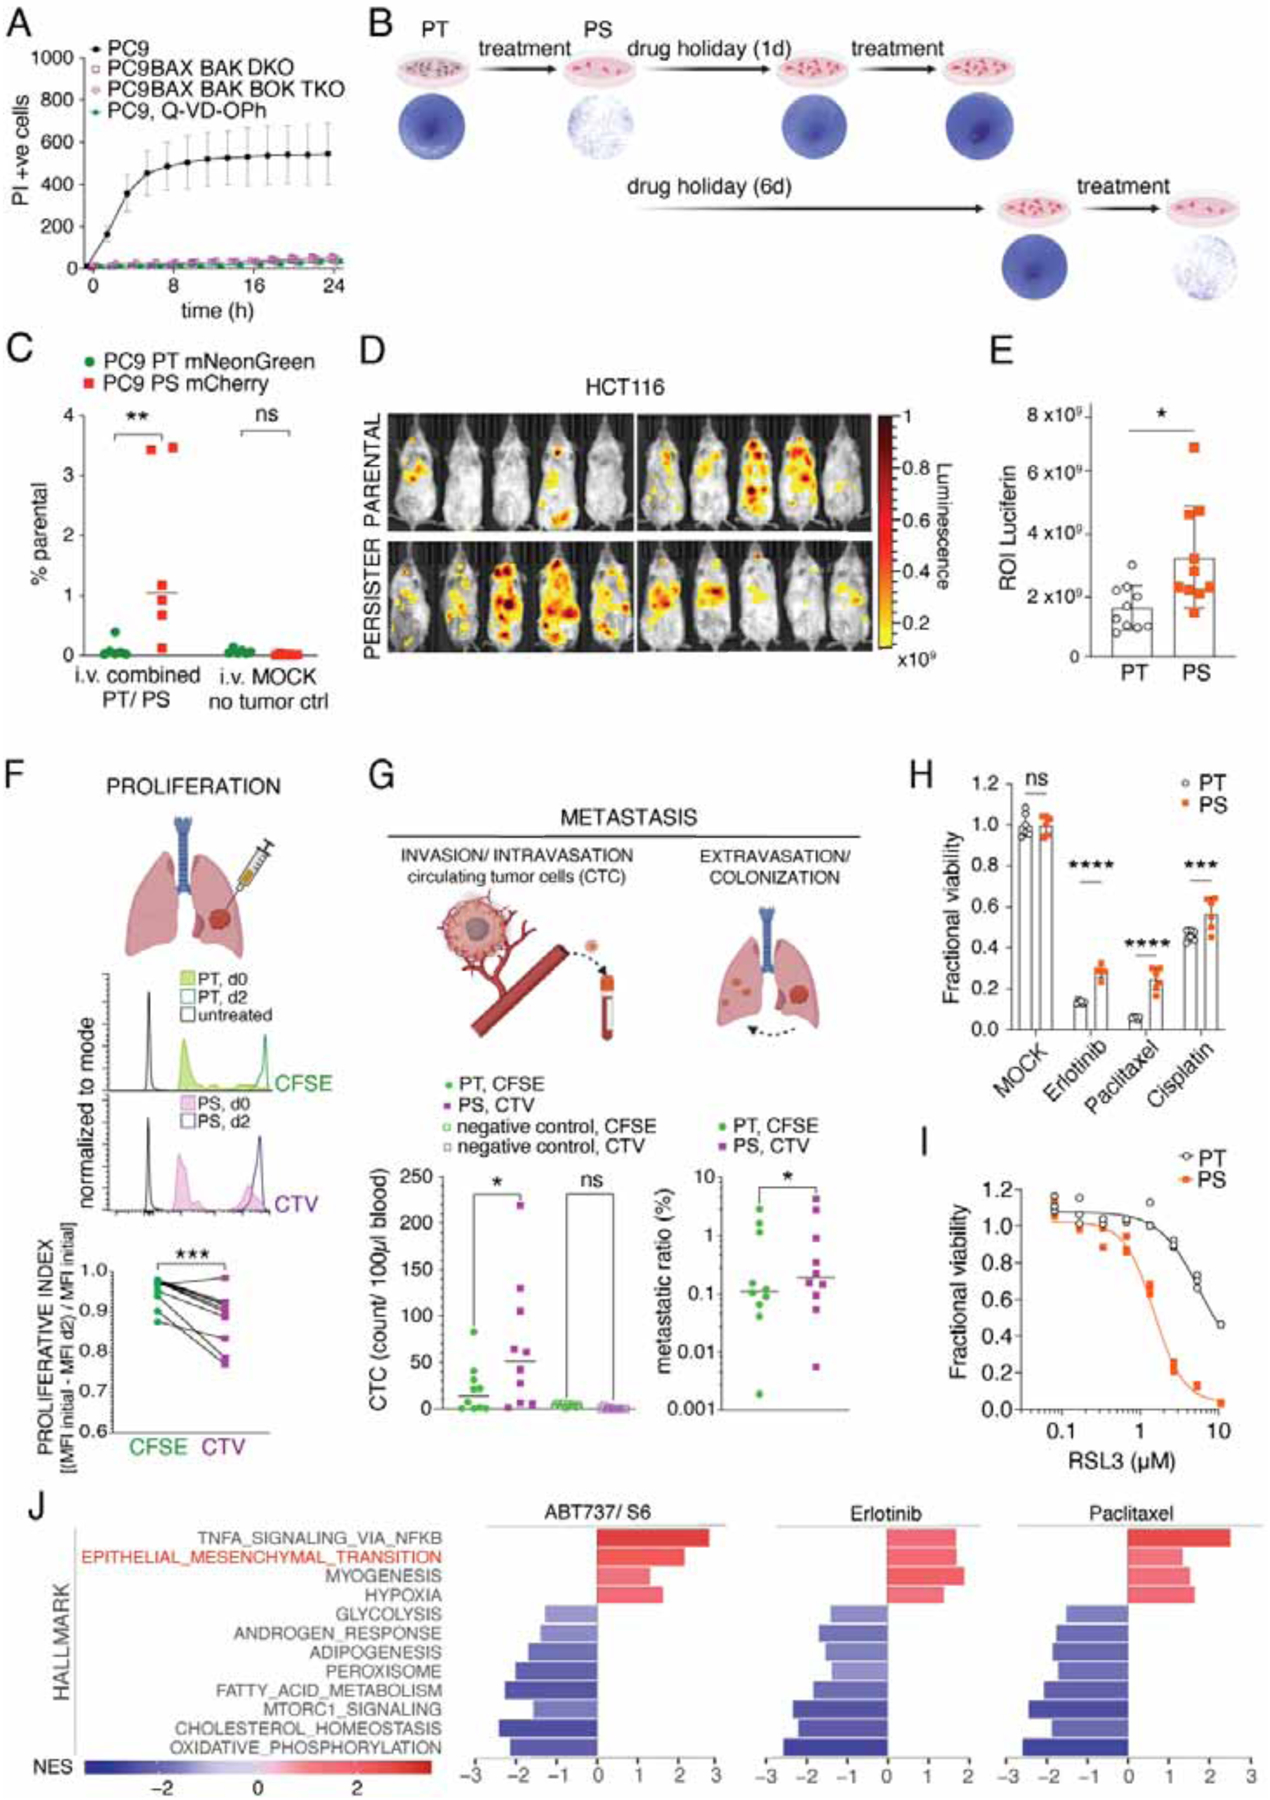
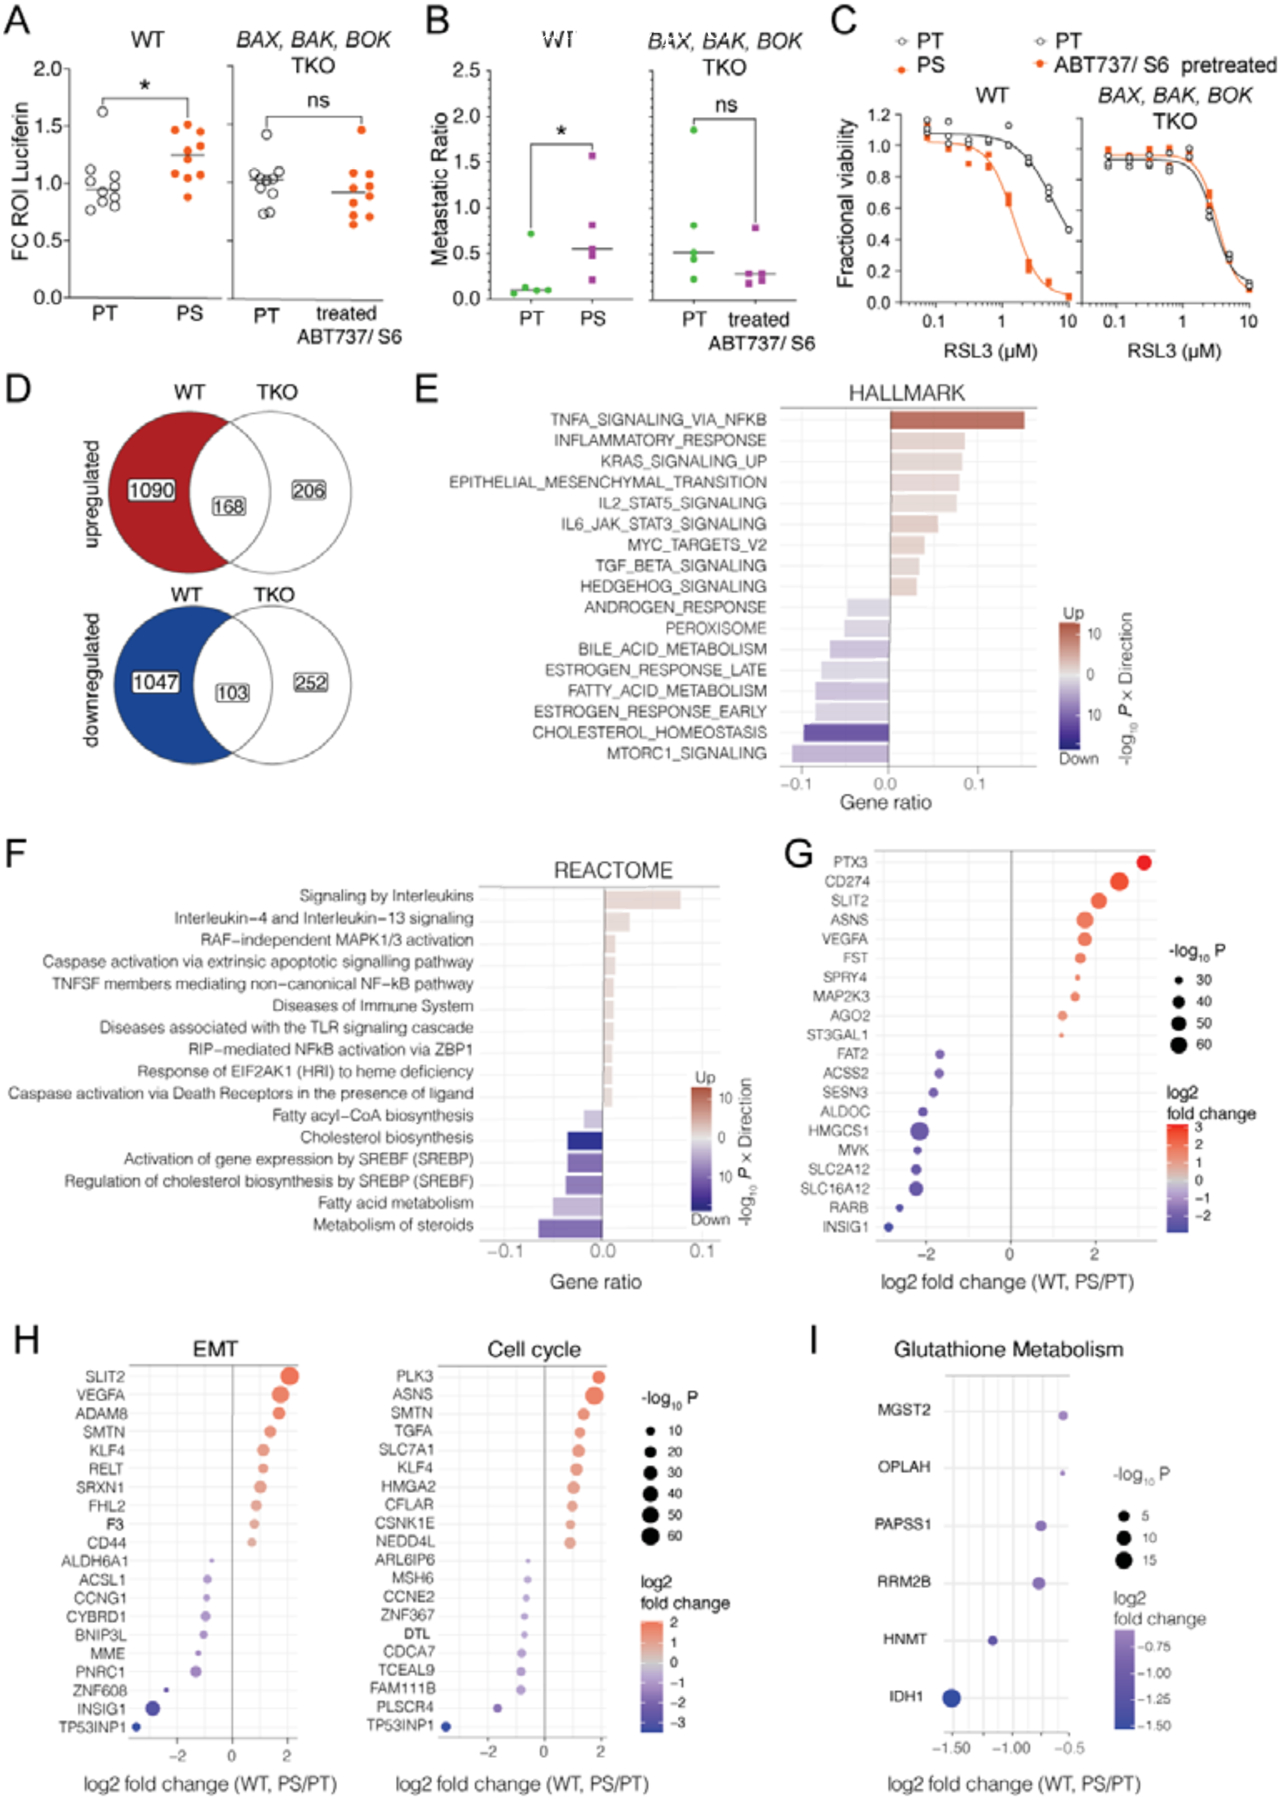
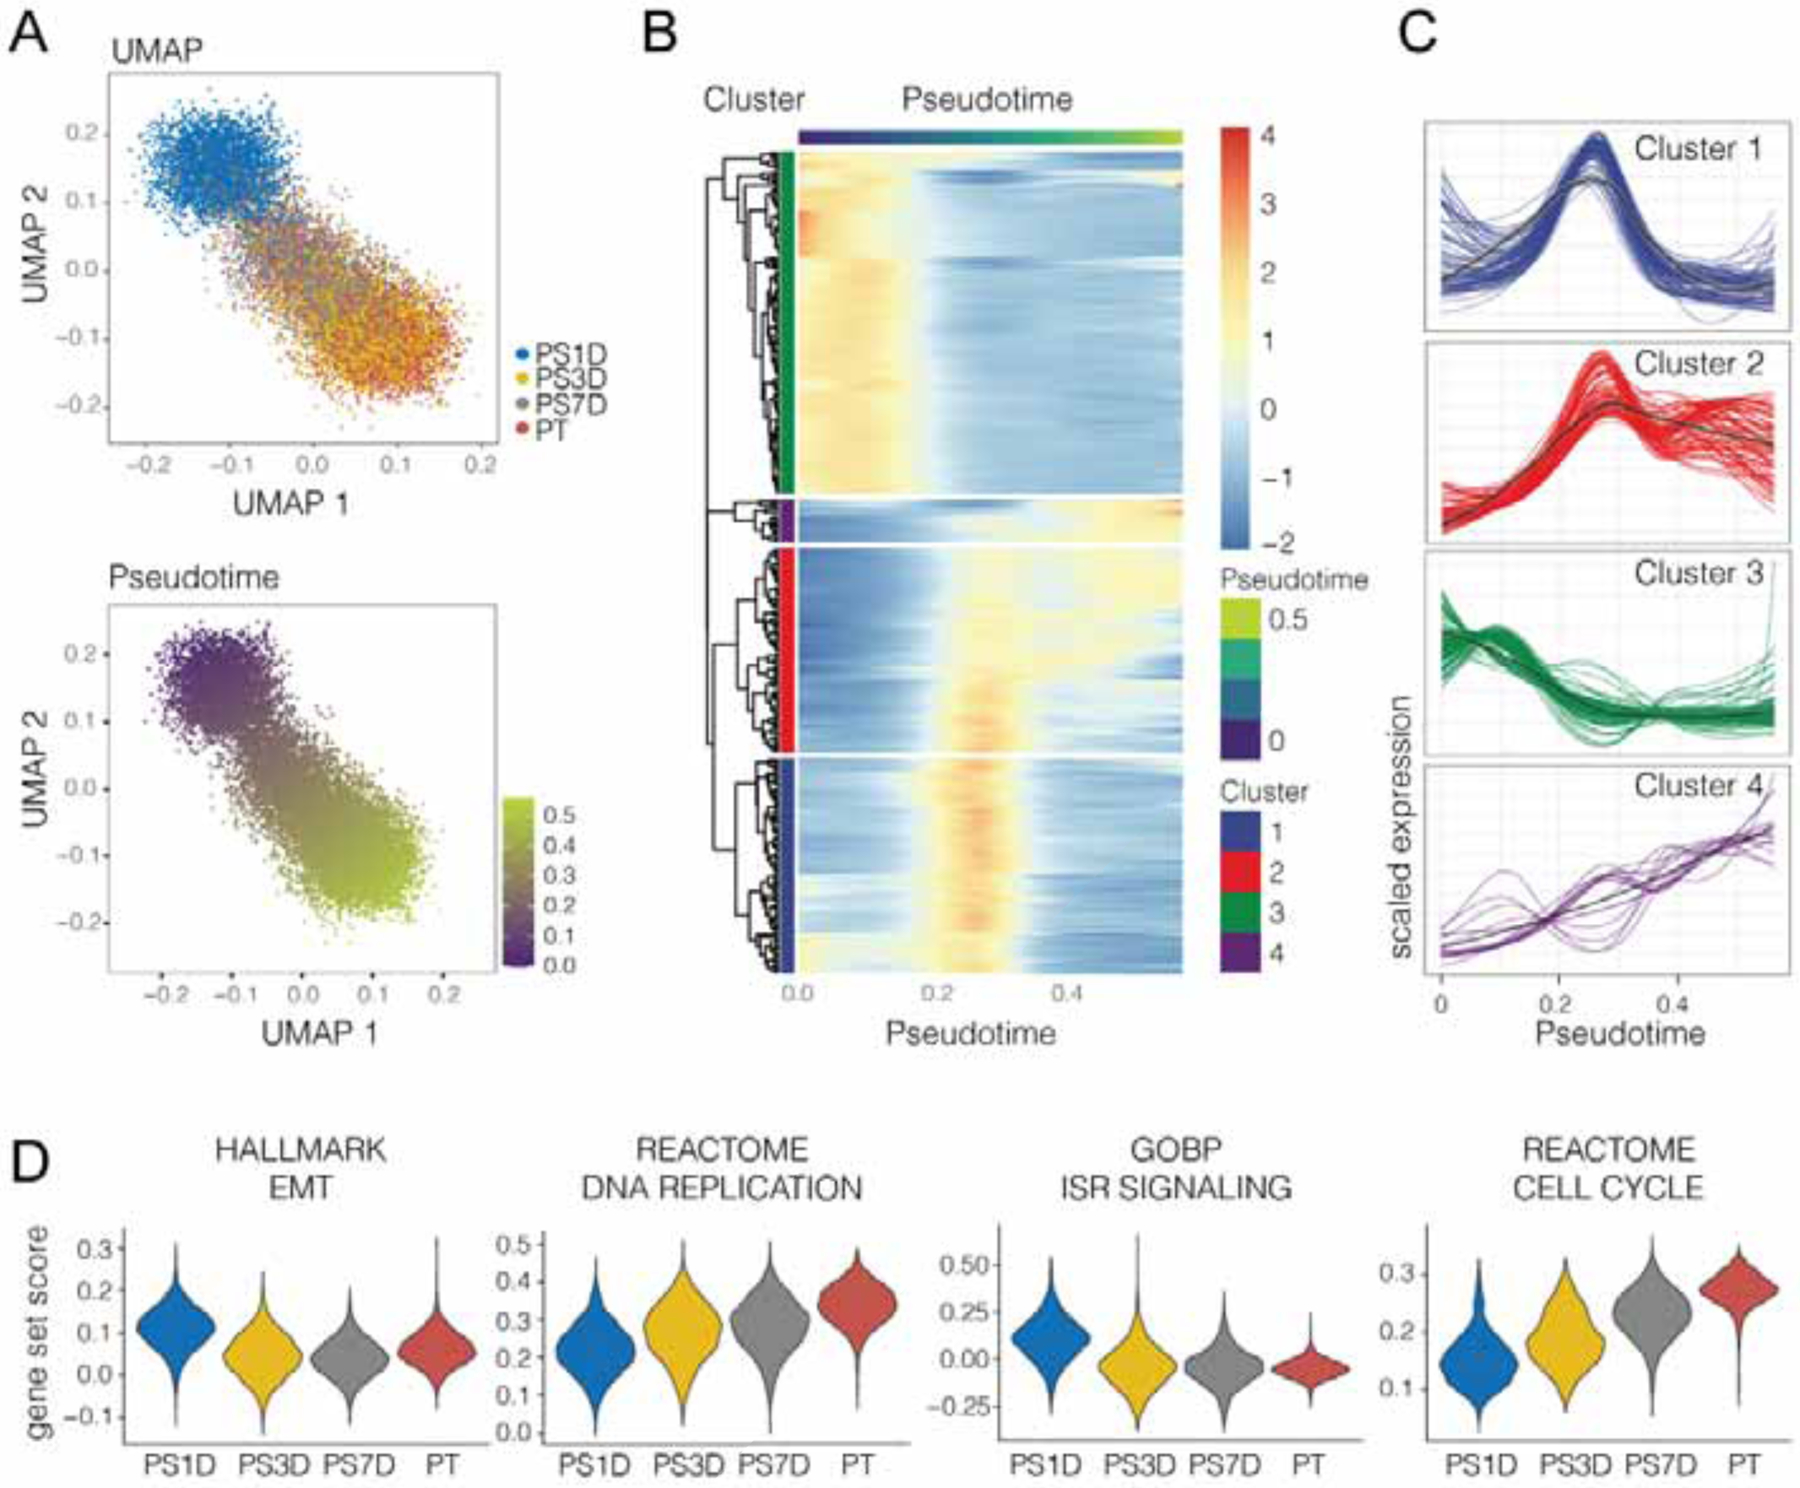
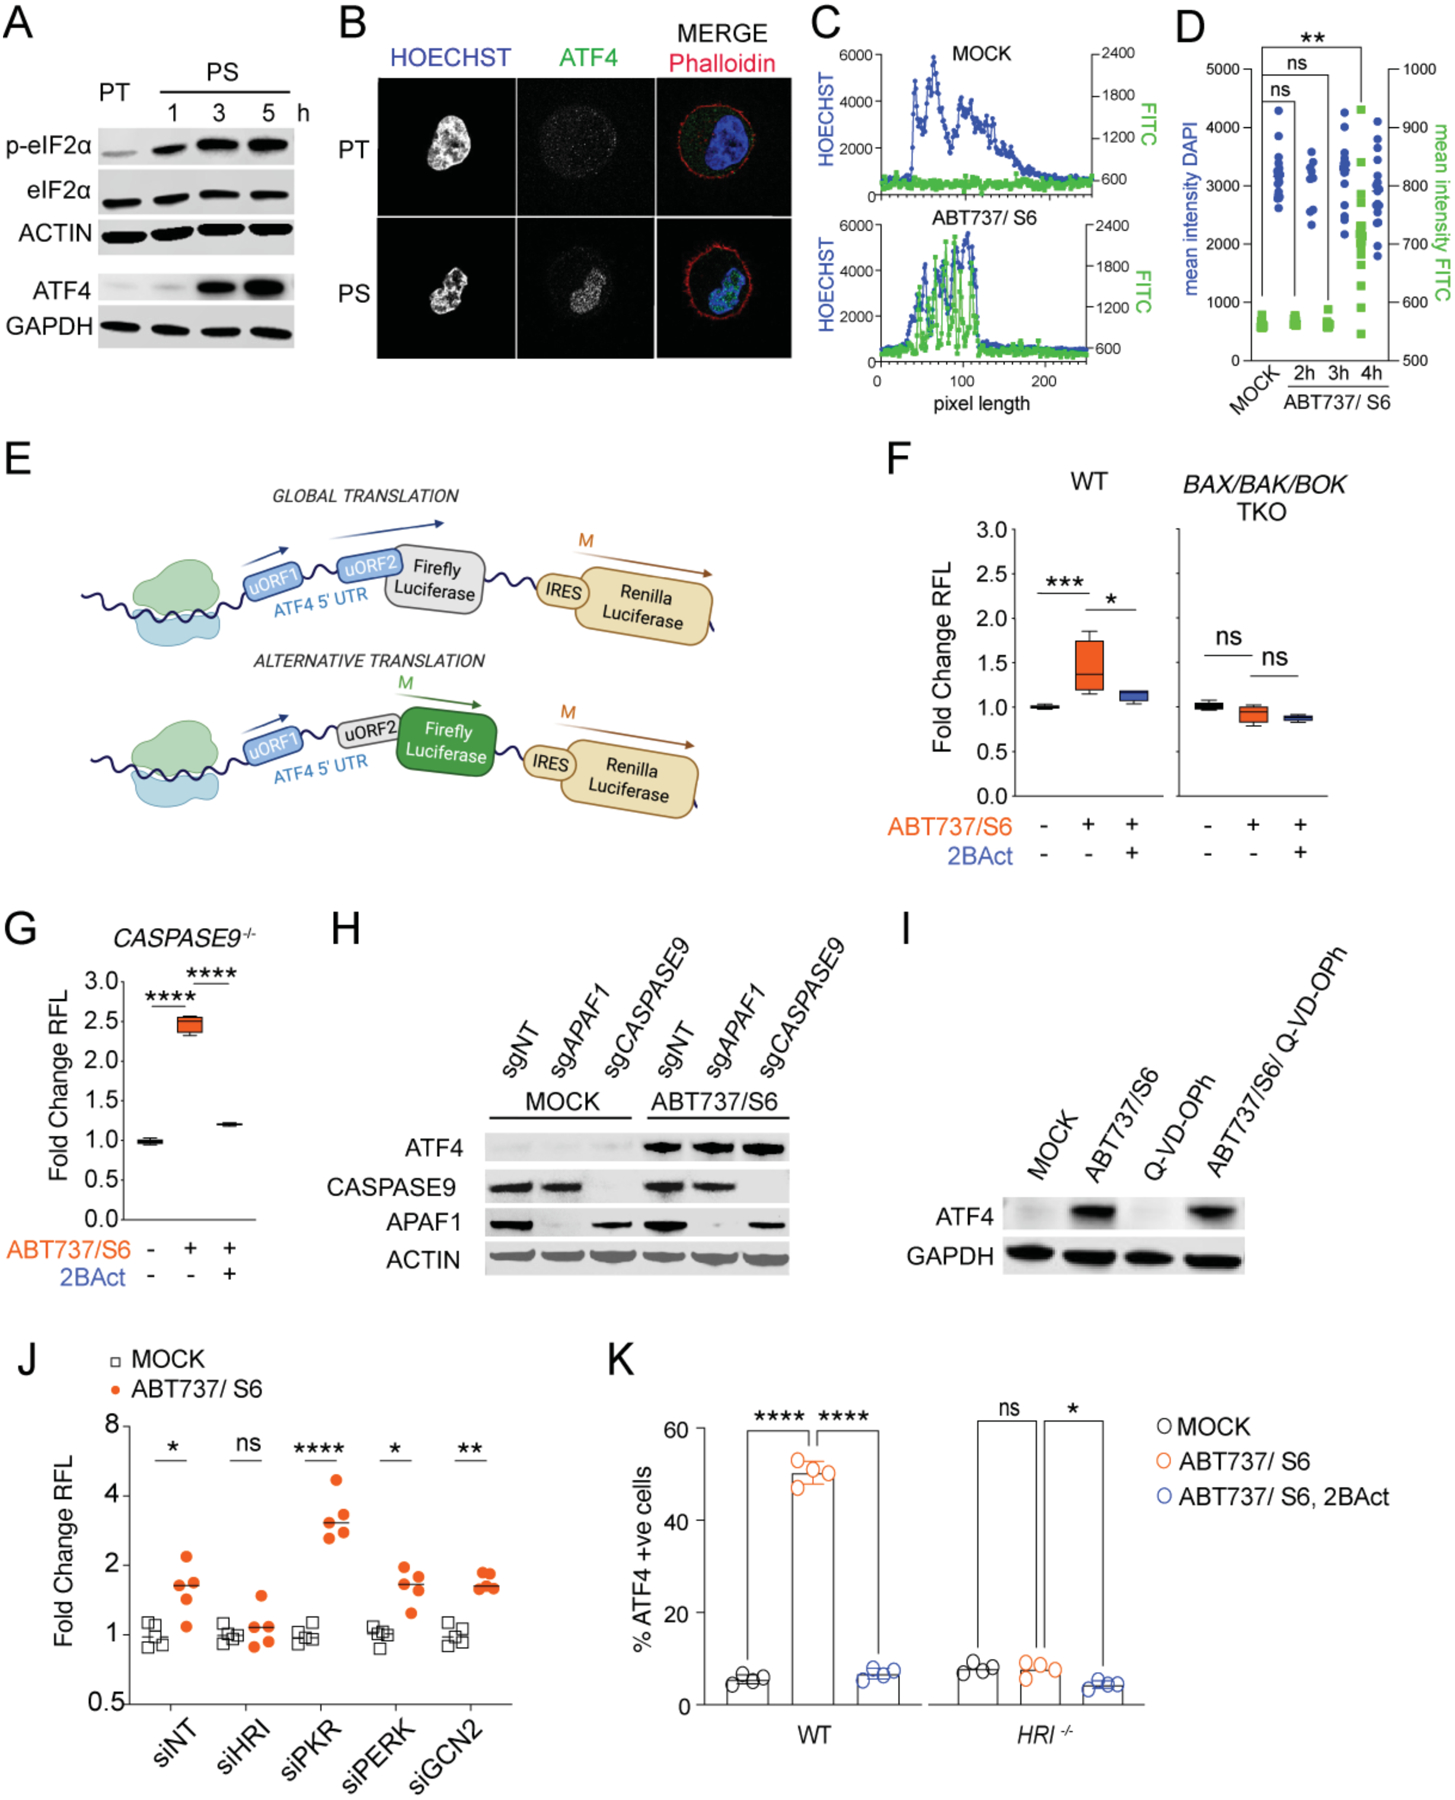
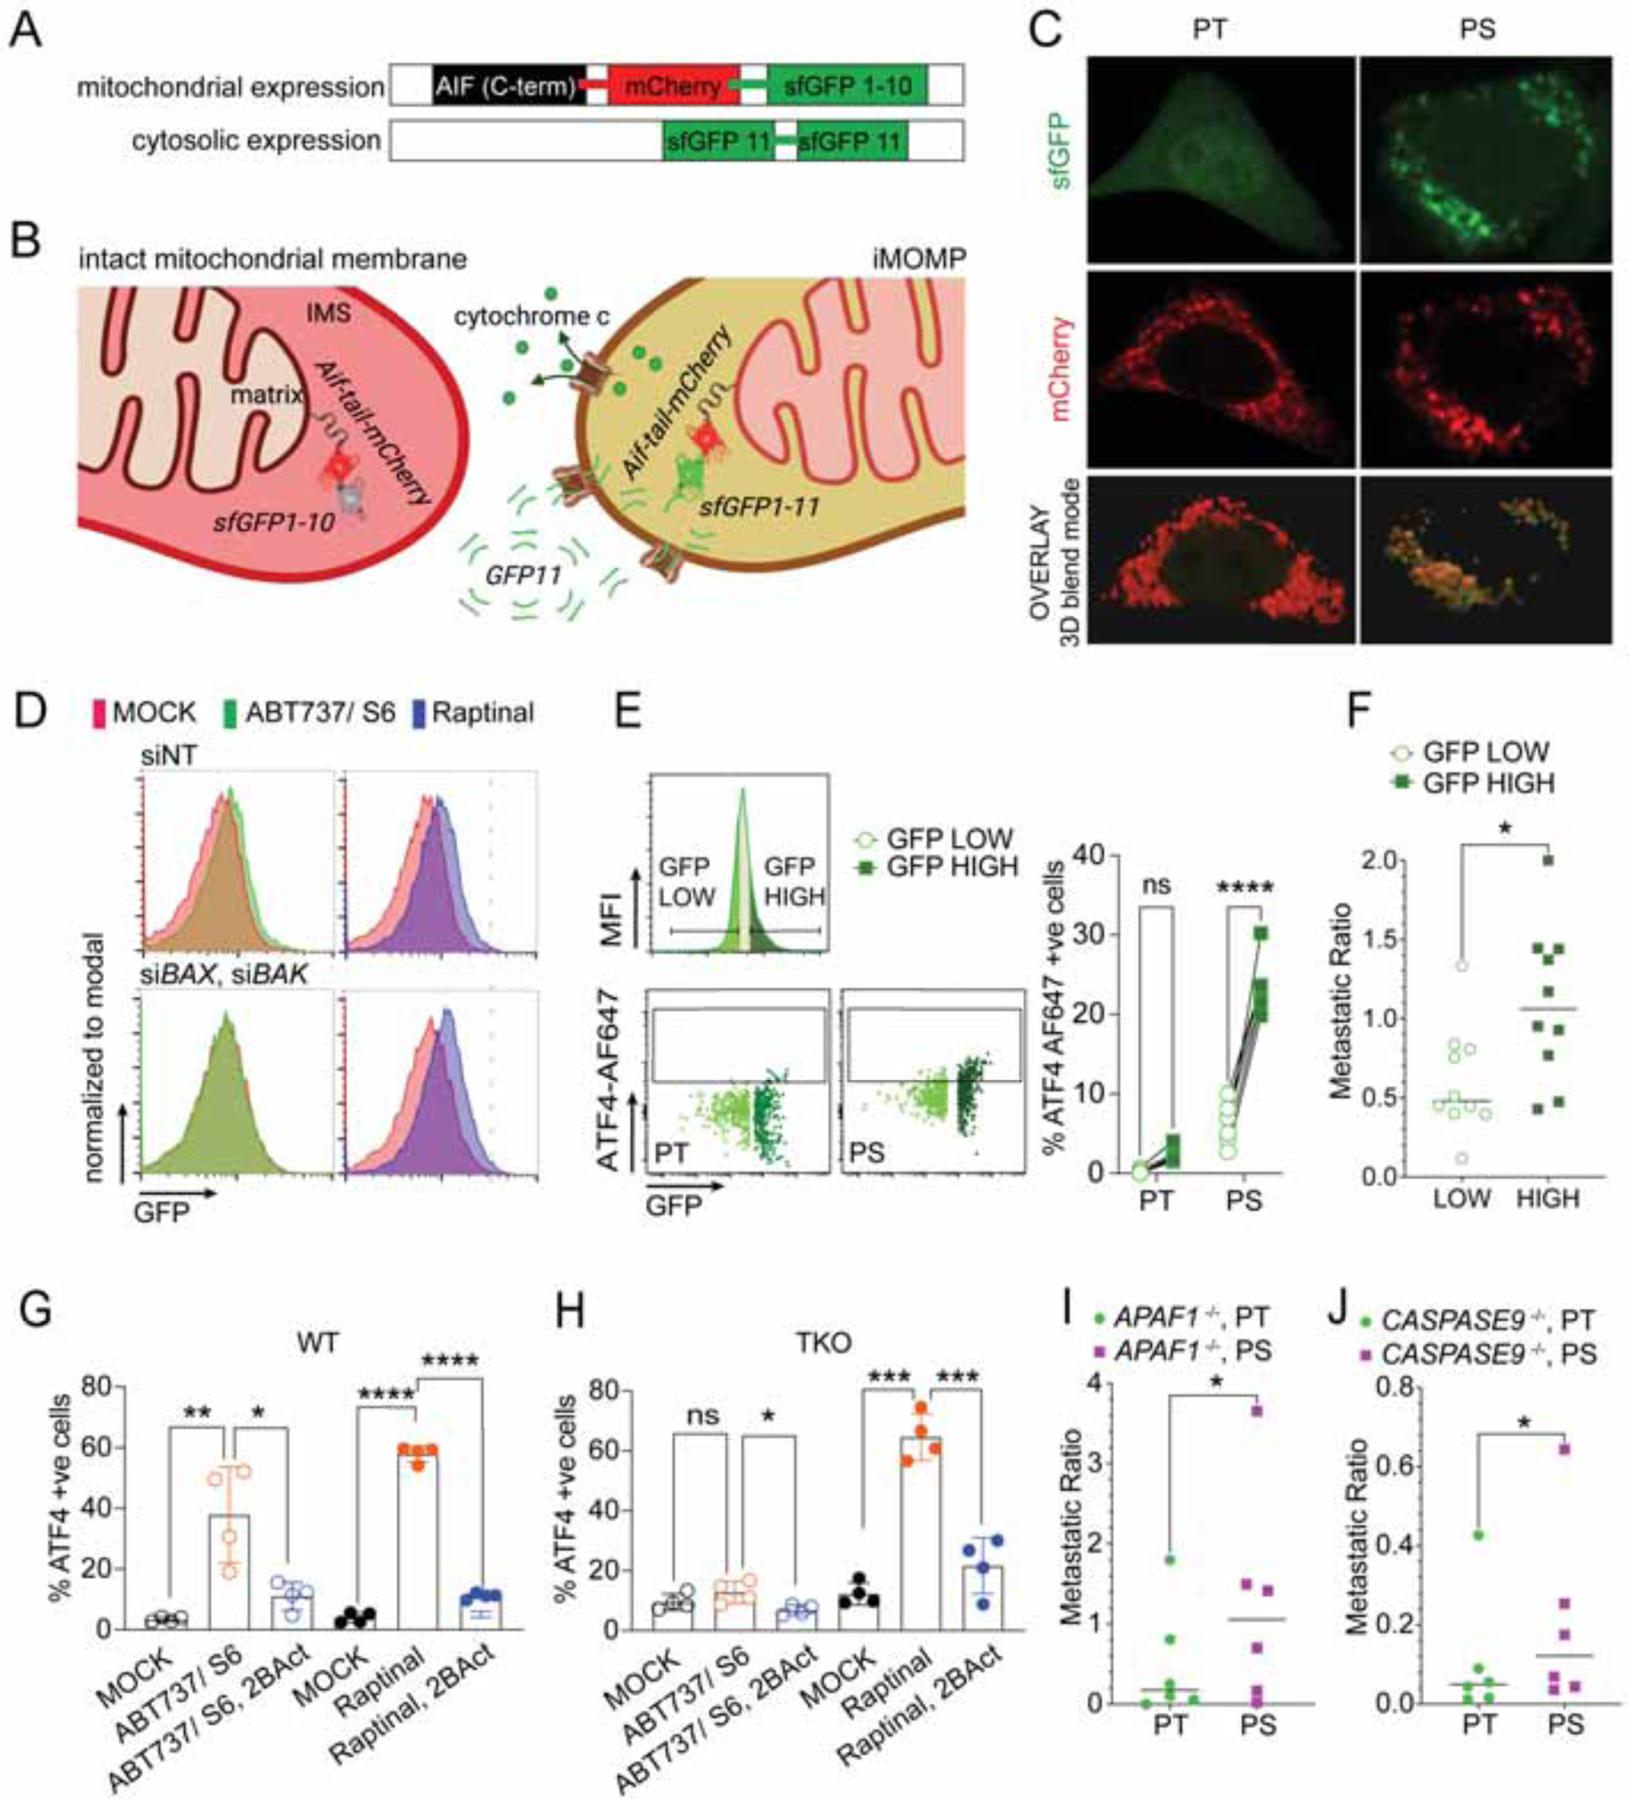
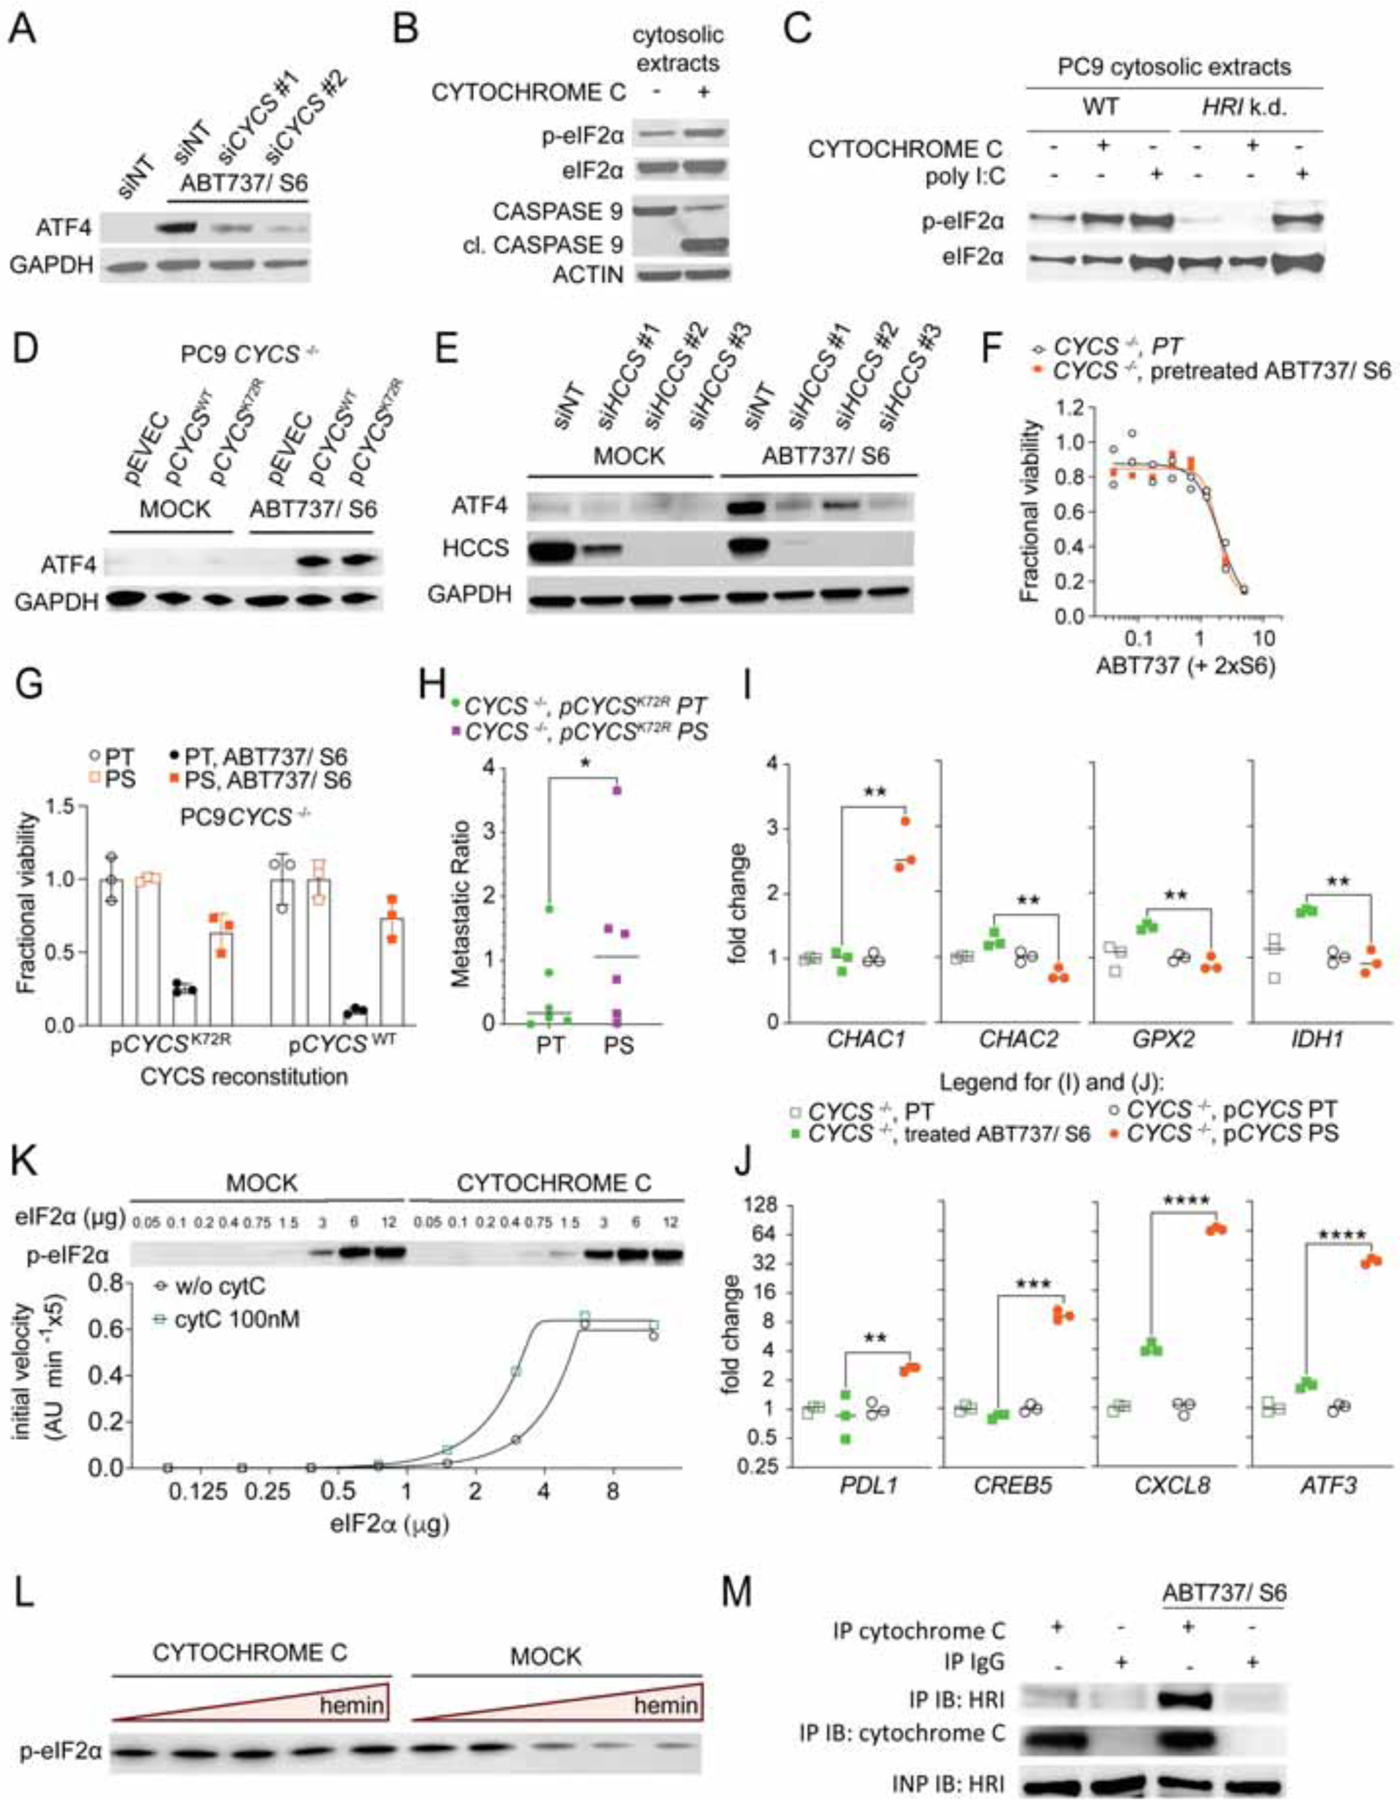
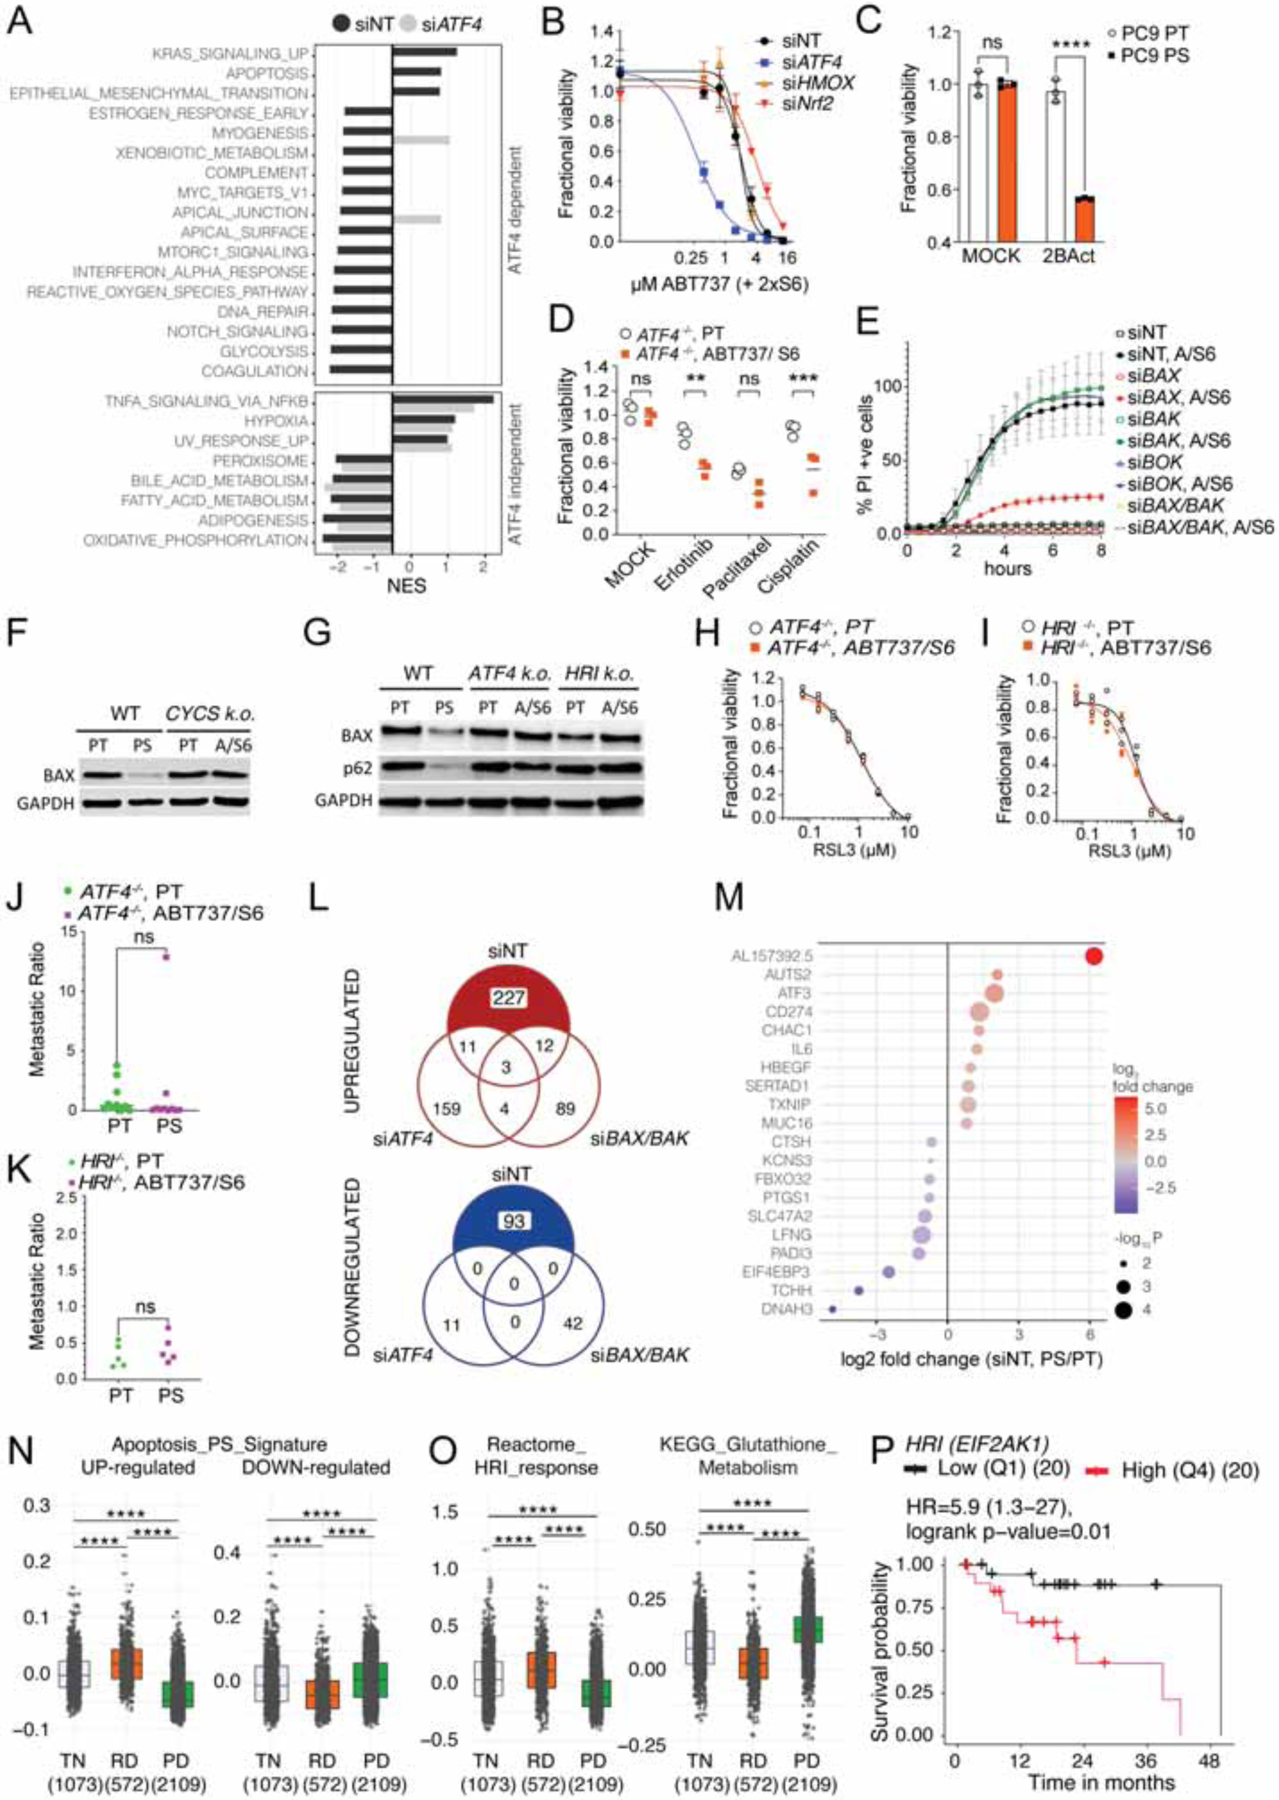
Drug-tolerant persister cells (persisters) evade apoptosis upon targeted and conventional cancer therapies and represent a major non-genetic barrier to effective cancer treatment. Here, we show that cells that survive treatment with pro-apoptotic BH3 mimetics display a persister phenotype that includes colonization and metastasis in vivo and increased sensitivity toward ferroptosis by GPX4 inhibition. We found that sublethal mitochondrial outer membrane permeabilization (MOMP) and holocytochrome c release are key requirements for the generation of the persister phenotype. The generation of persisters is independent of apoptosome formation and caspase activation, but instead, cytosolic cytochrome c induces the activation of heme-regulated inhibitor (HRI) kinase and engagement of the integrated stress response (ISR) with the consequent synthesis of ATF4, all of which are required for the persister phenotype. Our results reveal that sublethal cytochrome c release couples sublethal MOMP to caspase-independent initiation of an ATF4-dependent, drug-tolerant persister phenotype.

Keywords: ATF4; Bcl-2 family; GPX4; HRI; ferroptosis; persister integrated stress response.


Conflict of interest statement

Declaration of interests D.R.G. consults for Ventus Therapeutics, Inzen Therapeutics, and Horizon Therapeutics.

Figures

Figure 1.
Figure 1.. Targeting anti-apoptotic Bcl-2 proteins induces persister cells
(A) IncuCyte quantification during treatment with 1.5μM ABT737 and 3μM S6 of PC9 WT, PC9 BAX- and BAK-knockout (DKO), PC9 BAX, BAK, BOK TKO cells and PC9 WT cells co-treated with 40μM Q-VD-OPh (mean ± s.d. of n=3 samples/group). (B) Clonogenic survival of cells treated or not with 1.5 μM ABT737 and 3μM S6 for 6h washed and replated, or treated and then re-seeded again after 1d or 6d and then retreated, washed, and released to growth. Representative of 3 independent experiments, n=3/group. (C) Flow analysis of mNeonGreen positive PT or mCherry positive PS, from lungs of NSG mice 3 months after combined tail vein injection; n=6 lungs/group. MOCK, lungs without tumor injection. (D) Intravital images and (E) ROI quantification of luciferase activity 3 weeks after injection of either PT or PS firefly-luciferase-expressing HCT116 cells (n=10 mice, mean ± s.d.). Representative of 2 independent experiments. (F) Flow analysis of CFSE-labelled PT and CTV-labelled PS. Representative histograms on day 0 before injection and 48h after injection into left apical lungs of NSG mice. Proliferative index calculated by CFSE or CTV MFI signal loss from initial measurement to d2 (n=10 lungs/group, data from 2 pooled experiments). (G) Flow analysis of CFSE-labelled PT and CTV-labelled PS from RAG1−/− mice (n=10). Left: Quantification of circulating tumor cells from right heart ventricle blood 48h after injection. Right: Metastatic ratio representing the ratio between cells in contralateral lung and primary injection site for PT or PS cells, respectively. (H) Fractional viability of PC9 PT and PS treated with MOCK, Erlotinib 5μM, Paclitaxel 1μM or Cisplatin 10μM for 3d. N=6 samples/group. (I) Fractional viability of PC9 PT and PS treated with RSL3 for 3d. N=3 samples/group. (J) Hallmark pathways enriched across treatment regimens. Enriched pathways were defined as false discovery rate (FDR) <0.05. Normalized enrichment scores (NES) are shown. PS were generated by treatment with ABT737 1.5μM and S6 3μM for 6h, or Erlotinib 5μM for 3d or Paclitaxel 0.5μM for 3d. Statistical analysis by 2-way ANOVA (C, G left, H), unpaired student’s t-test (E), paired student’s t-test (F and G, right) respectively. *P <0.05; **P <0.01; ***P <0.001; ****P <0.0001. See also Figure S1.
Figure 2.
Figure 2.. The persister phenotype depends largely on Bcl-2 effectors
(A) Luciferase activity 2d after injection of firefly luciferase-expressing PT versus PS WT or BAX, BAK, BOK TKO PC9 cells (n=10 mice/group, pooled from 2 independent experiments). All values are standardized to parental values within each experiment =1. (B) Metastatic ratio of CFSE-labelled PT or CTV-labelled PS from PC9 WT or BAX, BAK, BOK TKO PC9 cells. N=5 mice/group (source data for WT from same experiment as Figure 1F). (C) Fractional viability measured after 3d RSL3 treatment of PT and PS from WT or BAX, BAK, BOK TKO PC9 cells. Representative of 5 independent experiments shown, n=3 samples/group. (D) Venn-Diagrams illustrating the number of differentially expressed genes (DEGs) in WT (PS/PT) but not in BAX, BAK, BOK TKO (ABT737, S6 treated/MOCK) PC9 cells. The 1090 DEGs that were only upregulated in WT but not in TKO cells (red) and the 1047 DEGs that were only downregulated in WT but not TKO cells (blue) were further analyzed (E to I). (E) Enrichment analysis of Hallmark and (F) Reactome pathways shown as gene ratios of DEGs in WT (PS/PT) but not in BAX, BAK, BOK TKO (treated/MOCK) PC9 cells. The red bars show the genes up-regulated in PS and the blue down-regulated in PS. Enriched gene sets with adjusted p-value <0.05 are shown. (G-I) Top 10 up- and downregulated DEGs in WT (PS/PT) but not in BAX, BAK, BOK TKO (treated/MOCK) PC9 cells. (source data as in E and F). (D-I) DEGs have been defined as FC >1.5 and p-value <0.05. The gene sets were defined as a collection of gene sets in public databases. Statistical analysis by unpaired student’s t-test (A) or paired student’s t-test (B). *P <0.05. See also Figure S2.
Figure 3.
Figure 3.. Transcriptomic trajectory analysis reveals transient ISR expression profile in BH3-mimetic persisters
(A) UMAP (upper) and Pseudotime (lower) single cell trajectories of PC9 PT and PS cells harvested after drug holiday of 1 day (PS1D), 3 days (PS3D) or 7 days (PS7D) and subjected to single cell RNAseq. The pseudotime was estimated using the Singleshot R package. (B) Heatmap of differentially expressed genes along pseudotime (299 genes) identified using the tradeSeq R package. The expression was scaled and centered by gene, and the genes were clustered into four groups using hierarchical clustering. (C) Scaled expression profiles of gene clusters along pseudotime. (D) Violin plots visualizing gene set scores of selected gene sets. See also Figure S2.
Figure 4.
Figure 4.. BH3 mimetics induce an ISR, dependent on Bcl-2 effectors but independent of caspase activation
(A) Immunoblot with the indicated antibodies of PC9 PT and PS, generated by treatment with ABT737 1.5μM and S6 3μM for the indicated times. (B) Confocal microscopy images of PC9 PT and PS after 4h treatment with ABT737 and S6. Cells were stained for Hoechst (blue), ATF4 (green) and Phalloidin (red). (C) Fluorescence intensity of immunofluorescence from (B) measured in one dimension across the cell through the nucleus. One representative of n=19 PT and n= 18 PS measurements shown. (D) Mean intensity of immunofluorescence from (B) measured within the nuclear area in PT (n=19) and PS after 2h (n=9), 3h (n=15) or 4h (n=18) treatment. Dots indicate individual cells. (E) Schematic representation of the luciferase-expressing ATF4 translation reporter construct and its activation under alternative translation conditions. (F) Luciferase activity assay from (E) showing normalized firefly luciferase activity in PC9 WT and BAX, BAK, BOK TKO cells treated with ABT737 1μM and S6 2μM ± 2Bact 20μM. Data is shown as fold change of RFL compared to MOCK control (mean ± s.d. of n=3 samples/group). (G) Same as (F) in CASPASE9 KO PC9 cells (mean ± s.d. of n=3 samples/group). (H) Immunoblot of endogenous ATF4, APAF1 and CASPASE9 in PC9 cells after transient expression of Cas9 and either sgNT, sgAPAF1 or sgCASPASE9. Cells were treated with ABT737 1μM and S6 2μM for 6h. (I) Immunoblot of endogenous ATF4 in PC9 cells after treatment with ABT737 1μM and S6 2μM and QVD-OPh 10μM. (J) Luciferase activity assay showing normalized firefly luciferase activity in PC9 cells expressing luciferase ATF4 translation reporter. Cells were silenced with siNT or siRNA for each of the EIF2α- kinases indicated and treated ± ABT737 1μM and S6 2μM for 6h. n=5 samples/group. (K) Flow analysis of nuclear ATF4 after MOCK or ABT737 1.5μM and S6 3μM ± 2BAct 50μM treatment for 4h in WT or HRI−/− cells. N=4 samples/group. Statistical analysis by unpaired student’s t-test (D) or 2-way ANOVA (F, G, J and K). *P <0.05; **P <0.01; ***P <0.001; ****P <0.0001. See also Figure S3.
Figure 5.
Figure 5.. Engagement of sublethal MOMP is crucial for ISR activation
(A) Schematic representation of the mitochondrial and cytosolic expression system for the MOMP sensor and (B) its function upon MOMP. (C) Confocal microscopy images of A549 PT and PS expressing the MOMP sensor system. PS were generated by 6h treatment with ABT737 1.5μM and S6 3μM and then released overnight before imaging. 3D blend mode image was generated with IMARIS. (D) Flow analysis of A549 cells expressing the MOMP sensor. Cells were transfected with either non-targeted (siNT) or BAX and BAK targeting siRNA (siBAX, siBAX) and treated with MOCK, ABT737 5μM and S6 10μM or Raptinal 5μM. Representative histograms from n=3 samples/group are shown. (E) Fow analysis of A549 PT and PS expressing the iMOMP sensor. Left upper panel: representative histogram showing strategy of gating GFP high (25%) and low (25%) cells. Left lower panels: dot plots showing cytosolic ATF4 and GFP in the two stratified groups. Right panel: quantitation of ATF4 positive cells in PT or PS, GFP high and GFP low cells. N=6 samples/group. One representative of 2 independent experiments shown. (F) Metastatic ratio representing the ratio between cells from the contralateral lung and primary injection site. Analysis of CTV-labelled PS from NSG mice was performed 2d after intrapulmonal injection of either GFP-high or GFP-low sorted PS cells respectively (n=10 mice/group). (G-H) Flow analysis of nuclear ATF4 after MOCK or ABT737 1.5μM and S6 3μM or Raptinal 5μM ± 2BAct 50μM treatment for 4h in WT (G) or BAX, BAK, BOK TKO cells (H). Mean ± s.d. of n=4 samples/group are shown. (I, J) Metastatic ratios between cells from the contralateral lung and primary injection site. Analysis of CFSE-labelled PT and CTV-labelled PS from APAF1−/− (I) or CASP9−/− (J) PC9 cells was performed 2d after intrapulmonal combined injection (n=6 mice/group). Statistical analysis was performed using unpaired student’s t-test (F), 2-way ANOVA (E, G and H) or paired student’s t-test (I and J). *P <0.05; **P <0.01; ***P <0.001; ****P <0.0001. See also Figure S3.
Figure 6.
Figure 6.. Cytochrome c activates HRI and engages the persister phenotype
(A) Immunoblot with the indicated antibodies of PC9 cells that had been transfected with non-targeting (siNT) or 2 different CYCS targeting siRNAs, and treated ± ABT737 1.5μM and S6 3μM for 4h. All samples were treated with Q-VD-OPh 20μM. (B) Immunoblot of cytosolic extracts from PC9 cells treated ± 100nM bovine Cytochrome c for 30min in the presence of 50μM ATP. (C) Immunoblot of cytosolic extracts from PC9 WT and HRI-silenced cells treated ± 100nM bovine Cytochrome c or 10μg/ml poly I:C for 30 min in the presence of 50μM ATP. (D) Immunoblot with the indicated antibodies of PC9 CYCS −/− cells, reconstituted ± WT or K72R mutant CYCS and treated ± ABT737 1.5μM and S6 3μM for 4h. All samples were treated with Q-VD-OPh 20μM. (E) Immunoblot with the indicated antibodies of PC9 cells that had been transfected with non-targeting (siNT) or different HCCS-targeting siRNAs and treated ± ABT737 1.5μM and S6 3μM for 4h. All samples were treated with Q-VD-Oph 20μM. (F) Fractional viability of PT and BH3-mimetic survivors generated from PC9 CYCS−/− cells treated with a titration of ABT737 and S6. Mean ± s.d. of 3 samples. One representative of n=2 independent experiments shown. (G) Fractional viability of PT and PS generated from PC9 CYCS−/− cells, reconstituted ± WT or K72R mutant CYCS and treated ± ABT737 1.5μM and S6 3μM. One representative of n=2 independent experiments shown. (H) Metastatic ratio of PT and PS generated from PC9 CYCS−/− cells that had been reconstituted with CYCS K72R mutant (n=6 mice/group). Statistical analysis by paired student’s t-test. *P <0.05. (I) and (J) qPCR analysis of transcripts involved in glutathione metabolism (I) or diverse transcripts that have been identified as BCL2 effector protein dependent (J) of PT and PS generated from PC9 CYCS−/− cells, reconstituted ± WT CYCS. N=3 samples are shown. Statistical analysis was performed using unpaired student’s t-test. **P <0.01, ***P <0.001; ****P <0.0001. (K) Immunoblot and HRI enzyme kinetics in the presence or absence of Cytochrome c 100nm with recombinant proteins. One representative fitting curve from n=3 independent experiments shown. (L) Immunoblot of in vitro kinase reaction with recombinant eIF2α and HRI, in the presence or absence of Cytochrome c and ± hemin titration (from 2μM max. to 3nM min., 1:5 dilutions in kinase buffer). (M) Immunoprecipitation of endogenous Cytochrome c or IgG (negative control) from APAF1 KO PC9 cells treated ± ABT737 and S6. See also Figures S4 and S5.
Figure 7.
Figure 7.. Cytochrome c – HRI – ATF4 axis drives the phenotype of persistence
(A) Cancer hallmarks pathway analysis in BH3-mimetic treated versus untreated cells significantly changed in siNT (PS/PT) but not siATF4 (ABT737, S6 treated/MOCK) PC9 cells. (B) Fractional viability of PC9 cells that had been transfected with siNT, siATF4, siHMOX1 or siNRF2, and treated with a titration of ABT737 and S6. One representative of 2 independent experiments shown. (C) Fractional viability of PC9 PT and PS that had been treated with 50μM of 2BAct. N=3 samples/group. (D) Fractional viability of PT and BH3-mimetic survivors that were generated from ATF4−/− cells, and had been treated with MOCK, Erlotinib 5μM, Paclitaxel 1μM or Cisplatin 10μM for 3d. N=3 samples/group. (E) IncuCyte quantification during treatment with ABT737 (1.5μM) and S6 (3μM) of PC9 cells transfected with siNT, siBAX, siBAK, siBOK or a combination of siBAX and siBAK WT. Data are mean ± s.d. of n=3 samples/group. One representative of 3 independent experiments is shown. (F) Immunoblot of BAX in WT and CYCS KO cells treated ± ABT737 and S6. (G) Immunoblot of BAX in WT and ATF4 KO and HRI KO cells treated ± ABT737 and S6. (H) Fractional viability of PT and BH3-mimetic survivors generated from PC9 ATF4−/− cells treated with a titration of RSL3. One representative of 7 independent experiments shown. (I) Fractional viability of PT and BH3-mimetic survivors generated from PC9 HRI−/− cells treated with titration of RSL3. One representative of 6 independent experiments shown. (J) Metastatic ratio of PT and BH3-mimetic survivors generated from PC9 ATF4−/− (n=10 mice/group). (K) Metastatic ratio of PT and BH3-mimetic survivors generated from PC9 HRI−/− (n=5 mice/group), (same experiment as Figure 1E). (L) Venn-Diagrams illustrating the number of differentially expressed genes (DEGs) in siNT (PS/PT), siATF4 (ABT737, S6 treated/MOCK) or siBAX/BAK (ABT737, S6 treated/MOCK) PC9 cells. Numbers of up- and down-regulated genes are shown. (M) DEGs dependent on ATF4 and BAX, BAK. Top 10 genes from 227 up- and 93 down-regulated DEGs that are significantly changed in siNT- but not siATF4- or siBAX/BAK-silenced cells are depicted. (N) Gene set score for an apoptosis signature generated with DEGs in PS and not PT that are dependent on ATF4 and BAX, BAK (see also M), that are up- or down-regulated in human lung cancers from patients which were treatment-naïve (TN, n=1073 samples), had residual disease (RD, n=572 samples) or had progressive disease (PD, n=2109 samples). The published data set is from Maynard et al., 2020. (O) Gene set score for Reactome HRI response and KEGG Glutathione metabolism gene set that were up- or down-regulated in human lung cancers from the data set in (N). Statistical analysis was performed using t-test ****P <0.0001. (P) Kaplan Meier survival curve of patients with EGFR-mutant lung adenocarcinoma expressing high (4th quartile) or low (1st quartile) HRI from TCGA database lung adenocarcinoma (LUAD) cohort. Hazard ratio (HR) and p-value is indicated. N=20/group. Statistical analysis was performed using 2-way ANOVA (C and D) and paired student’s t-test (J and K). **P <0.01, ***P <0.001; ****P <0.0001. See also Figures S6 and S7.

Comment in

  • Persisting through apoptosis.
    Attwaters M. Attwaters M. Nat Rev Mol Cell Biol. 2022 Nov;23(11):697. doi: 10.1038/s41580-022-00544-0. Nat Rev Mol Cell Biol. 2022. PMID: 36131098 No abstract available.
  • Adaptation to MOMP drives cancer persistence.
    Guilbaud E, Galluzzi L. Guilbaud E, et al. Cell Res. 2023 Feb;33(2):93-94. doi: 10.1038/s41422-022-00729-4. Cell Res. 2023. PMID: 36163426 Free PMC article. No abstract available.

References

    1. Bauer BN, Rafie-Kolpin M, Lu L, Han A, and Chen J-J (2001). Multiple Autophosphorylation Is Essential for the Formation of the Active and Stable Homodimer of Heme-Regulated eIF2α Kinase †. Biochemistry-Us 40, 11543–11551. 10.1021/bi010983s. - DOI - PubMed
    1. B’chir W, Maurin A-C, Carraro V, Averous J, Jousse C, Muranishi Y, Parry L, Stepien G, Fafournoux P, and Bruhat A (2013). The eIF2α/ATF4 pathway is essential for stress-induced autophagy gene expression. Nucleic Acids Res 41, 7683–7699. 10.1093/nar/gkt563. - DOI - PMC - PubMed
    1. Berge K.V. den, Bézieux H.R. de, Street K, Saelens W, Cannoodt R, Saeys Y, Dudoit S, and Clement L (2020). Trajectory-based differential expression analysis for single-cell sequencing data. Nat Commun 11, 1201. 10.1038/s41467-020-14766-3. - DOI - PMC - PubMed
    1. Berlanga JJ, Herrero S, and Haro C. de (1998). Characterization of the Hemin-sensitive Eukaryotic Initiation Factor 2α Kinase from Mouse Nonerythroid Cells*. J Biol Chem 273, 32340–32346. 10.1074/jbc.273.48.32340. - DOI - PubMed
    1. Berthenet K, Ferrer C, Fanfone D, Popgeorgiev N, Neves D, Bertolino P, Gibert B, Hernandez-Vargas H, and Ichim G (2020). Failed Apoptosis Enhances Melanoma Cancer Cell Aggressiveness. Cell Reports 31, 107731. 10.1016/j.celrep.2020.107731. - DOI - PubMed

Publication types