. 2022 Sep 1;185(18):3390-3407.e18.
doi: 10.1016/j.cell.2022.07.026.

A serotonergic axon-cilium synapse drives nuclear signaling to alter chromatin accessibility

Affiliations

A serotonergic axon-cilium synapse drives nuclear signaling to alter chromatin accessibility

Shu-Hsien Sheu et al. Cell. .

Abstract

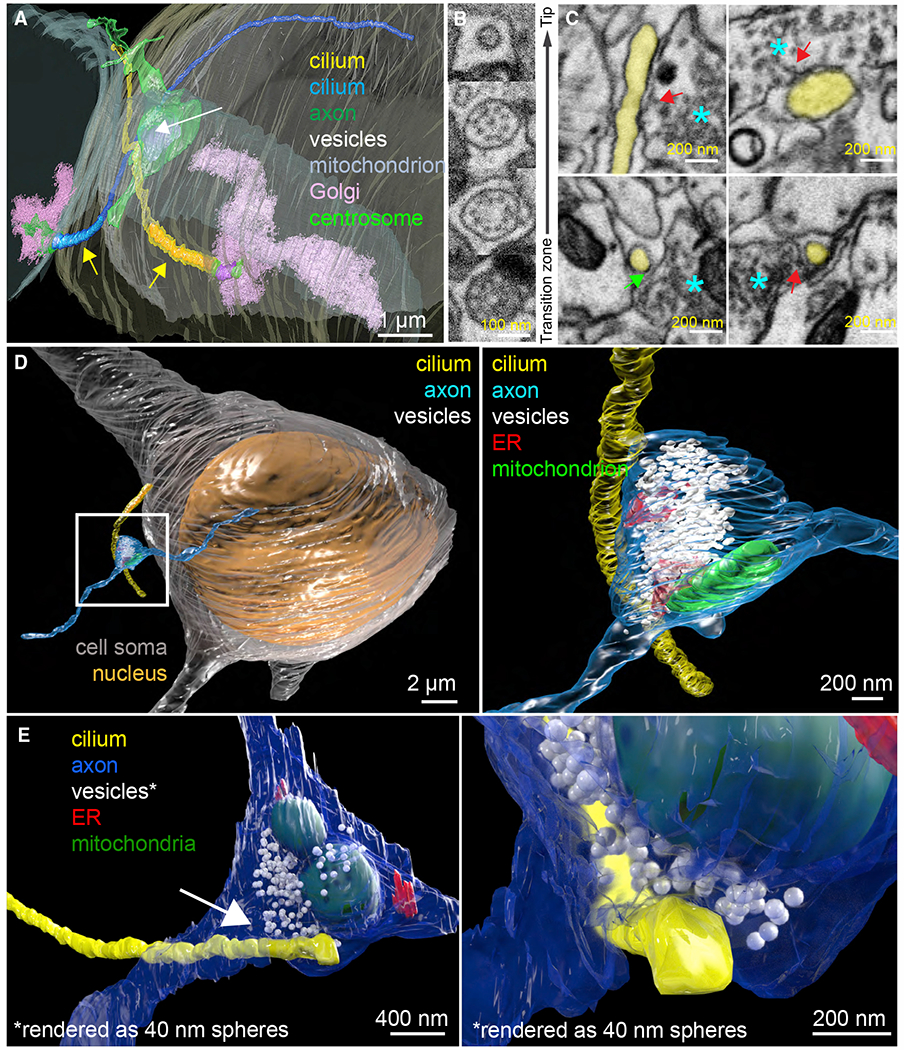
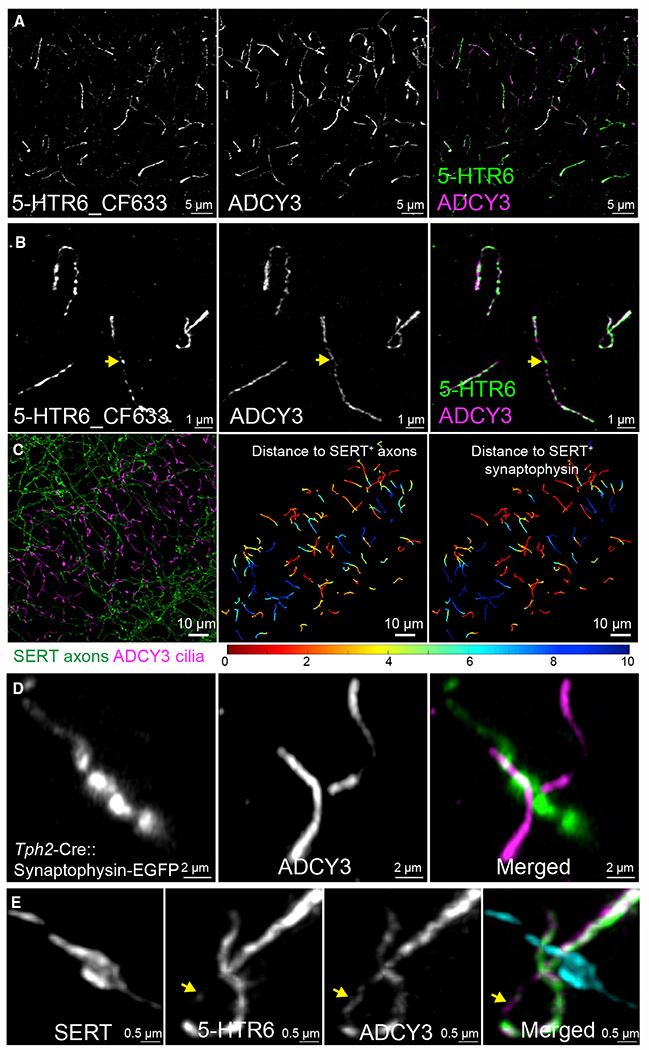
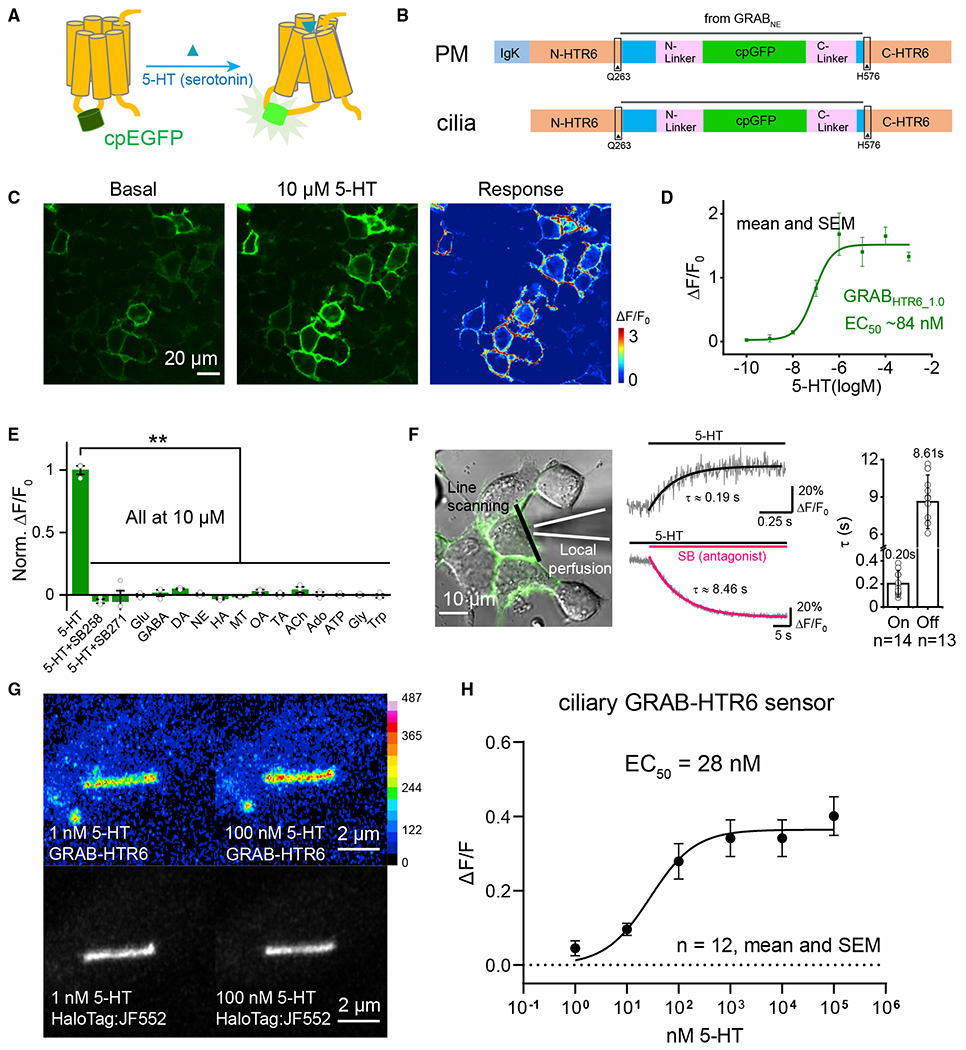
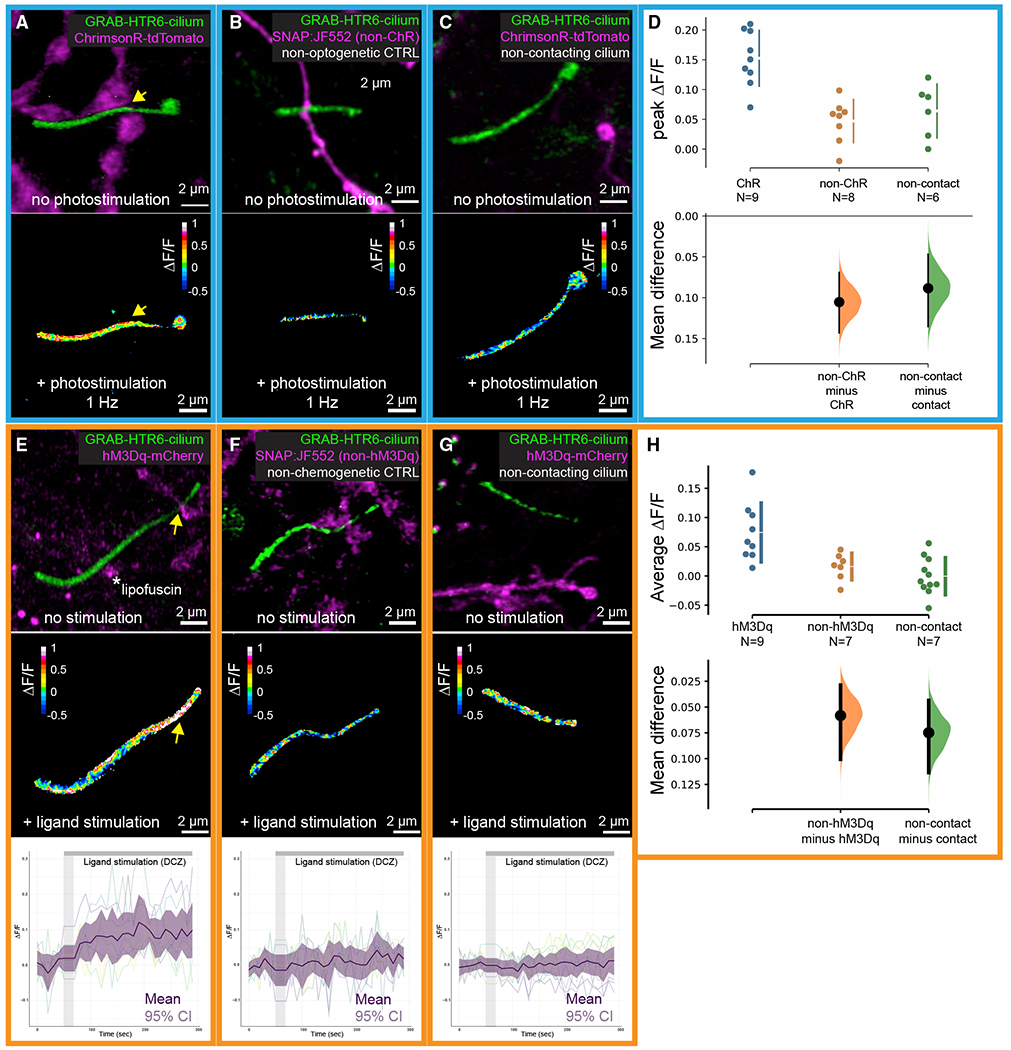
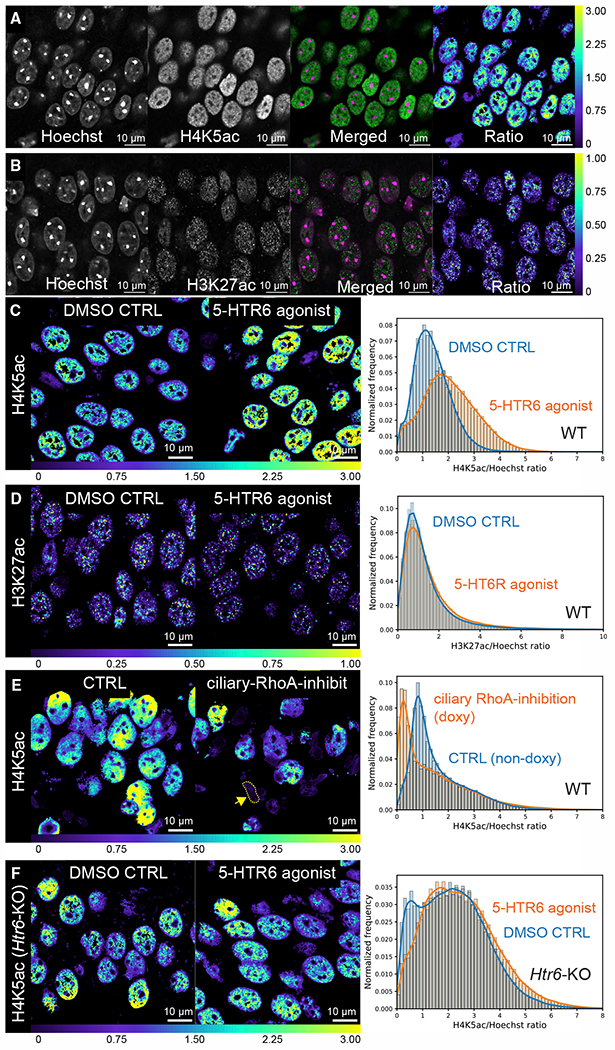
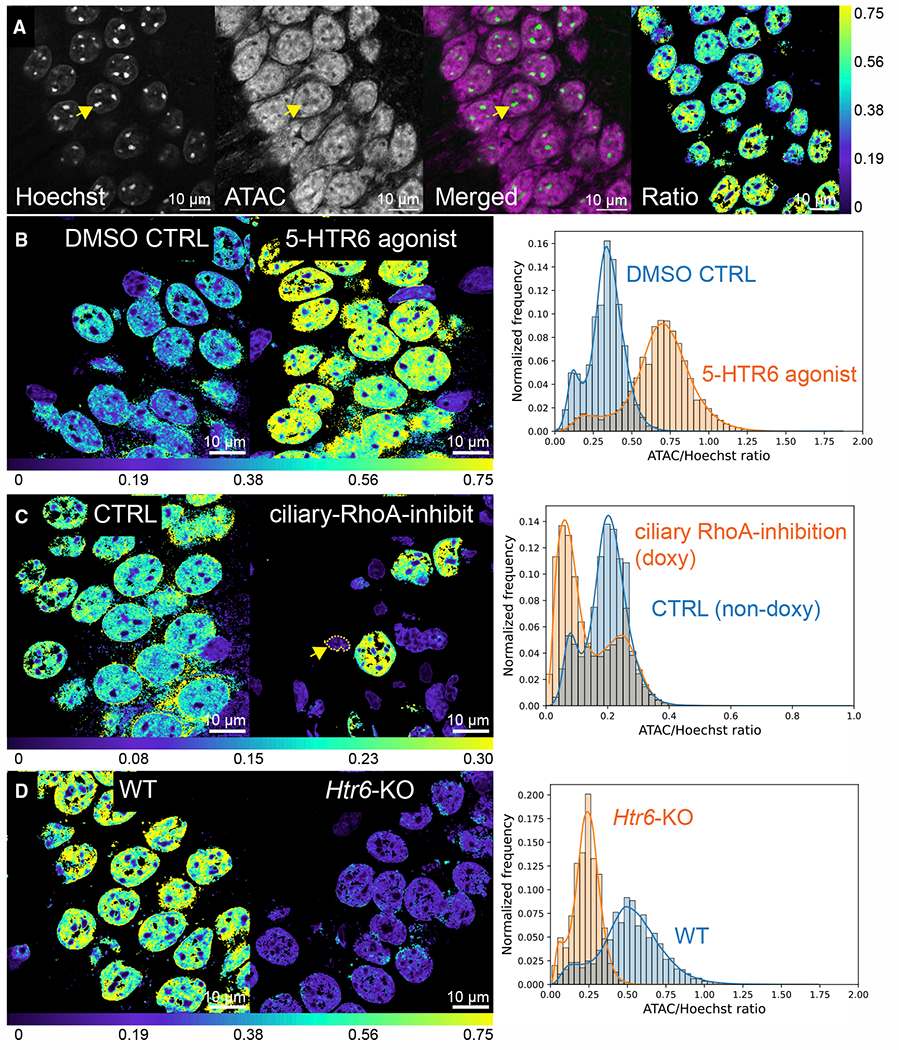
Chemical synapses between axons and dendrites mediate neuronal intercellular communication. Here, we describe a synapse between axons and primary cilia: the axo-ciliary synapse. Using enhanced focused ion beam-scanning electron microscopy on samples with optimally preserved ultrastructure, we discovered synapses between brainstem serotonergic axons and the primary cilia of hippocampal CA1 pyramidal neurons. Functionally, these cilia are enriched in a ciliary-restricted serotonin receptor, the 5-hydroxytryptamine receptor 6 (5-HTR6). Using a cilia-targeted serotonin sensor, we show that opto- and chemogenetic stimulation of serotonergic axons releases serotonin onto cilia. Ciliary 5-HTR6 stimulation activates a non-canonical Gαq/11-RhoA pathway, which modulates nuclear actin and increases histone acetylation and chromatin accessibility. Ablation of this pathway reduces chromatin accessibility in CA1 pyramidal neurons. As a signaling apparatus with proximity to the nucleus, axo-ciliary synapses short circuit neurotransmission to alter the postsynaptic neuron's epigenetic state.

Keywords: FIB-SEM; GPCR signaling; chromatin accessibility; fluorescence lifetime imaging; histone modification; nuclear actin; primary cilia; pyramidal neurons; serotonin.


Conflict of interest statement

Declaration of interests Portions of the technology described herein are covered by U.S. Patent 10,600,615 titled “enhanced FIB-SEM systems for large-volume 3D imaging,” which was issued to C.S.X. and H.F.H. and assigned to Howard Hughes Medical Institute.

Figures

Figure 1.
Figure 1.. FIB-SEM reveals axo-ciliary synapses
(A) Two complete cilia (yellow and blue) arise from the basal bodies (mother centrioles: purple; centrosomes: bright green), which are surrounded by Golgi-related vesicles and Golgi stacks (pink). The axonal varicosity (green) contains a mitochondrion (lavender-gray) and synaptic vesicles (white) and contacts cilia (arrow). Yellow arrows: portions of the cilia that have identifiable microtubule doublets (2–3 μm; colored in saturated yellow and blue, respectively). (B) Primary cilia have a 9+0 microtubule configuration (2nd from bottom) and become 9+1 more distally (2nd from top). No identifiable microtubule doublets are observed in the most distal (6–8 μm) segments (average diameter 100 nm). (C) Single EM sections of axo-ciliary synapses. Cilium: yellow, axon: cyan asterisk. Top left: a reconstructed oblique section showing the longitudinal cross-section of the cilium. In some areas, the cilium and axonal membrane are in direct contact. Occasional vesicles can be seen within 10–20 nm of the axonal membrane opposing the cilium (red arrow). Bottom left: enhanced contrast at the ciliary membrane next to the axon, resembling classic postsynaptic densities (green arrow; cilia-to-axon distance ~20 nm). Top and bottom right: examples suggesting vesicular docking/fusion at the axonal plasma membrane apposing the cilium (red arrows). (D) An axonal process (cyan) gives rise to a varicosity (white box)that makes synaptic contact with a pyramidal neuron primary cilium (yellow; white box magnified at right). (E) A pyramidal neuronal primary cilium (yellow) originates from the left and contacts an axonal varicosity (blue). Area (white arrow) magnified in the right panel. Synaptic vesicles are rendered as 40 nm white spheres to facilitate visualization. Note the axonal ensheathment of the cilium and the axonal vesicle’s proximity to the primary cilium’s membrane. (D and E) Synaptic vesicles: white, endoplasmic reticulum: red, and mitochondrion: green. From 3-month-old C57BL/6J mice.
Figure 2.
Figure 2.. 5-HTR6-primary cilia are in contact with serotonergic axonal varicosities
(A) HTR6 (labeled by CF633, green in merged panel) is highly enriched in CA1 neuronal primary cilia (ADCY3, magenta in the merged panel: 20 μm MIP). (B) Magnified images from (A). 5-HTR6s are not evenly distributed along the length of cilia and can be enriched at areas with low ADCY3 labeling (arrow). (C) Left panel: cilia (magenta) co-labeled with serotonergic axons (green). 20-μm maximum intensity projection (MIP). Middle panel: cilia in the left panel color coded by the shortest distance to a serotonergic axon. Right panel: cilia from left panel color coded with the shortest distance to a serotonergic axon-associated synaptophysin punctum. (D) Floxed synaptophysin-EGFP driven by Tph2-Cre showed ADCY3-labeled cilia (magenta in the merged panel) in contact with serotonergic presynaptic terminals (amplified by anti-GFP and Alexa 488, green in the merged panel). (E) 5-HTR6 (green in the merged panel) are enriched on the cilia at the axonal contact sites (SERT, cyan in the merged panel). Two cilia are in contact with a single serotonergic axonal varicosity. ADCY3 (magenta in the merged panel) can extend beyond the contact site that has few 5-HTR6 (arrow). (A), (B), and (E) are deconvolved confocal images with photon counting detection (Leica). (C) and (D) are Airyscan images (Zeiss). Data from 3- to 4-month-old male C57BL/6J mice.
Figure 3.
Figure 3.. Engineering a 5-HTR6 receptor cilia-targeted sensor
(A) A circularly permutated EGFP (cpEGFP) was inserted into the 3rd intracytoplasmic loop of 5-HTR6. Upon ligand binding, a conformational change of the receptor increases EGFP fluorescence. (B) Schematic diagrams of GRAB-HTR6-PM (top) and GRAB-HTR6-cilia (bottom). (C) Representative images show the expression of the GRAB-HTR6-PM sensor (left, no 5-HT; middle, 10 μM 5-HT) and the response (right). (D) Dose-response curve of the GRAB-HTR6-PM sensor. (E) Summary of ΔF/F0 measured in GRAB-HTR6-PM-expressing HEK293T cells in response to 10 μM 5-HT, 5-HT with 5-HTR6 antagonist SB 258585 (SB258), or SB 271046 (SB271). ACh, acetylcholine; Ado, adenosine; ATP, adenosine 5′-triphosphate; DA, dopamine; GABA, gamma-aminobutyric acid; Glu, glutamate; Gly, glycine; HA, histamine; MT, melatonin; NE, norepinephrine; OA, octopamine; TA, tyramine;Trp, tryptophan. ΔF/F0 was normalized to the averaged peak response measured in 5-HT. Two-tailed Student’s t tests, **p < 0.01. (F) Kinetics of the GRAB-HTR6-PM sensor. Left: a local perfusion system with high-speed line scanning measuring the fluorescence response. Middle: traces of GRAB-HTR6-PM fluorescence in response to 100 μM 5-HT (top) or 100 μM SB 271046 in the continued presence of 1 μM 5-HT (bottom). Right: on- and off-kinetic group data. (G) RPE-1 cells stably expressing a Tet-inducible HTR6-GRAB-cilia-HaloTag. 100-nM application results in increased GFP fluorescence. HaloTag: JF552 was used to reliably identify cilia. (H) Titration curve of the sensor. n = 3 wells, 300–500 cells/well for (D) and (E).
Figure 4.
Figure 4.. Serotonergic axon activation releases serotonin onto cilia
(A–C) Top: a cilium expressing the HTR6-GRAB-cilia sensor in contact with a ChrimsonR-tdTomato-serotonergic axon (ChR, A), in contact with a SNAP:JF552-labeled serotonergic axon (non-ChR control, B), and a cilium distant from a ChrimsonR-tdTomato-serotonergic axon (non-contact, C). Bottom: color maps showing ΔF/F after 25 pulses at 1 Hz optogenetic stimulation, corresponding to the 3 examples in the top row. Arrow in (A) shows the site of contact. (D) Cumming estimation plots of ciliary serotonin levels with optogenetic stimulation of serotonergic axons. ChR mean peak ΔF/F = 0.15. Mean difference between ChR and non-ChR by estimation statistics = −0.10, 95% CI = −0.14 to −0.70, permutation test p value = 0.0002, two-tailed Mann-Whitney test p value = 0.0009. Mean difference between contact and non-contact by estimation statistics = −0.09, 95% CI = −0.14 to −0.05, permutation test p value = 0.005, two-tailed Mann-Whitney test p value = 0.008. (E–G) Top: a cilium expressing the HTR6-GRAB-cilia sensor in contact with an hM3Dq-mCherry-serotonergic axon (E), in contact with a SNAP:JF552-labeled serotonergic axon (nonchemogenetic control, F), and a cilium distant from a hM3Dq-mCherry-serotonergic axon (G). Middle: color maps showing ΔF/F during chemogenetic stimulation by DCZ, corresponding to the 3 examples in the top row. Bottom: individual and averaged traces, corresponding to the 3 examples in the top row. Vertical gray area denotes ligand application. (H) Cumming estimation plots of ciliary serotonin levels with chemogenetic stimulation of serotonergic axons. Average ΔF/F across all time points and samples = 0.08 in hM3Dq. Mean difference between hM3Dq and non-hM3Dq by estimation statistics = −0.06, 95% CI = −0.10 to −0.03, permutation test p value = 0.0076, two-tailed Mann-Whitney test p value = 0.0079. Mean difference between contact and non-contact by estimation statistics = −0.07, 95% CI = −0.11 to −0.04, permutation test p value = 0.0006, two-tailed Mann-Whitney test p value = 0.014. (D and H) Upper: raw data; lower: bootstrap sampling distributions (dot: mean difference; vertical error bars: 95% CI).
Figure 5.
Figure 5.. Serotonin stimulation of ciliary HTR6 activates RhoA in cilia
(A) HEK293A cells stably expressing the HTR6-RhoA FRET/FLIM sensor. A single cilium arises from the cell soma. (B and C) Cilia-targeted Arl13b-RhoA sensor responds to RhoA activation. Mean difference by estimation statistics = −60 ps, 95% CI = −100 to −24 ps, permutation test p value = 0, two-tailed Mann-Whitney test p value = 0.002. (D and E) GNAQ/11 KO and HTR6-overexpression decreases and increases RhoA activity, respectively. Mean difference between WT and GNAQ/11 KO by estimation statistics = 142 ps, 95% CI = 117–169 ps, permutation test p value = 0, Mann-Whitney test p value < 0.00001. Mean difference between Arl13b and HTR6-cilia by estimation statistics = −125 ps, 95% CI = −162 to −93 ps, permutation test p value = 0, Mann-Whitney test p value < 0.00001. (F–H) 10 nM 5HT stimulation of neuronal cilia increases ciliary RhoA activity. Mean difference at 15 min by estimation statistics = −63 ps, 95% CI = −106 to −41 ps, permutation test p value = 0, Wilcoxon p value = 0.00001. This effect is blocked by either HTR6 blocker SB258585 (100 nM, mean difference at 15 min by estimation statistics = 2 ps, 95% CI = −9–22 ps, permutation test p value = 0.82, Wilcoxon p value = 1) or the Gαq/11 blocker YM-254890 (1 μM, mean difference at 15 min by estimation statistics = 8 ps, 95% CI = −3–24 ps, permutation test p value = 0.3, Wilcoxon p value = 0.22). Buffer control showed minimal change (mean difference at 15 min by estimation statistics = 8 ps, 95% CI = −17–59 ps, permutation test p value = 0.74, Wilcoxon p value = 1). (I–K) Chemogenetic stimulation of serotonergic axons increases ciliary RhoA activity in contacting cilia (mean difference at 10 min by estimation statistics = −65 ps, 95% CI = −106 to −41 ps, permutation test p value = 0, Wilcoxon rank sum test p value < 0.0001) but not in non-contacting cilia (mean difference at 10 min by estimation statistics = −1 ps, 95% CI = −15–15 ps, permutation test p value = 0.82, Wilcoxon rank sum test p value = 0.81). Arrow in (I) points to area magnified in the inset, which is shown at an oblique angle to demonstrate the close apposition of axon and cilium at the synapse. Contrast is enhanced in the 10 min time point in (J). (C, E, H, and K) Gardner-Altman (C) and Cumming estimation plot (E, H, and K). Upper, raw data; lower, bootstrap sampling distributions (dot: mean difference; vertical error bars: 95% CI).
Figure 6.
Figure 6.. 5-HTR6 signaling modulates H4K5 acetylation
(A and B) Ratiometric measurements of H4K5ac (A) and H3K27ac levels in fixed mouse brain sections (B). Monoclonal antibodies against H4K5ac and H3K27ac were used to detect histone lysine acetylation (single Airyscan optical sections; green, merged panel). The fluorescent intensity is divided by the Hoechst intensity levels (magenta in the merged panel) to obtain the ratio (rightmost panel, downsampled). (C) 5-HTR6 agonist stimulation increases H4K5ac level. ~60% increase in mode: DMSO: 1.10, WAY181187: 1.76. (D) 5-HTR6 stimulation did not significantly alter H3K27ac level: modes of DMSO and WAY181187 are both 0.77. (E) Ciliary RhoA inhibition for ~1-week decreases H4K5ac level; ~68% decrease in mode: CTRL: 0.82, doxy: 0.26. Many nuclei have small and irregular shapes (arrow). (F) 5-HTR6 agonist stimulation in Htr6 KO mice does not increase the H4K5ac level. ~24% decrease in mode: DMSO: 2.16, WAY181187: 1.73. (C–F) Left and middle panels: single optical sections of the H4K5ac/Hoechst or H3K27ac/Hoechst ratio. Right panel: histograms with kernel density estimates from entire stacks. Data in (A)–(D) were from 3- to 3.5-month-old and (E) and (F) from 4-month-old male C57BL/6J mice.
Figure 7.
Figure 7.. 5-HTR6 signaling modulates chromatin accessibility
(A) Measurements of chromatin accessibility (ATAC-see) normalized against Hoechst (green) on per voxel bases (right panel). Representative single optical Airyscan section of CA1 pyramidal neurons showing ATAC-see labeling with ATTO-590 dye (magenta). Heterochromatin puncta labeled by Hoechst had little ATAC-see labeling (arrows). (B–D) The ATAC/Hoechst ratio is increased with 5-HTR6 agonist WAY181187 (B, 51% increase in mode: DMSO: 0.34, WAY181187: 0.70), decreased after ciliary RhoA inhibition (C, 70% reduction in mode: CTRL: 0.20, doxy: 0.06), and in Htr6 KO (D, 52% reduction in mode: CTRL: 0.50, KO: 0.24). Left and middle panels: single optical sections of ATAC/Hoechst ratio. Right: histograms with kernel density estimates from entire stacks. Data in (A) and (B) from 3- to 3.5-month-old and in (C) and (D) from 4-month-old male C57BL/6J mice.

Comment in

References

    1. Aguet F, Upadhyayula S, Gaudin R, Chou YY, Cocucci E, He K, Chen B-C, Mosaliganti K, Pasham M, Skillern W, et al. (2016). Membrane dynamics of dividing cells imaged by lattice light-sheet microscopy. Mol. Biol. Cell 27, 3418–3435. 10.1091/mbc.E16-03-0164. - DOI - PMC - PubMed
    1. Alvarez FJ, Pearson JC, Harrington D, Dewey D, Torbeck L, and Fyffe REW (1998). Distribution of 5-hydroxytryptamine-immunoreactive boutons on α-motoneurons in the lumbar spinal cord of adult cats. J. Comp. Neurol 393, 69–83. 10.1002/(sici)1096-9861(19980330)393:1&lt;69::aidcne7&gt;3.0.co;2-o. - DOI - PubMed
    1. Anvarian Z, Mykytyn K, Mukhopadhyay S, Pedersen LB, and Christensen ST (2019). Cellular signalling by primary cilia in development, organ function and disease. Nat. Rev. Nephrol 15, 199–219. 10.1038/s41581-019-0116-9. - DOI - PMC - PubMed
    1. Arellano JI, Guadiana SM, Breunig JJ, Rakic P, and Sarkisian MR (2012). Development and distribution of neuronal cilia in mouse neocortex. J. Comp. Neurol 520, 848–873. 10.1002/one.22793. - DOI - PMC - PubMed
    1. Armbruster BN, Li X, Pausch MH, Herlitze S, and Roth BL (2007). Evolving the lock to fit the key to create a family of G protein-coupled receptors potently activated by an inert ligand. Proc. Natl. Acad. Sci. USA 104, 5163–5168. 10.1073/pnas.0700293104. - DOI - PMC - PubMed

Publication types