. 2022 Sep 1;185(18):3441-3456.e19.
doi: 10.1016/j.cell.2022.07.020.

Gut bacterial nutrient preferences quantified in vivo

Affiliations

Gut bacterial nutrient preferences quantified in vivo

Xianfeng Zeng et al. Cell. .

Abstract

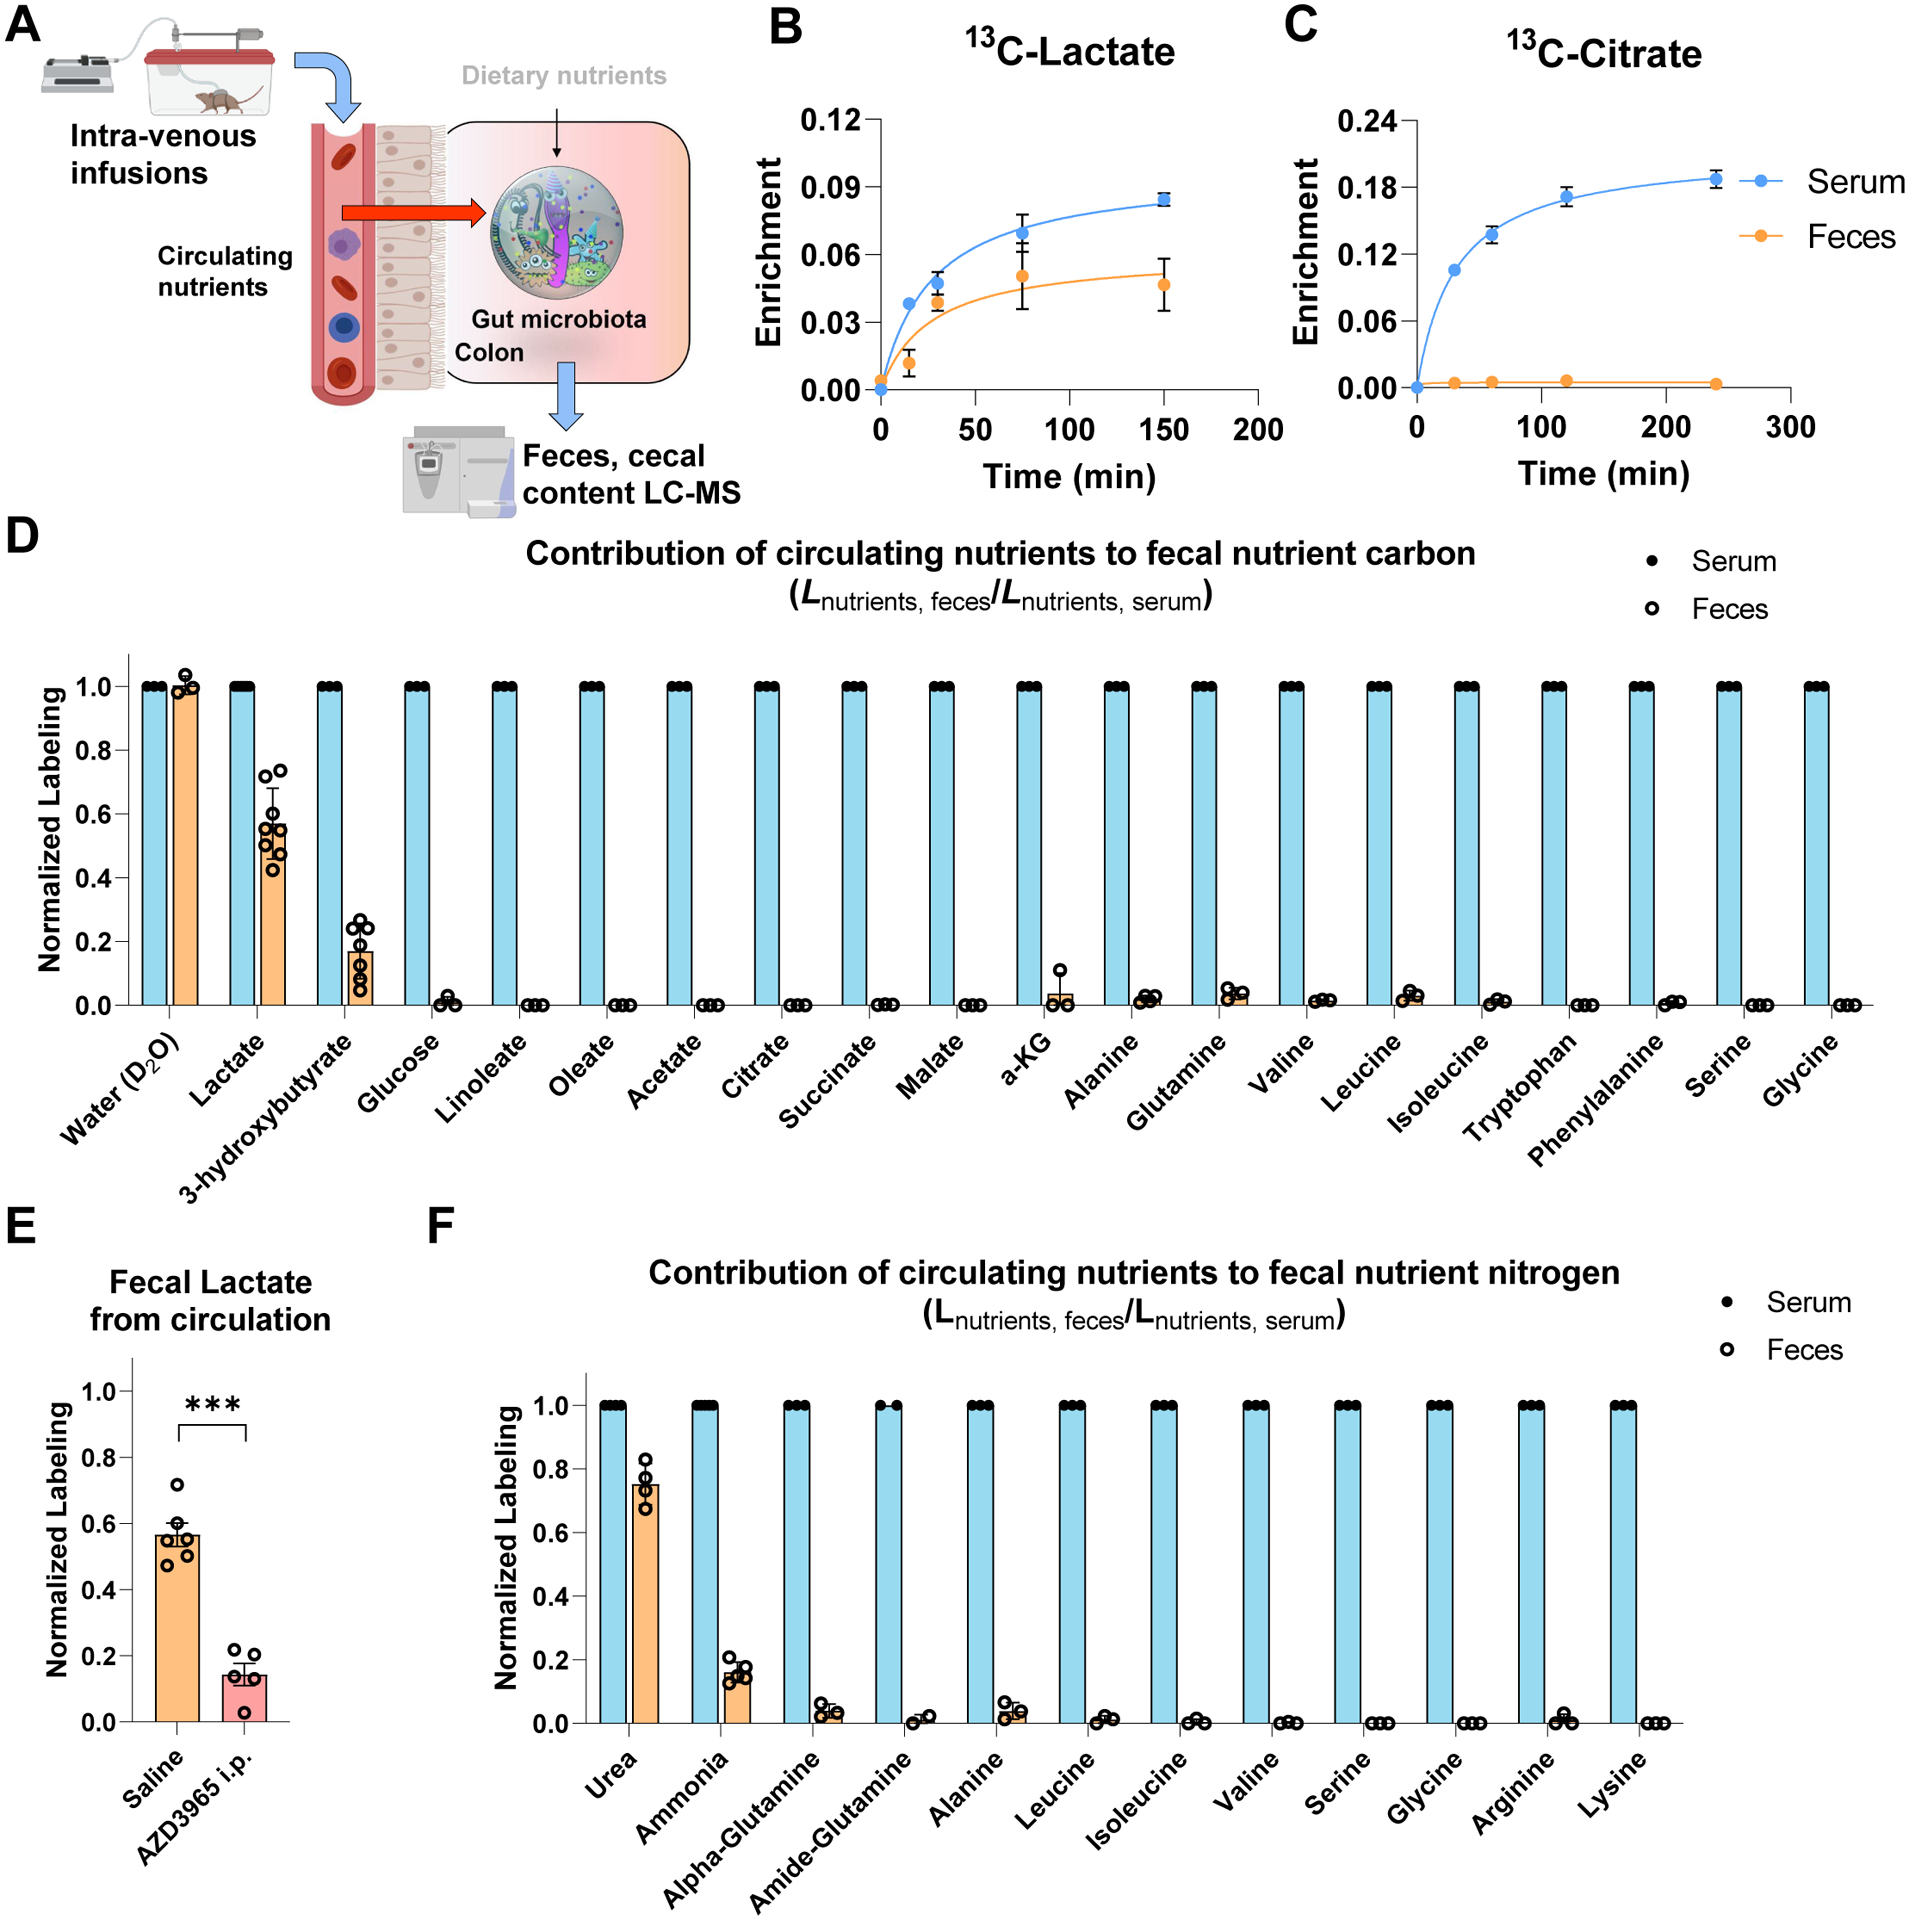
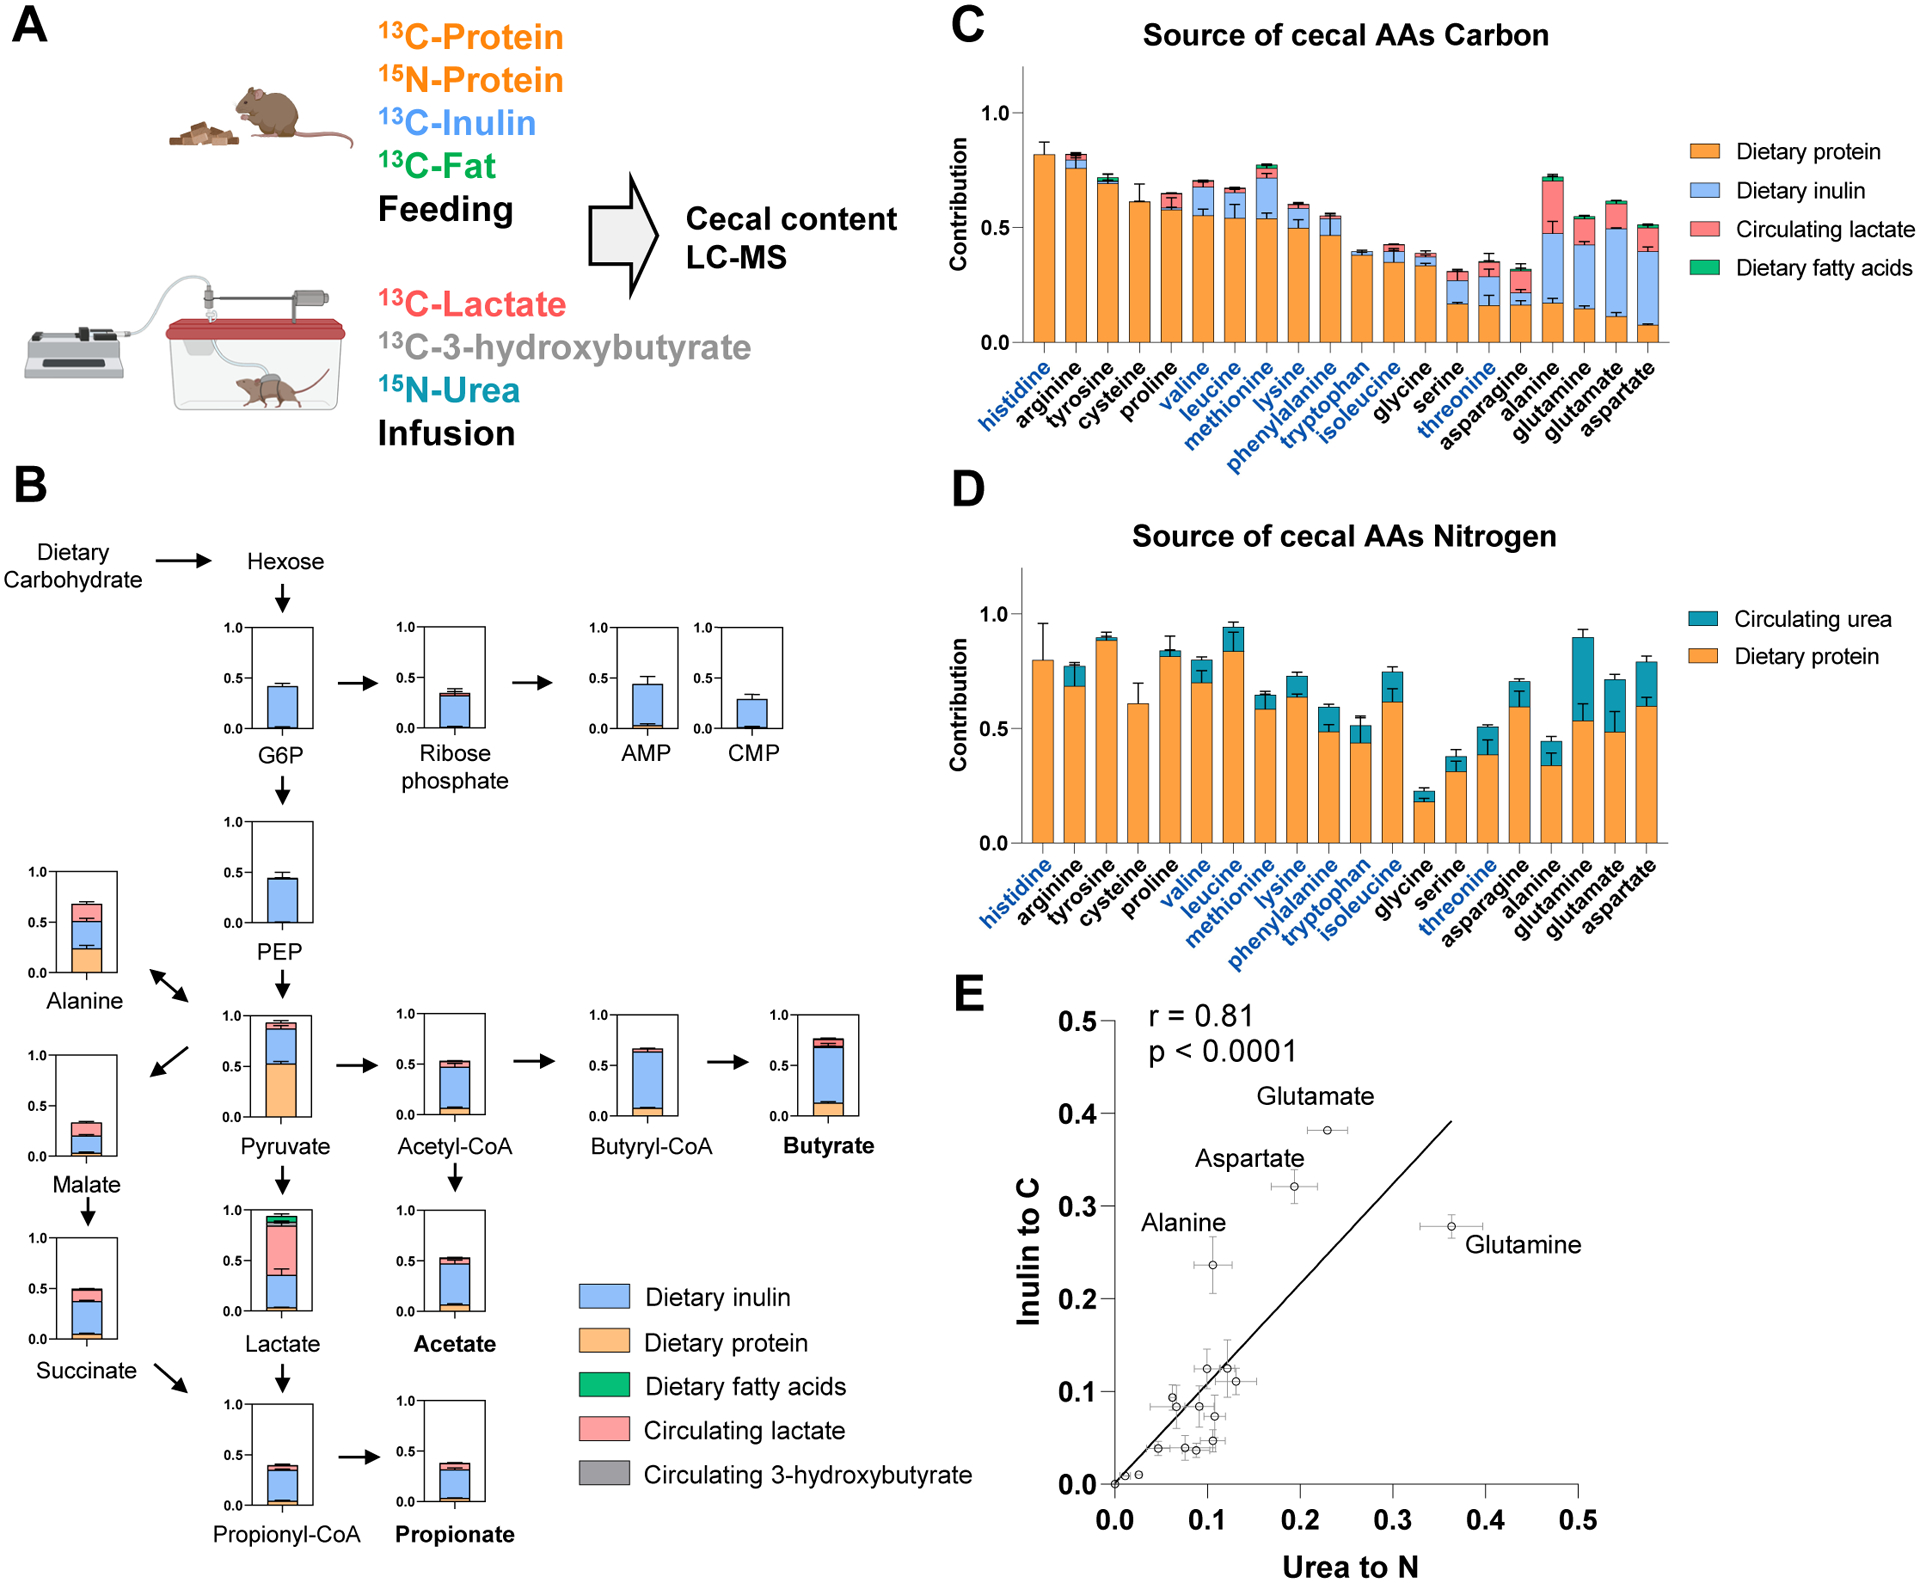
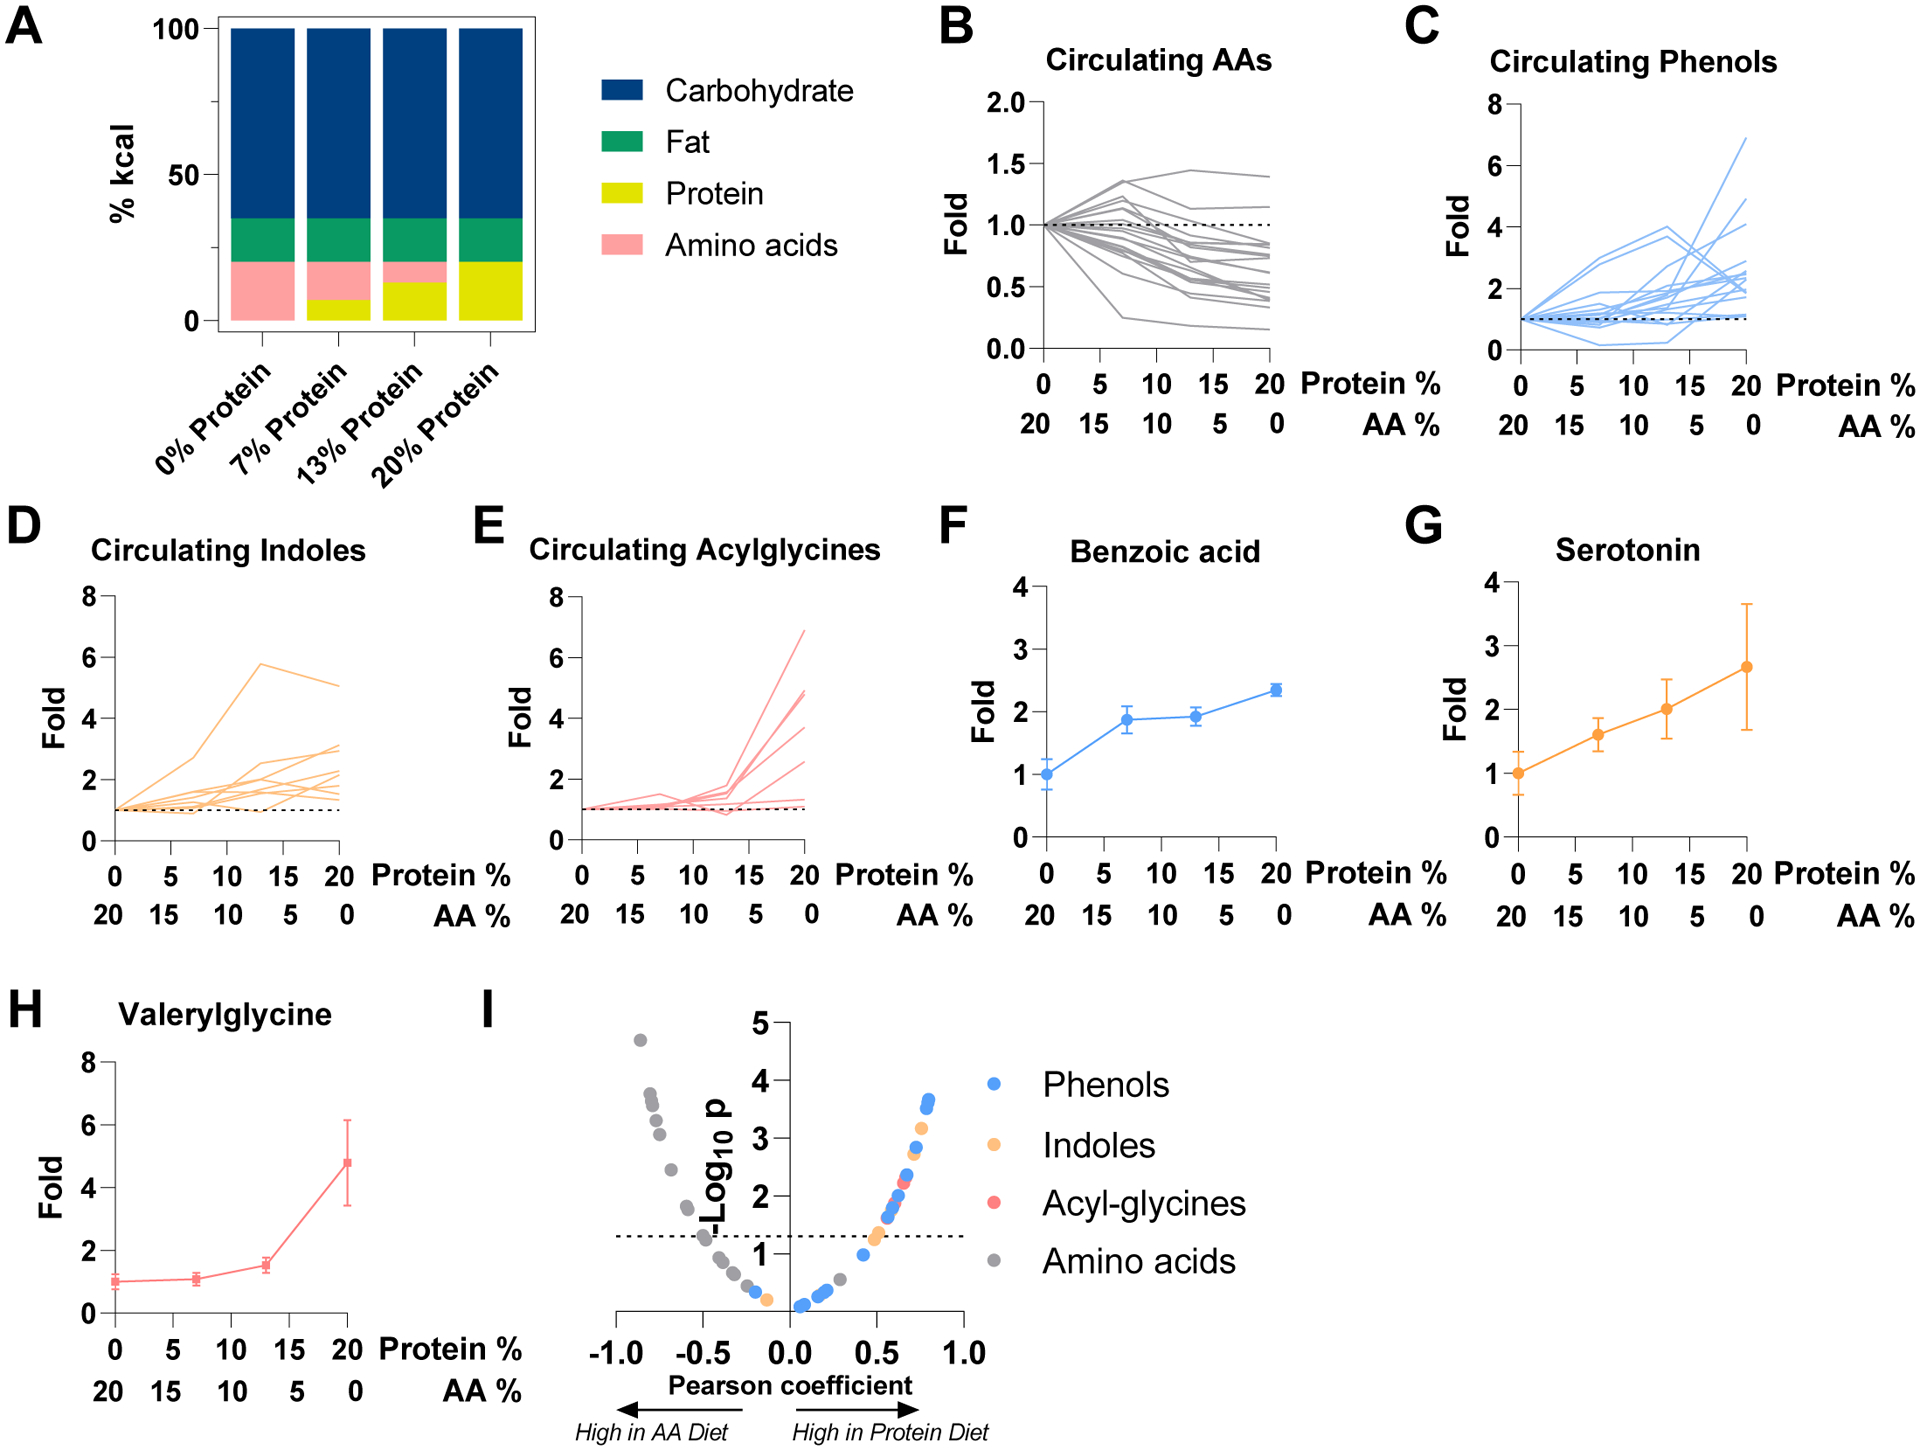
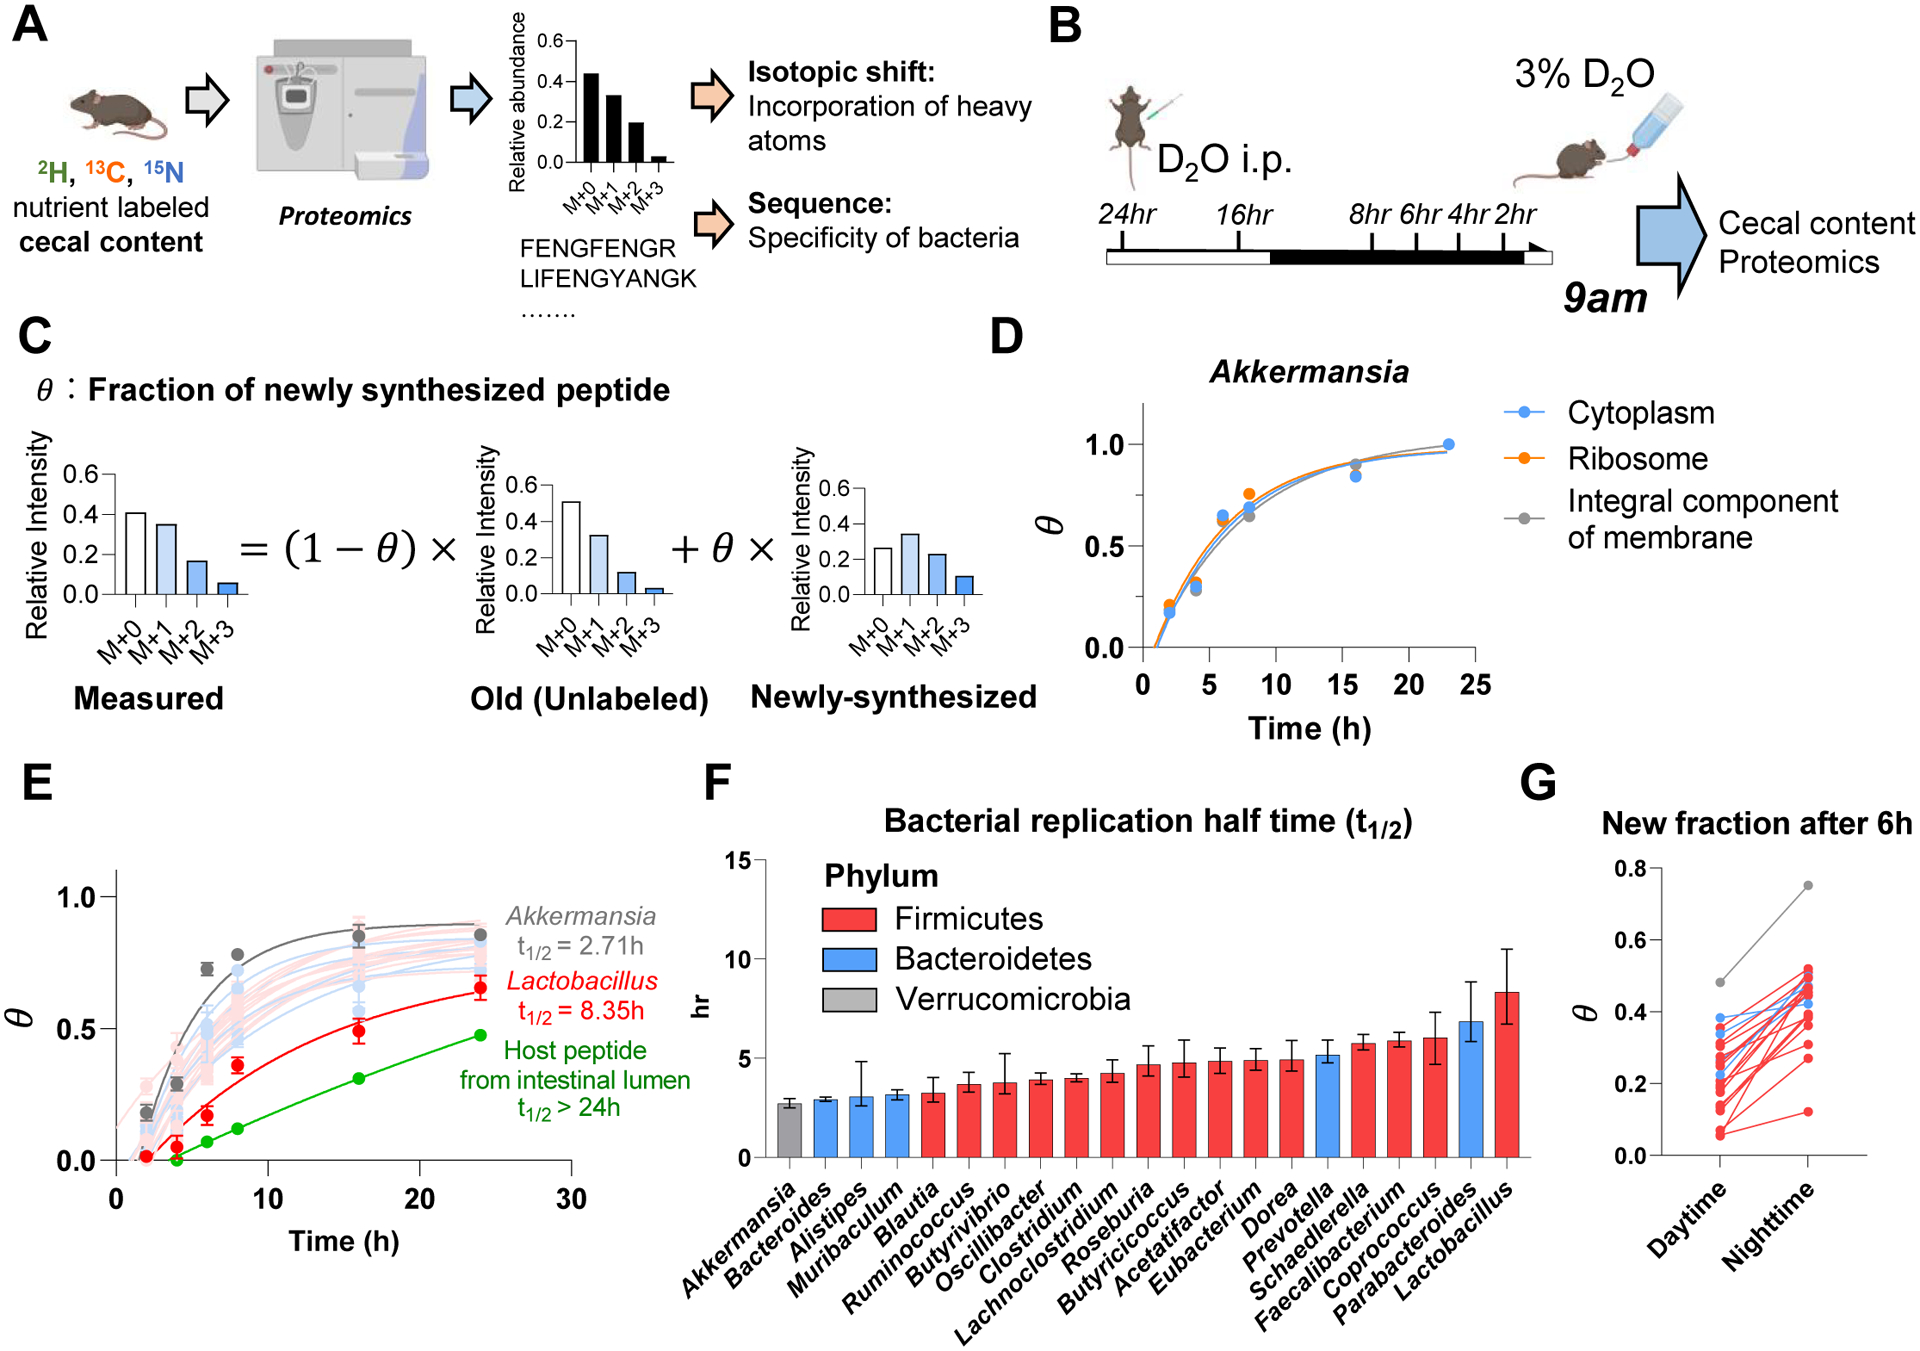
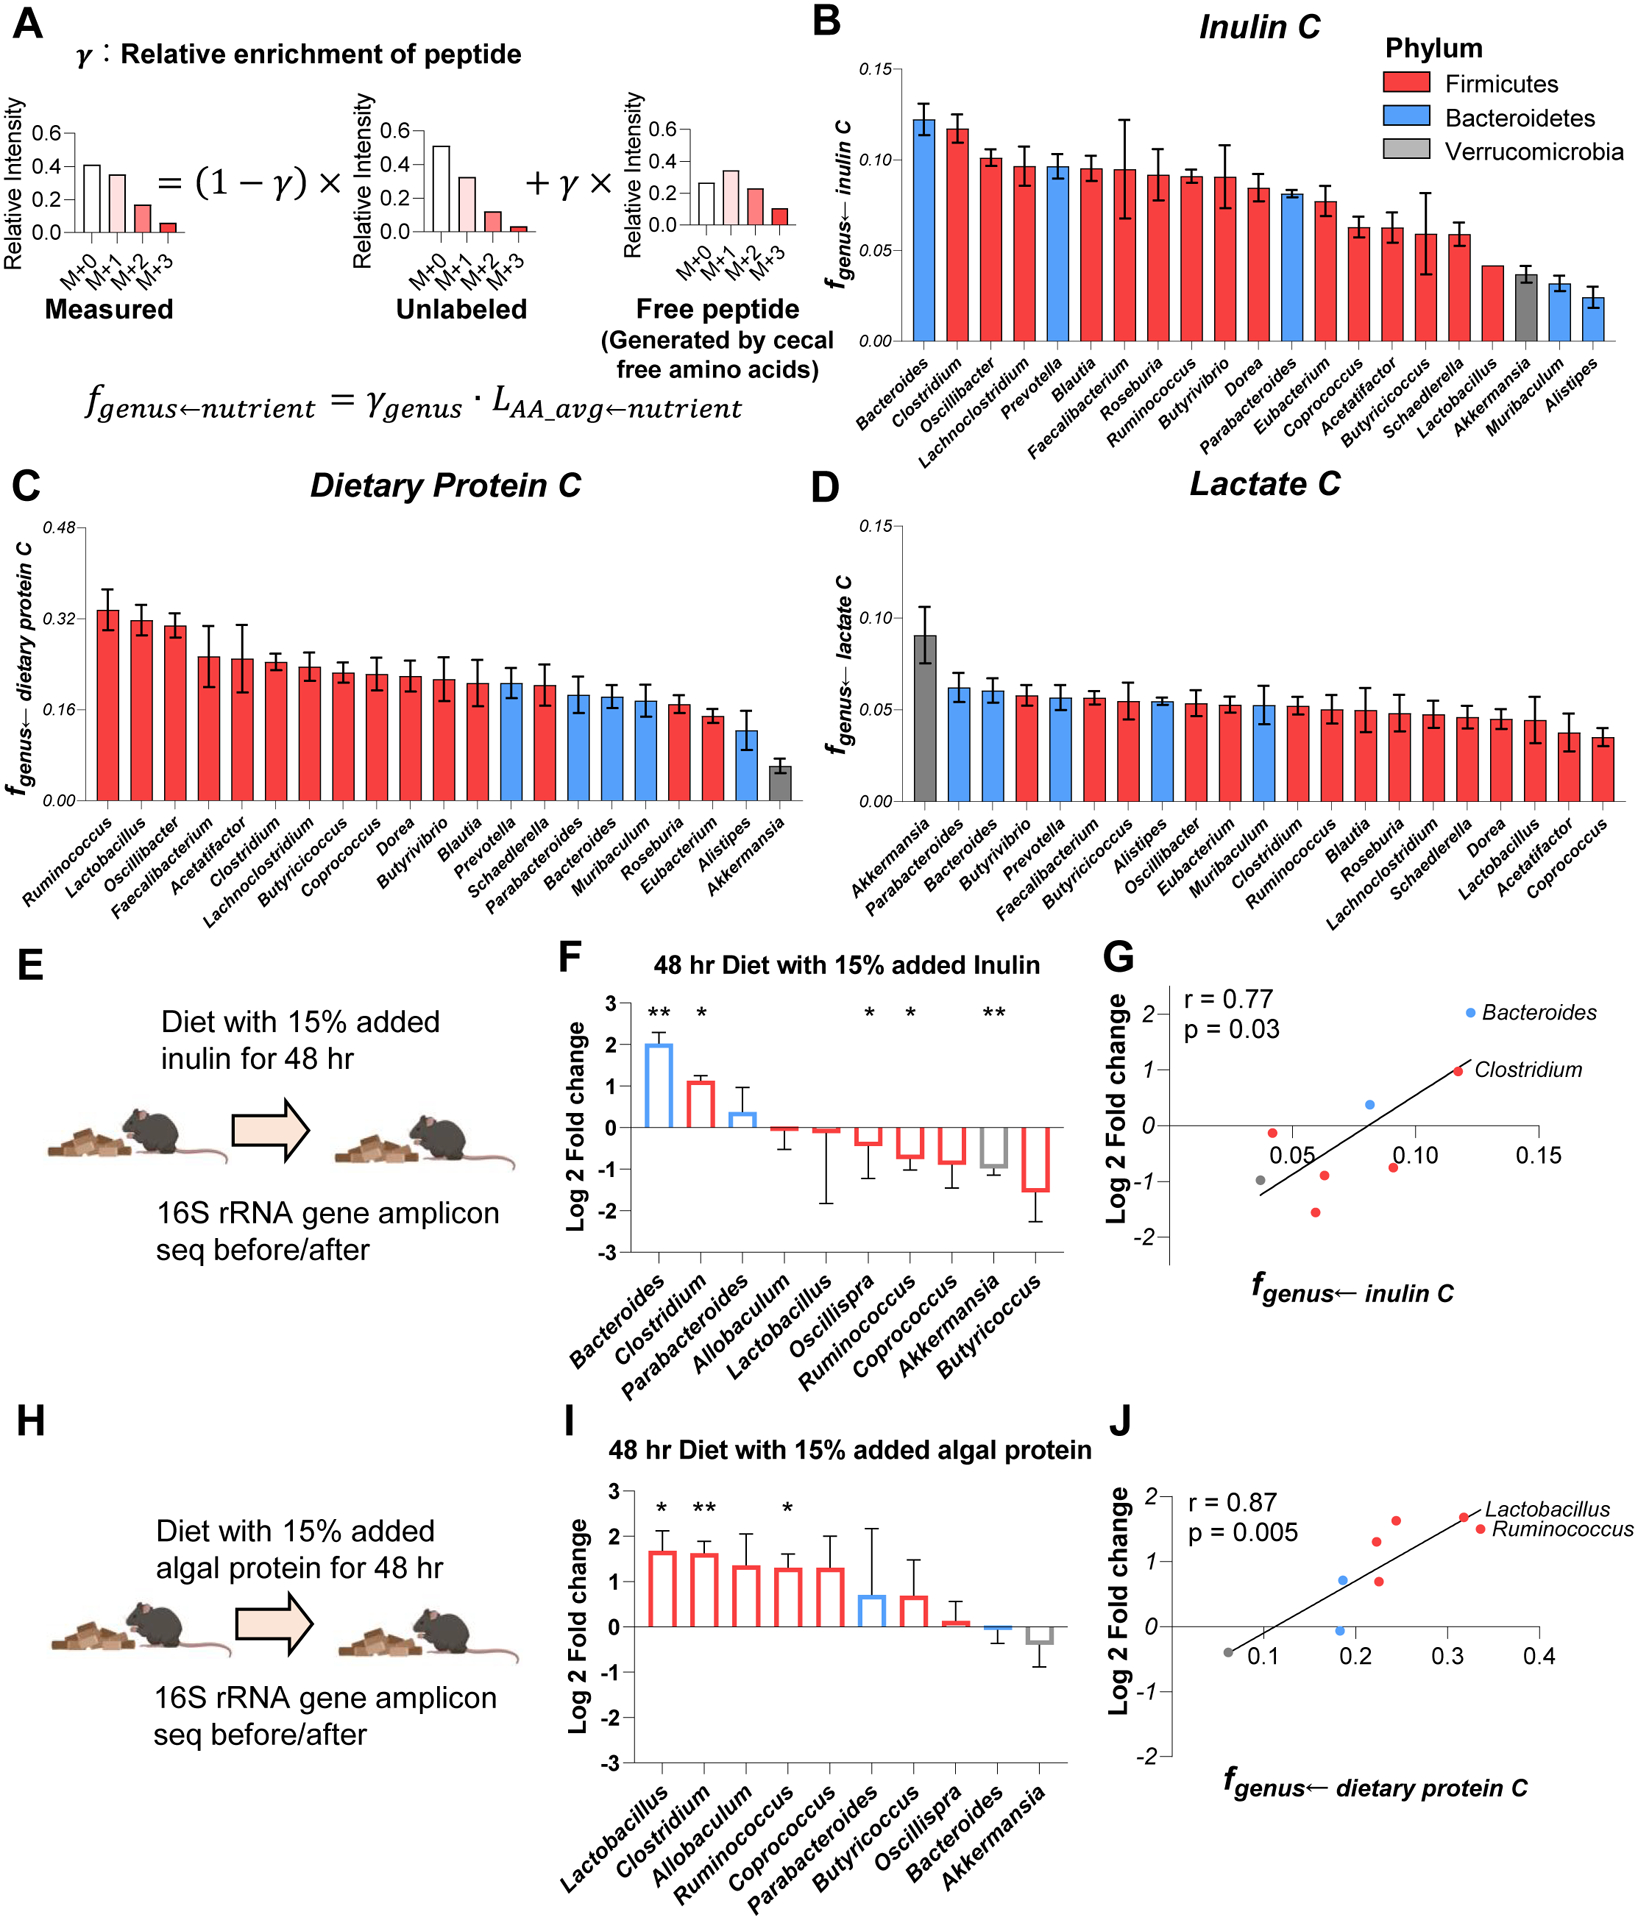
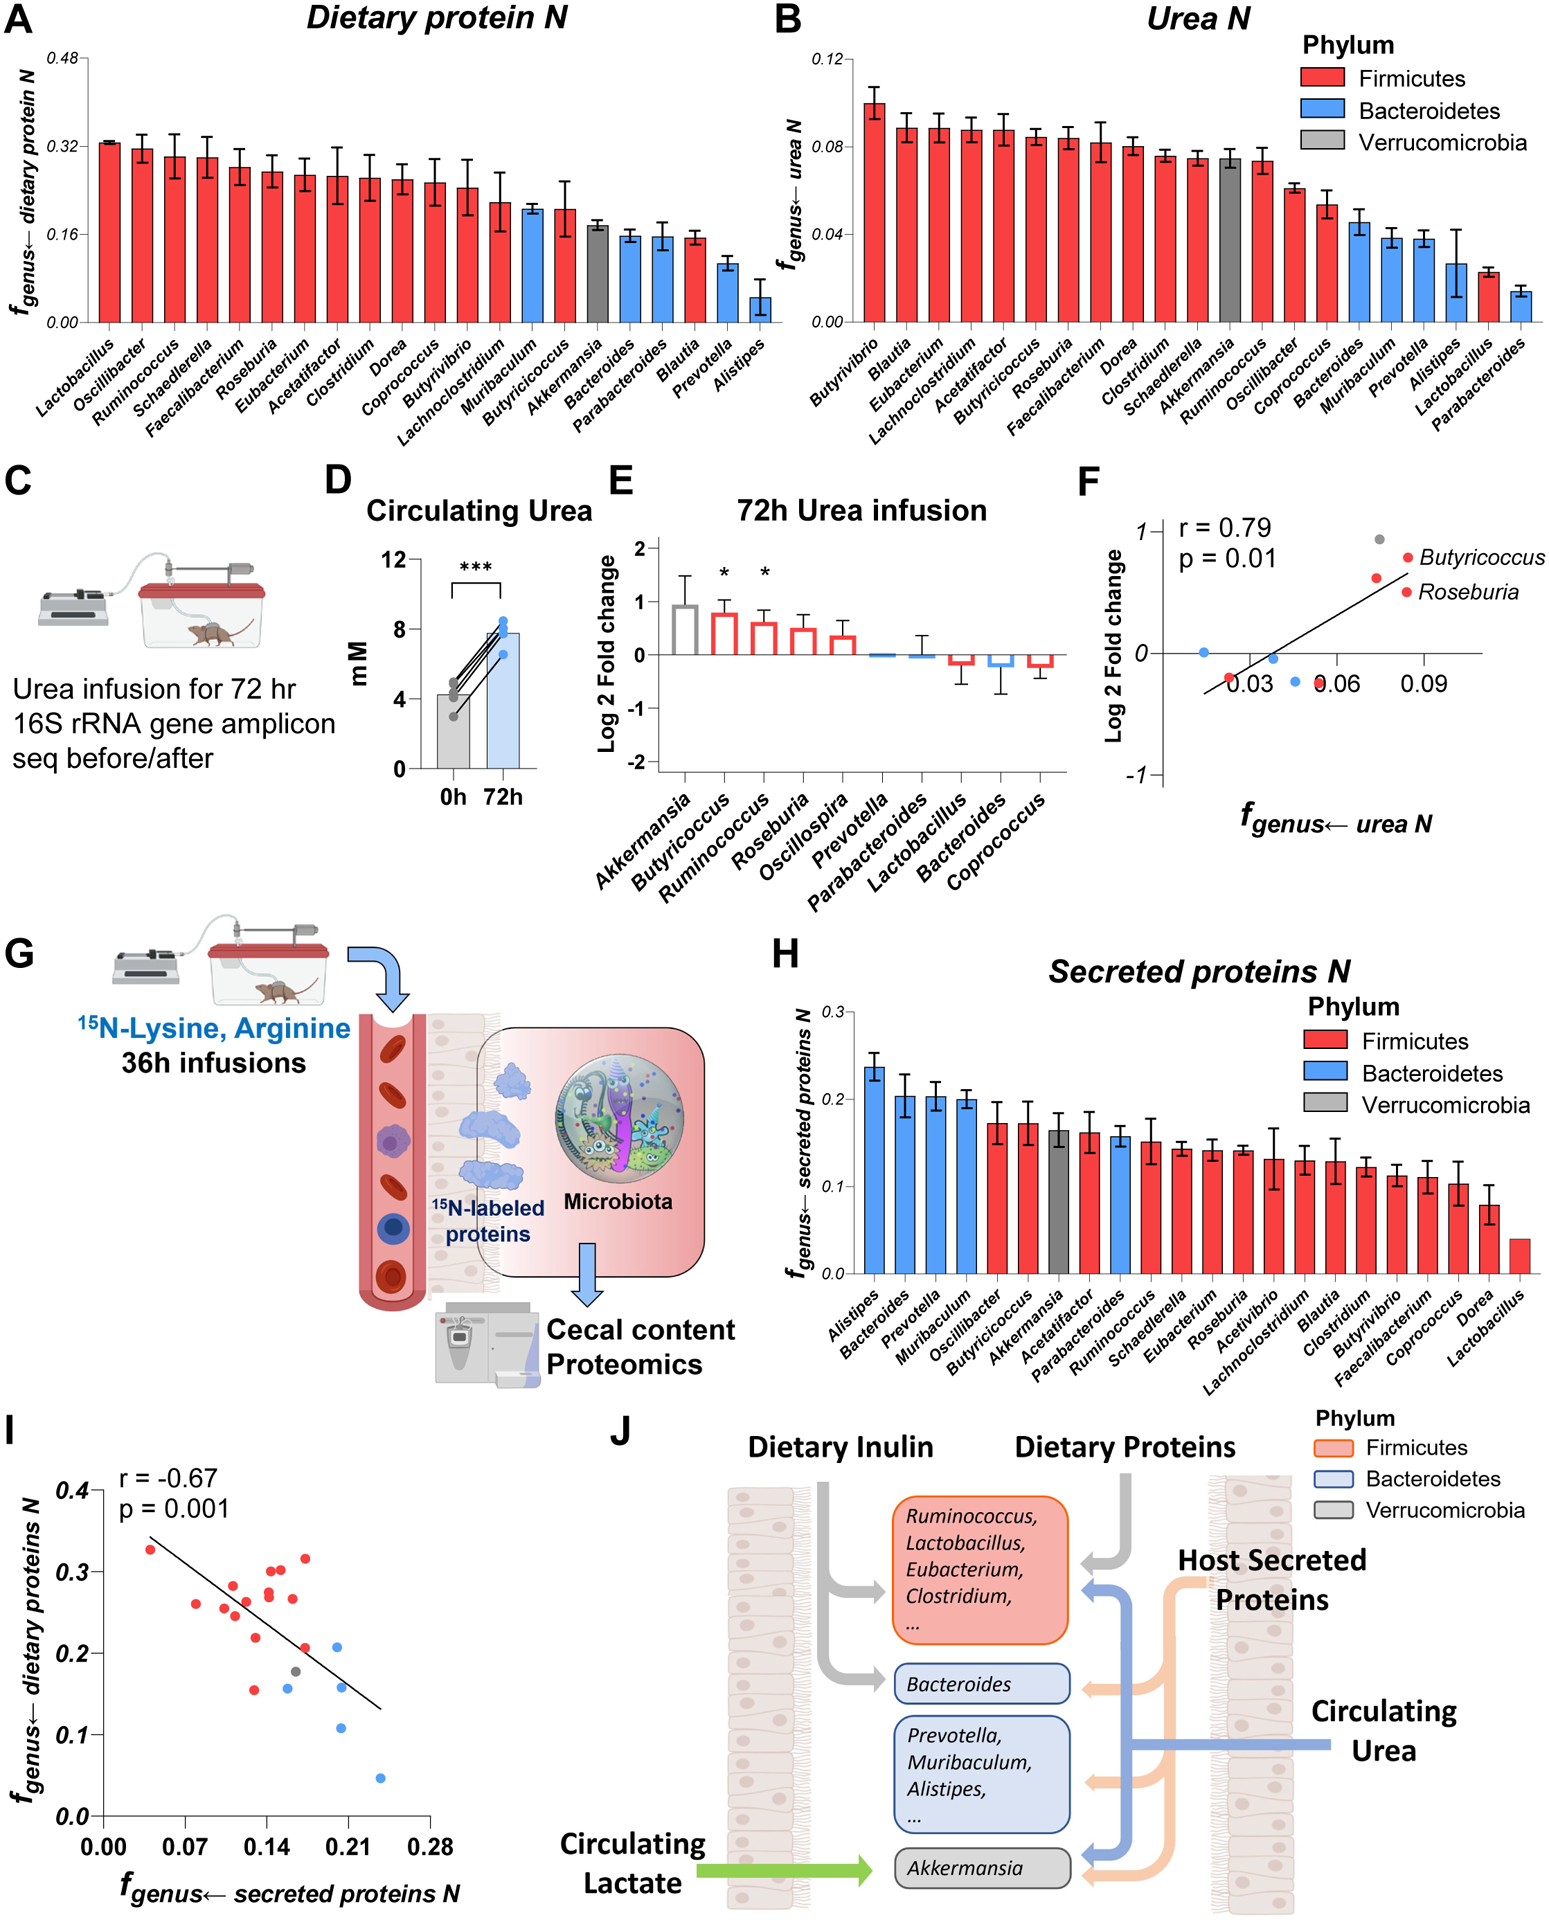
Great progress has been made in understanding gut microbiomes' products and their effects on health and disease. Less attention, however, has been given to the inputs that gut bacteria consume. Here, we quantitatively examine inputs and outputs of the mouse gut microbiome, using isotope tracing. The main input to microbial carbohydrate fermentation is dietary fiber and to branched-chain fatty acids and aromatic metabolites is dietary protein. In addition, circulating host lactate, 3-hydroxybutyrate, and urea (but not glucose or amino acids) feed the gut microbiome. To determine the nutrient preferences across bacteria, we traced into genus-specific bacterial protein sequences. We found systematic differences in nutrient use: most genera in the phylum Firmicutes prefer dietary protein, Bacteroides dietary fiber, and Akkermansia circulating host lactate. Such preferences correlate with microbiome composition changes in response to dietary modifications. Thus, diet shapes the microbiome by promoting the growth of bacteria that preferentially use the ingested nutrients.

Keywords: diet; host-microbiome interactions; isotope tracing; metabolism; metabolomics; methodology; mice; microbiome; nutrient; proteomics.


Conflict of interest statement

Declaration of interests J.D.R. is a member of the Rutgers Cancer Institute of New Jersey and the University of Pennsylvania Diabetes Research Center; a co-founder and stockholder in Empress Therapeutics and Serien Therapeutics; and an advisor and stockholder in Agios Pharmaceuticals, Bantam Pharmaceuticals, Colorado Research Partners, Rafael Pharmaceuticals, Barer Institute, and L.E.A.F. Pharmaceuticals. M.S.D. is a member of the scientific advisory boards of DeepBiome Therapeutics and VastBiome.

Figures

Figure 1.
Figure 1.. Circulating lactate and 3-hydroxybutyrate feed the gut microbiome. See alsoFigure S2.
(A) Schematic of intravenous infusion of isotope-labeled nutrients to identify circulating metabolites that feed gut microbiome. (B) Circulating lactate rapidly enters the feces. Mice were infused with 13C-lactate and serum and fresh feces enrichment were compared. Mean±s.e., N = 3. (C) Circulating citrate does not enter the feces. As in (B), for 13C-citrate. Mean±s.e., N = 3. (D) Passage of circulating 13C-labeled nutrients into the feces. Mice were infused with labeled nutrients for 2.5 h, and labeling fraction in feces was normalized to labeling fraction in serum. Mean±s.e., N = 3 except for lactate (N = 8) and 3-hydroxybutyrate (N = 7). (E) Pharmacological inhibition of MCT1 transporter decreases the passage of circulating lactate to feces. Mice were injected i.p. with saline or 100 mg/kg AZD3965, and fresh feces lactate enrichment measured. Mean±s.e. N = 6 for saline and N = 5 for AZD3965. ***P<0.001 by two-sided Student’s t-test. (F) Passage of circulating 15N-labeled nutrients into the feces. As in (D), for 15N-lableing. Mean±s.e. N = 3 except for urea (N = 4) and ammonia (N = 5).
Figure 2.
Figure 2.. Quantitative analysis of dietary and circulating nutrient contributions to gut microbiome. See alsoFigure S3,S4.
(A) Experimental design. Mice were fed chow containing 13C-protein, 13C-inulin, 13C-fatty acids, or 15N-protein for 24 h. Alternatively, mice were intravenously infused with 13C-lactate, 13C-3-hydroxybutyrate or 15N-urea for 24 h. The labeling of cecal content metabolites was analyzed by LC-MS. (B) Contribution of dietary and circulating nutrients to carbohydrate fermentation pathways in gut microbiome. Mean ± s.e. N = 4. (C) Contribution of dietary and circulating nutrients to cecal amino acid carbon. The names of essential amino acids (EAA) are written in blue and non-essential amino acids (NEAA) in black. Mean ± s.e. N = 4. (D) Contribution of dietary and circulating nutrients to cecal amino acid nitrogen. As in (C), for nitrogen. (E) Positive correlation, across amino acids in the cecal contents, of carbon contribution from dietary inulin and nitrogen contribution from circulating urea. Mean ± s.e. N = 4.
Figure 3.
Figure 3.. Circulating levels of microbiota metabolites depend on protein reaching the microbiome.
(A) Compositions of diets used in the figure. “Protein” is casein. “Amino acids” are composition-matched free amino acids. (B) Concentration of circulating amino acids in systemic circulation after two weeks test diet relative to free amino acids diet. Serum was taken at ad lib fed state. Each metabolite is a line. Mean, N = 4 mice. (C) As in (B), for phenols. Mean, N = 4 mice. (D) As in (B), for indoles. Mean, N = 4 mice. (E) As in (B), for acylglycines. Mean, N = 4 mice. (F) As in (B) for benzoic acid. Mean ± s.e., N = 4 mice. (G) As in (F), for serotonin. Mean ± s.e., N = 4 mice. (H) As in (F), for valerylglycine. Mean ± s.e., N = 4 mice. (I) Correlation between dietary protein (as opposed to free amino acid) fraction in diet and metabolite abundances (relative to amino acid diet). The volcano plot shows Pearson coefficient and P value of correlation between metabolite levels to casein abundance in diet.
Figure 4.
Figure 4.. Growth rate of different gut bacterial genera quantified by isotope tracing. See alsoFigure S5.
(A) Experimental approach for isotope tracing into specific gut bacteria. Only peptides that are specific to a particular bacterial genus were examined. (B) Growth rate quantification using D2O. Mice received D2O by i.p. injection followed by D2O drinking water and cecal content labeling was measured over time by proteomics and metabolomics. Mice were fed ad lib; tissues were harvested at 9am. (C) Calculation of newly synthesized peptide fraction (θ). The experimentally observed peptide mass isotope distribution was fit to a linear combination of unlabeled peptide (“old,” heavy forms from natural isotope abundance) and newly synthesized peptide (“new,” heavy forms from isotope labeling pattern of free cecal amino acids and from natural isotope abundance). (D) Different cellular compartments from the same bacterial genus show similar labeling rate. Mean, N = 5 mice for each time point. (E) Genus-specific growth rates were determined by a single exponential fitting, as a function of time, of θ (mean across both different peptides measured from that genus and replicate mice). Mean±s.e., N = 5 mice for each time point. (F) Bacterial replication half time of different gut bacteria. Data are exponential fits ±s.e. (G) The gut bacteria synthesize protein in sync with the physiological feeding patterns of the host. The figure shows the average newly synthesized peptide fraction (θ) for different gut bacterial genera after D2O labeling during daytime vs nighttime. Each line connects the daytime and nighttime measurements for one genus. Mean, N = 5 mice for daytime and for nighttime.
Figure 5.
Figure 5.. Preferred carbon sources differ across gut bacteria. See alsoFigure S6.
(A) Calculation of peptide relative 13C-enrichment (γ) and carbon contribution from the tracer to a bacterial genus (fgenus←nutrient). First, the experimentally observed peptide mass isotope distribution was fit to a linear combination of unlabeled peptide (heavy forms from natural isotope abundance) and a peptide made from free cecal amino acids (heavy forms from isotope labeling pattern of free cecal amino acids and from natural isotope abundance), yielding. Then, fgenus←nutrient was determined by correcting for the fractional contribution of that tracer to the cecal free amino acid pools. (B) Carbon contribution of dietary inulin across bacterial genera. Mean±s.e., N = 4 mice. (C) Carbon contribution of dietary algal protein across bacterial genera. Mean±s.e., N = 6 mice. (D) Carbon contribution of circulating lactate across bacterial genera. Mean±s.e., N = 7 mice. (E) Experimental scheme of high-inulin diet feeding followed by 16S rRNA gene amplicon sequencing. (F) Genus-level microbiota composition changes after high-inulin diet. The genera increased after high-inulin diet prefer inulin in (B). Mean±s.e., N=3 mice. *P<0.05 and **P<0.01 by two-sided Student’s t-test. (G) Correlation between genera abundance changes and carbon-source preference. (H- J) As in (E - G), for algal protein-supplemented diet.
Figure 6.
Figure 6.. Firmicutes favor dietary protein while Bacteroidetes prefer secreted host protein. See alsoFigure S6,S7.
(A) Nitrogen contribution of dietary algal protein across bacterial genera. Mean±s.e., N = 6 mice. (B) Nitrogen contribution of circulating urea across bacterial genera. Mean±s.e., N = 6 mice. (C) Experimental scheme of 72 hr urea infusion followed by 16S rRNA gene amplicon sequencing. (D) Urea infusions increased urea concentration in systemic circulation. N = 5 mice. ***P<0.001 by two-sided Student’s t-test. (E) Genus-level microbiota composition changes after urea infusion. The genera increased after urea infusion prefer urea in (B). Mean±s.e., N=5 mice. *P<0.05 by two-sided Student’s t-test. (F) Correlation between genera abundance changes and nitrogen-source preference. (G) Experimental schematic of long-term 15N-lysine and 15N-arginine infusion to probe the contribution of secreted host proteins to different bacterial genera. (H) Nitrogen contribution of secreted host proteins across bacterial genera. Mean±s.e., N = 5 mice. (I) Negative correlation between fgenusdietary proteins N and fgenussecreted proteins N. (J) Summary of carbon and nitrogen inputs to different gut bacteria. Firmicutes prefer dietary carbon sources (fiber and protein) and nitrogen from host circulating urea. Bacteroidetes heavily use dietary fiber, while using on host secreted proteins for nitrogen. Verrucomicrobia prefers host secreted nutrients, both protein and circulating small molecules (lactate, urea).

Comment in

References

    1. Albenberg L, Esipova TV, Judge CP, Bittinger K, Chen J, Laughlin A, Grunberg S, Baldassano RN, Lewis JD, Li H, Thom SR, Bushman FD, Vinogradov SA, Wu GD, 2014. Correlation Between Intraluminal Oxygen Gradient and Radial Partitioning of Intestinal Microbiota. Gastroenterology 147, 1055–1063.e8. 10.1053/j.gastro.2014.07.020 - DOI - PMC - PubMed
    1. Arab JP, Karpen SJ, Dawson PA, Arrese M, Trauner M, 2017. Bile acids and nonalcoholic fatty liver disease: Molecular insights and therapeutic perspectives. Hepatol. Baltim. Md 65, 350–362. 10.1002/hep.28709 - DOI - PMC - PubMed
    1. Bartman CR, TeSlaa T, Rabinowitz JD, 2021. Quantitative flux analysis in mammals. Nat. Metab 3, 896–908. 10.1038/s42255-021-00419-2 - DOI - PMC - PubMed
    1. Batani G, Bayer K, Böge J, Hentschel U, Thomas T, 2019. Fluorescence in situ hybridization (FISH) and cell sorting of living bacteria. Sci. Rep 9, 18618. 10.1038/s41598-019-55049-2 - DOI - PMC - PubMed
    1. Berry D, Mader E, Lee TK, Woebken D, Wang Y, Zhu D, Palatinszky M, Schintlmeister A, Schmid MC, Hanson BT, Shterzer N, Mizrahi I, Rauch I, Decker T, Bocklitz T, Popp J, Gibson CM, Fowler PW, Huang WE, Wagner M, 2015. Tracking heavy water (D2O) incorporation for identifying and sorting active microbial cells. Proc. Natl. Acad. Sci 112, E194–E203. 10.1073/pnas.1420406112 - DOI - PMC - PubMed

Publication types