. 2023 Feb;614(7949):649-652.
doi: 10.1038/s41586-022-05269-w. Epub 2022 Sep 2.

Identification of carbon dioxide in an exoplanet atmosphere

Collaborators

Identification of carbon dioxide in an exoplanet atmosphere

JWST Transiting Exoplanet Community Early Release Science Team. Nature. 2023 Feb.

Abstract

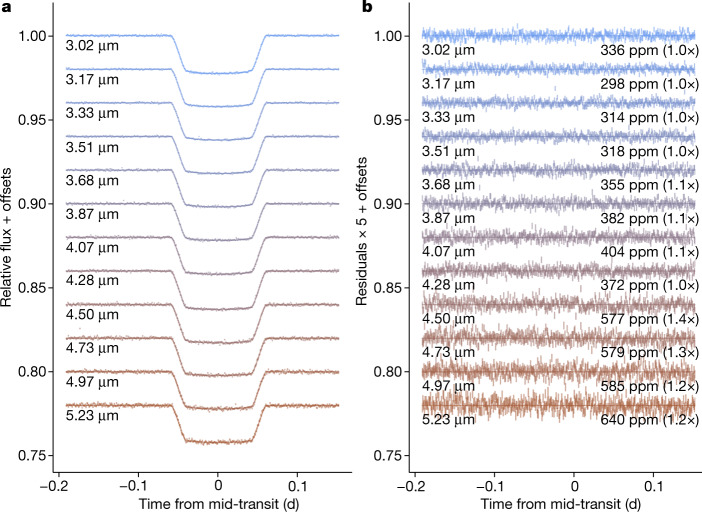
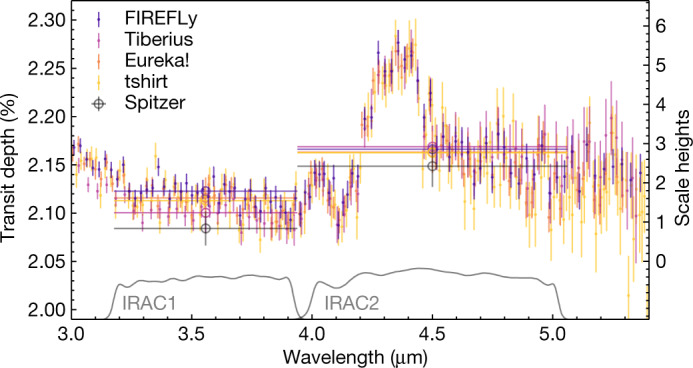
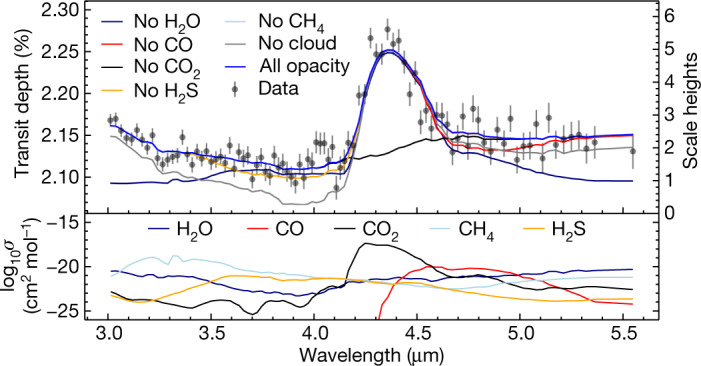
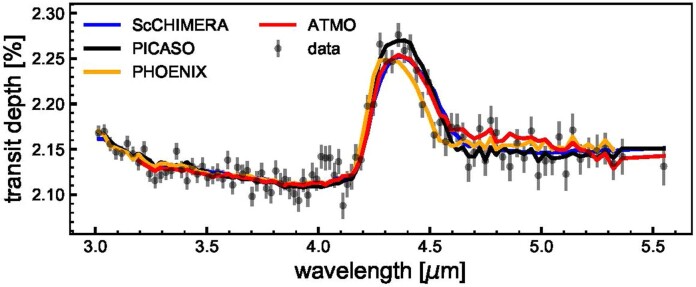
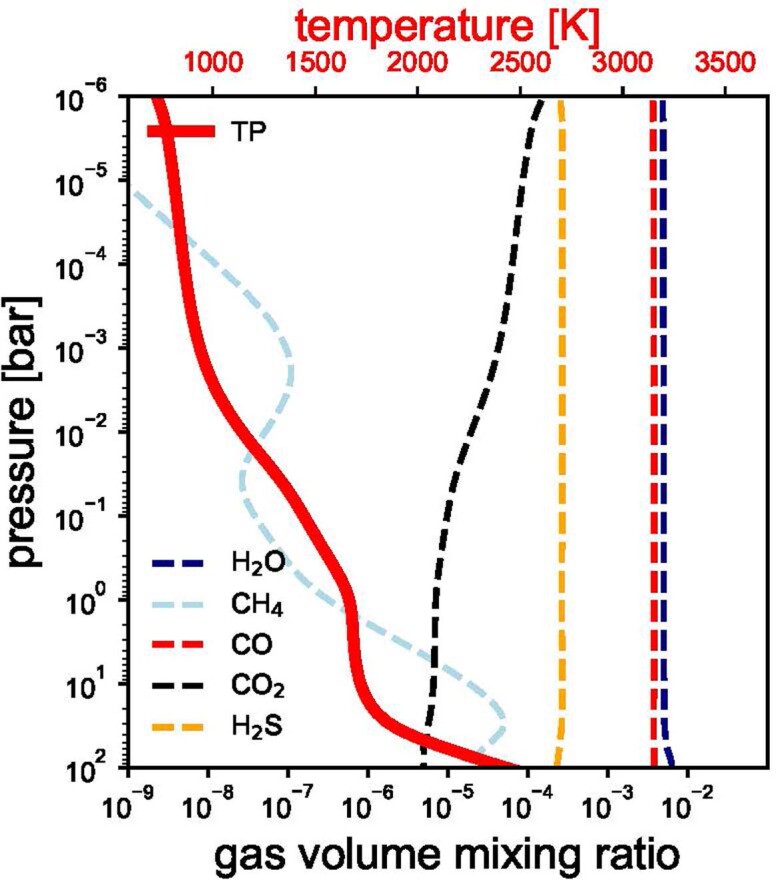
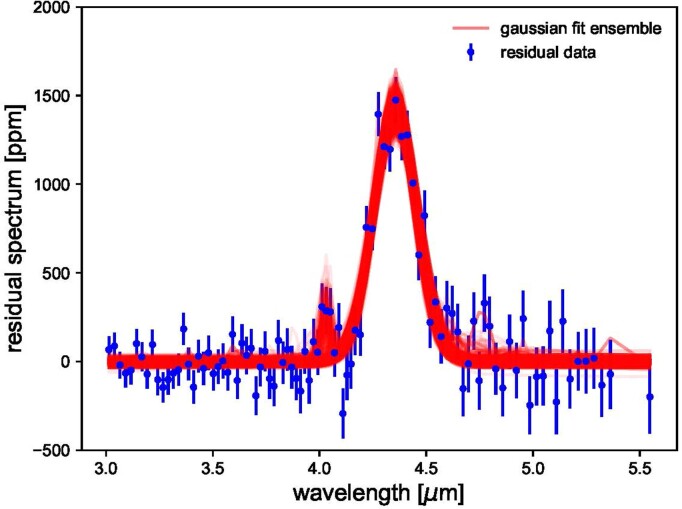
Carbon dioxide (CO2) is a key chemical species that is found in a wide range of planetary atmospheres. In the context of exoplanets, CO2 is an indicator of the metal enrichment (that is, elements heavier than helium, also called 'metallicity')1-3, and thus the formation processes of the primary atmospheres of hot gas giants4-6. It is also one of the most promising species to detect in the secondary atmospheres of terrestrial exoplanets7-9. Previous photometric measurements of transiting planets with the Spitzer Space Telescope have given hints of the presence of CO2, but have not yielded definitive detections owing to the lack of unambiguous spectroscopic identification10-12. Here we present the detection of CO2 in the atmosphere of the gas giant exoplanet WASP-39b from transmission spectroscopy observations obtained with JWST as part of the Early Release Science programme13,14. The data used in this study span 3.0-5.5 micrometres in wavelength and show a prominent CO2 absorption feature at 4.3 micrometres (26-sigma significance). The overall spectrum is well matched by one-dimensional, ten-times solar metallicity models that assume radiative-convective-thermochemical equilibrium and have moderate cloud opacity. These models predict that the atmosphere should have water, carbon monoxide and hydrogen sulfide in addition to CO2, but little methane. Furthermore, we also tentatively detect a small absorption feature near 4.0 micrometres that is not reproduced by these models.


Conflict of interest statement

The authors declare no competing interests.

Figures

Fig. 1
Fig. 1. JWST NIRSpec time-series data for WASP-39b.
a, Spectroscopic light curves for WASP-39b’s transit with a spectral resolving power of 20 and a time cadence of 1 min (data are binned and offset vertically for display purposes only). An exoplanet light-curve model was fitted to the data using a quadratic limb-darkening law with an exponential ramp and a quadratic function of time removed. b, Residuals of the binned light curve after subtracting the transit model scaled up by a factor of five to show the structure. The r.m.s. of the residuals are given in units of ppm. The numbers in brackets are the ratio of the r.m.s. to the predicted photon-limited noise. Source data.
Fig. 2
Fig. 2. Independent reductions of the WASP-39b transmission spectrum.
The JWST data (small coloured points) are compared with Spitzer’s two Infrared Array Camera (IRAC) broadband photometric measurements (grey circles and corresponding sensitivity curves labelled IRAC1 and IRAC2). The axis on the right shows equivalent scale heights (750–1,000 km) in WASP-39b’s atmosphere; for plotting purposes, we assume that one scale height corresponds to 800 km. The JWST data are consistent with the Spitzer points (within 2σ) when integrated over the broad bandpasses (indicated by the horizontal lines). The relative transit depths between the 3.6-µm and 4.5-µm channels are also consistent within 2σ between independent reductions of the JWST data, with most of the deviation coming from the 3.6-µm bandpass. Vertical error bars indicate 1σ uncertainties.
Fig. 3
Fig. 3. Interpretation of WASP-39b’s transmission spectrum.
Top: a comparison of the FIREFLy reduction and its 1σ uncertainties (labelled ‘Data’) to the best-fit ScCHIMERA theoretical model binned to the resolution of the data (blue curve; Methods). The key parameters of the model are 10-times solar metallicity, a carbon-to-oxygen ratio of 0.35 and cloud opacity of 7 × 10−3 cm2 g−1. The impact of the opacity sources expected from thermochemical equilibrium over the full bandpass are indicated by removing the opacity contribution from individual gases one at a time. As in Fig. 2, the axis on the right shows equivalent scale heights in WASP-39b’s atmosphere. Bottom: the molecular absorption cross-sections for each gas in the best-fit model. The model is well matched to the data (Χ2/Ndata = 1.3), suggesting that our assumptions broadly capture the important physics and chemistry in WASP-39b’s atmosphere. However, there is a feature near 4.0 µm that cannot be reproduced by the models used here. The strong CO2 absorption (4.1–4.6 µm) and the apparent lack of methane (3.0–3.5 µm) is what drives the solution to an elevated atmospheric metal enrichment, ruling out previous low-metallicity estimates. The other reductions and models give similar results.
Extended Data Fig. 1
Extended Data Fig. 1. Comparison of transmission spectrum modelling results from different codes for WASP-39b.
Despite different radiative–convective equilibrium and chemical solvers, treatments of clouds, grid spacing and grid-fitting approaches, all four grids arrive at the same 10-times solar metallicity point solution. Additionally, all four provide an acceptable fit to the data, with best-fitting Χ2/Ndata < 1.4.
Extended Data Fig. 2
Extended Data Fig. 2. Atmospheric structure arising from the best-fit model.
The thick red curve (and corresponding top x axis) shows the resulting 1D radiative–convective equilibrium temperature profile. The dashed lines (and bottom x axis) show the vertical gas mixing ratio profiles under the assumption of thermochemical equilibrium. These abundances, along with the absorption cross-sections shown in the bottom panel of Fig. 3, are what control the relative contributions of each gaseous opacity to the total transmission spectrum.
Extended Data Fig. 3
Extended Data Fig. 3. Assessment of the strength of spectral features for WASP-39b.
Residual features (blue data points) after subtracting the continuum best model (black ‘no CO2’ model curve in Fig. 3). A best-fitting ensemble of a two-component Gaussian model to both the CO2 feature and the unknown absorber feature (~4 µm) is shown in red.

Comment in

References

    1. Lodders K, Fegley B. Atmospheric chemistry in giant planets, brown dwarfs, and low-mass dwarf stars. I. Carbon, nitrogen, and oxygen. Icarus. 2002;155:393–424. doi: 10.1006/icar.2001.6740. - DOI
    1. Zahnle K, Marley MS, Freedman RS, Lodders K, Fortney JJ. Atmospheric sulfur photochemistry on hot Jupiters. Astrophys. J. Lett. 2009;701:L20–L24. doi: 10.1088/0004-637X/701/1/L20. - DOI
    1. Moses JI, et al. Compositional diversity in the atmospheres of hot Neptunes, with application to GJ 436b. Astrophys. J. 2013;777:34. doi: 10.1088/0004-637X/777/1/34. - DOI - PMC - PubMed
    1. Pollack JB, et al. Formation of the giant planets by concurrent accretion of solids and gas. Icarus. 1996;124:62–85. doi: 10.1006/icar.1996.0190. - DOI
    1. Fortney JJ, et al. A framework for characterizing the atmospheres of low-mass low-density transiting planets. Astrophys. J. 2013;775:80. doi: 10.1088/0004-637X/775/1/80. - DOI

Publication types