. 2022 Dec;102(6):1345-1358.
doi: 10.1016/j.kint.2022.07.033. Epub 2022 Aug 31.

Molecular programs associated with glomerular hyperfiltration in early diabetic kidney disease

Affiliations

Molecular programs associated with glomerular hyperfiltration in early diabetic kidney disease

Vidar T N Stefansson et al. Kidney Int. 2022 Dec.

Abstract

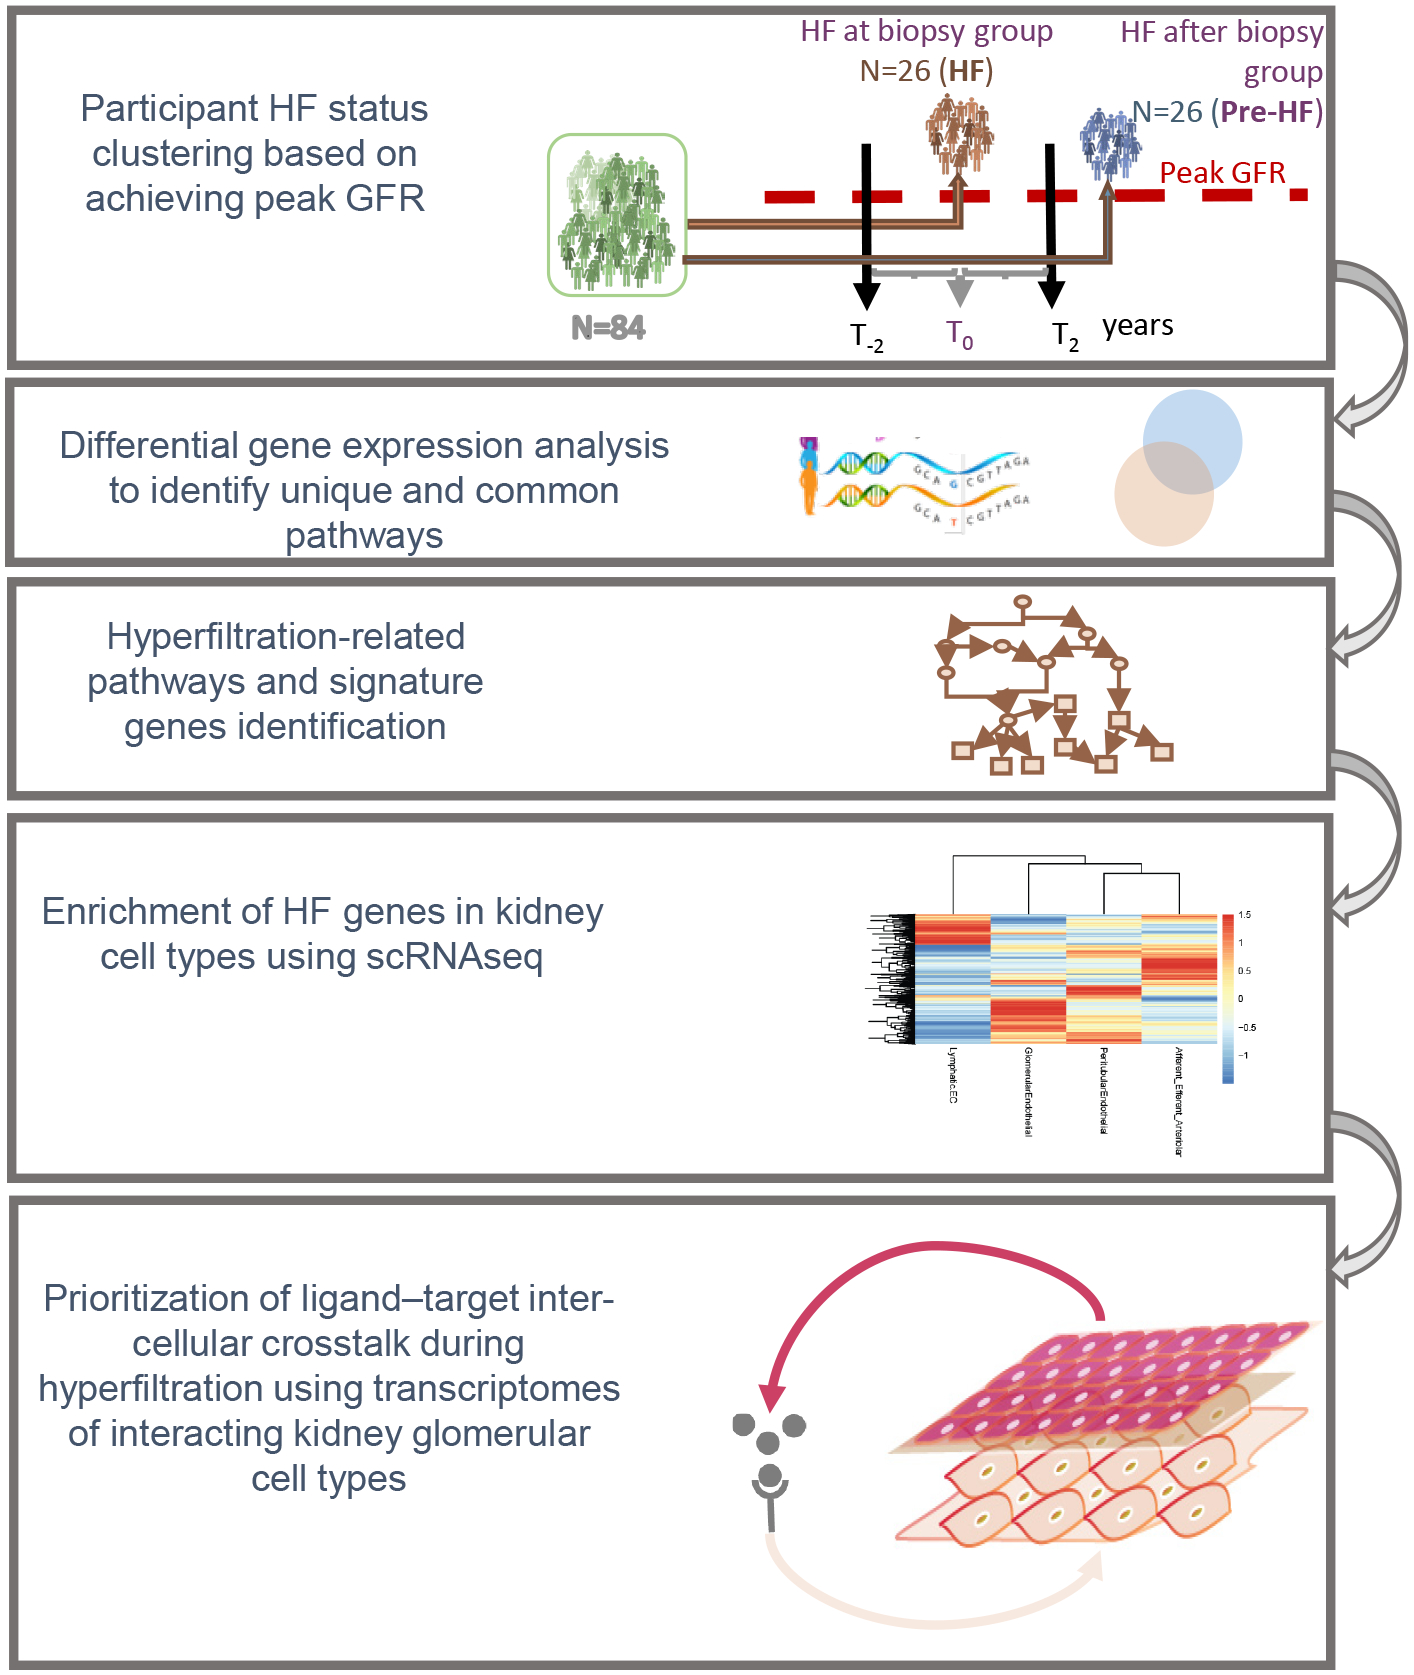
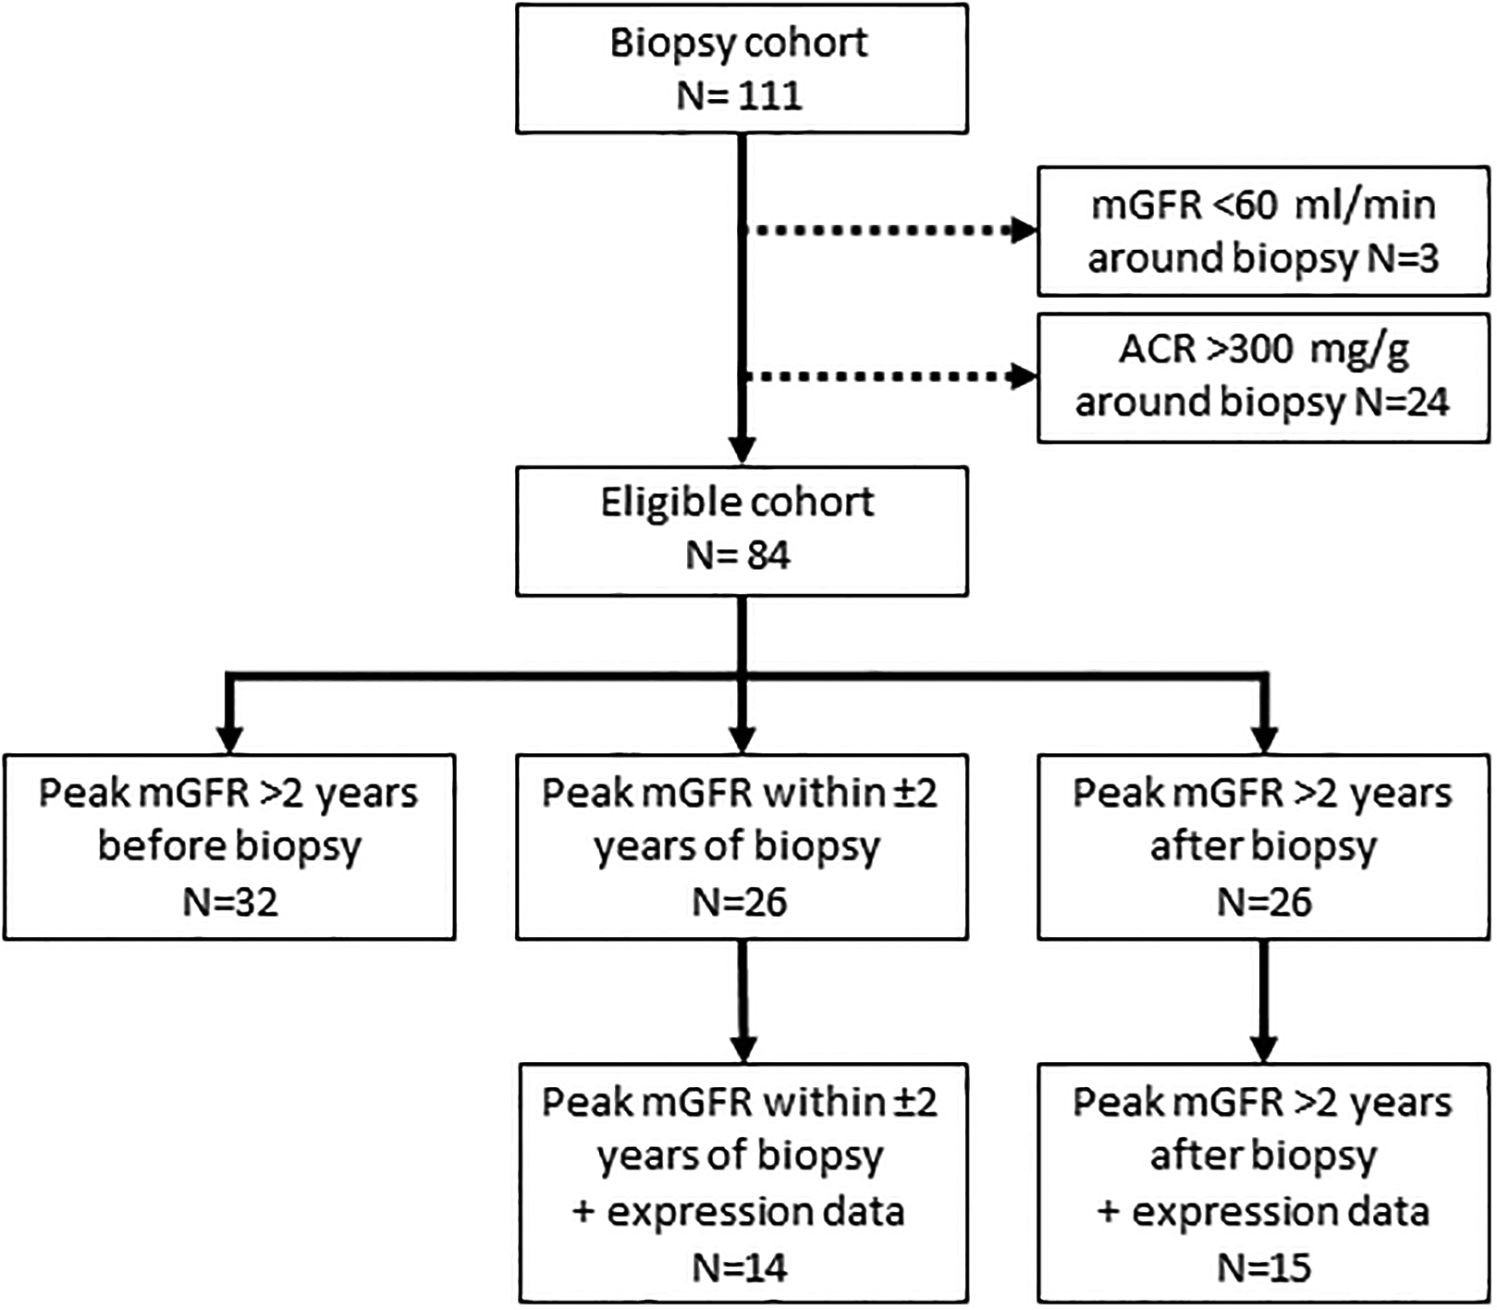
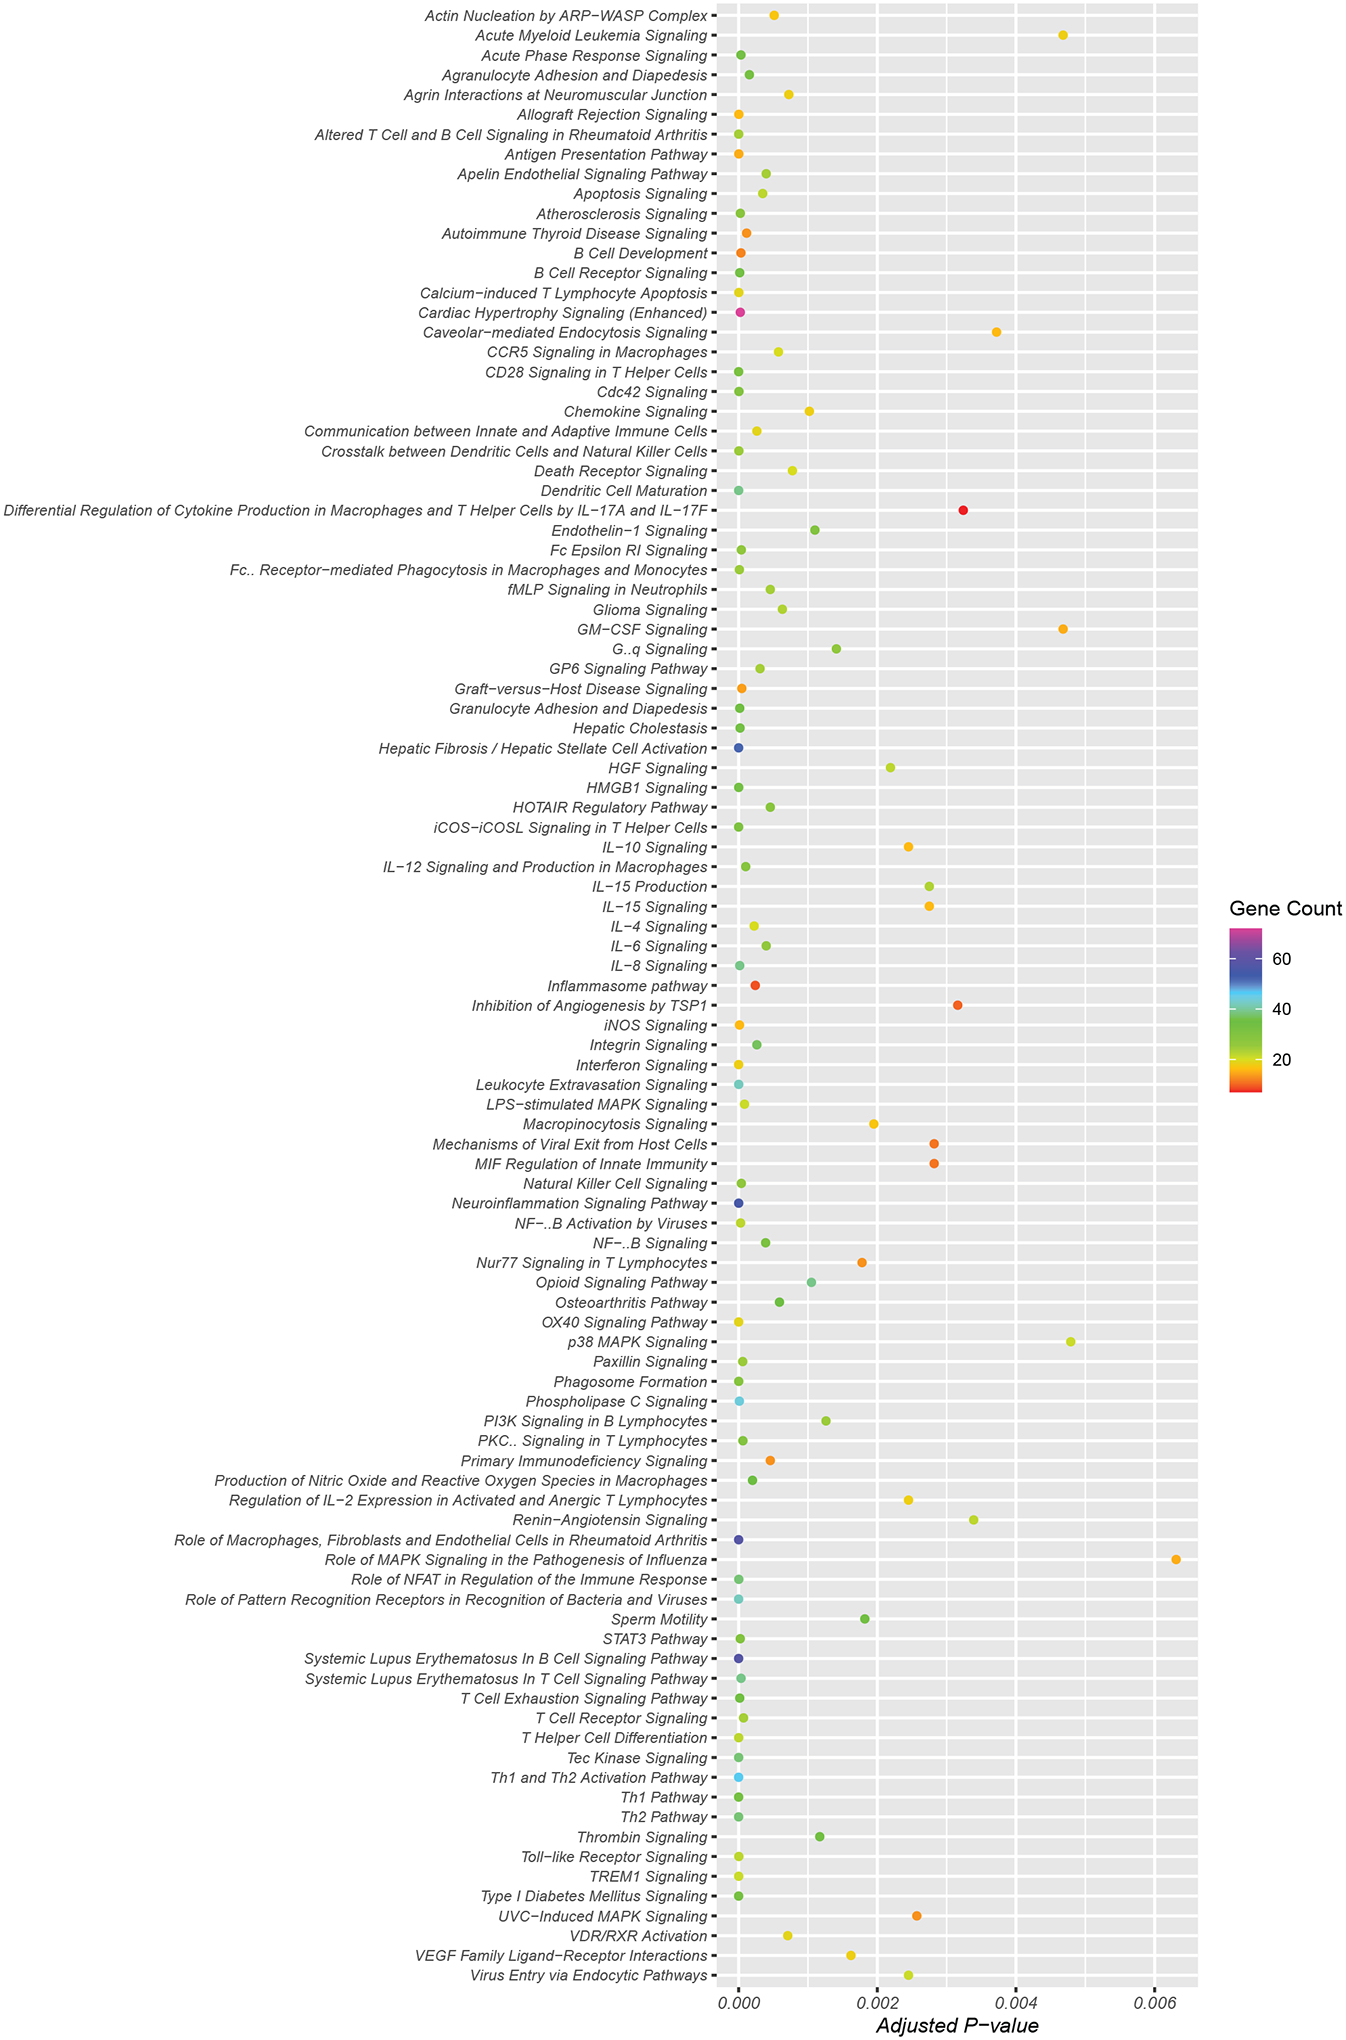
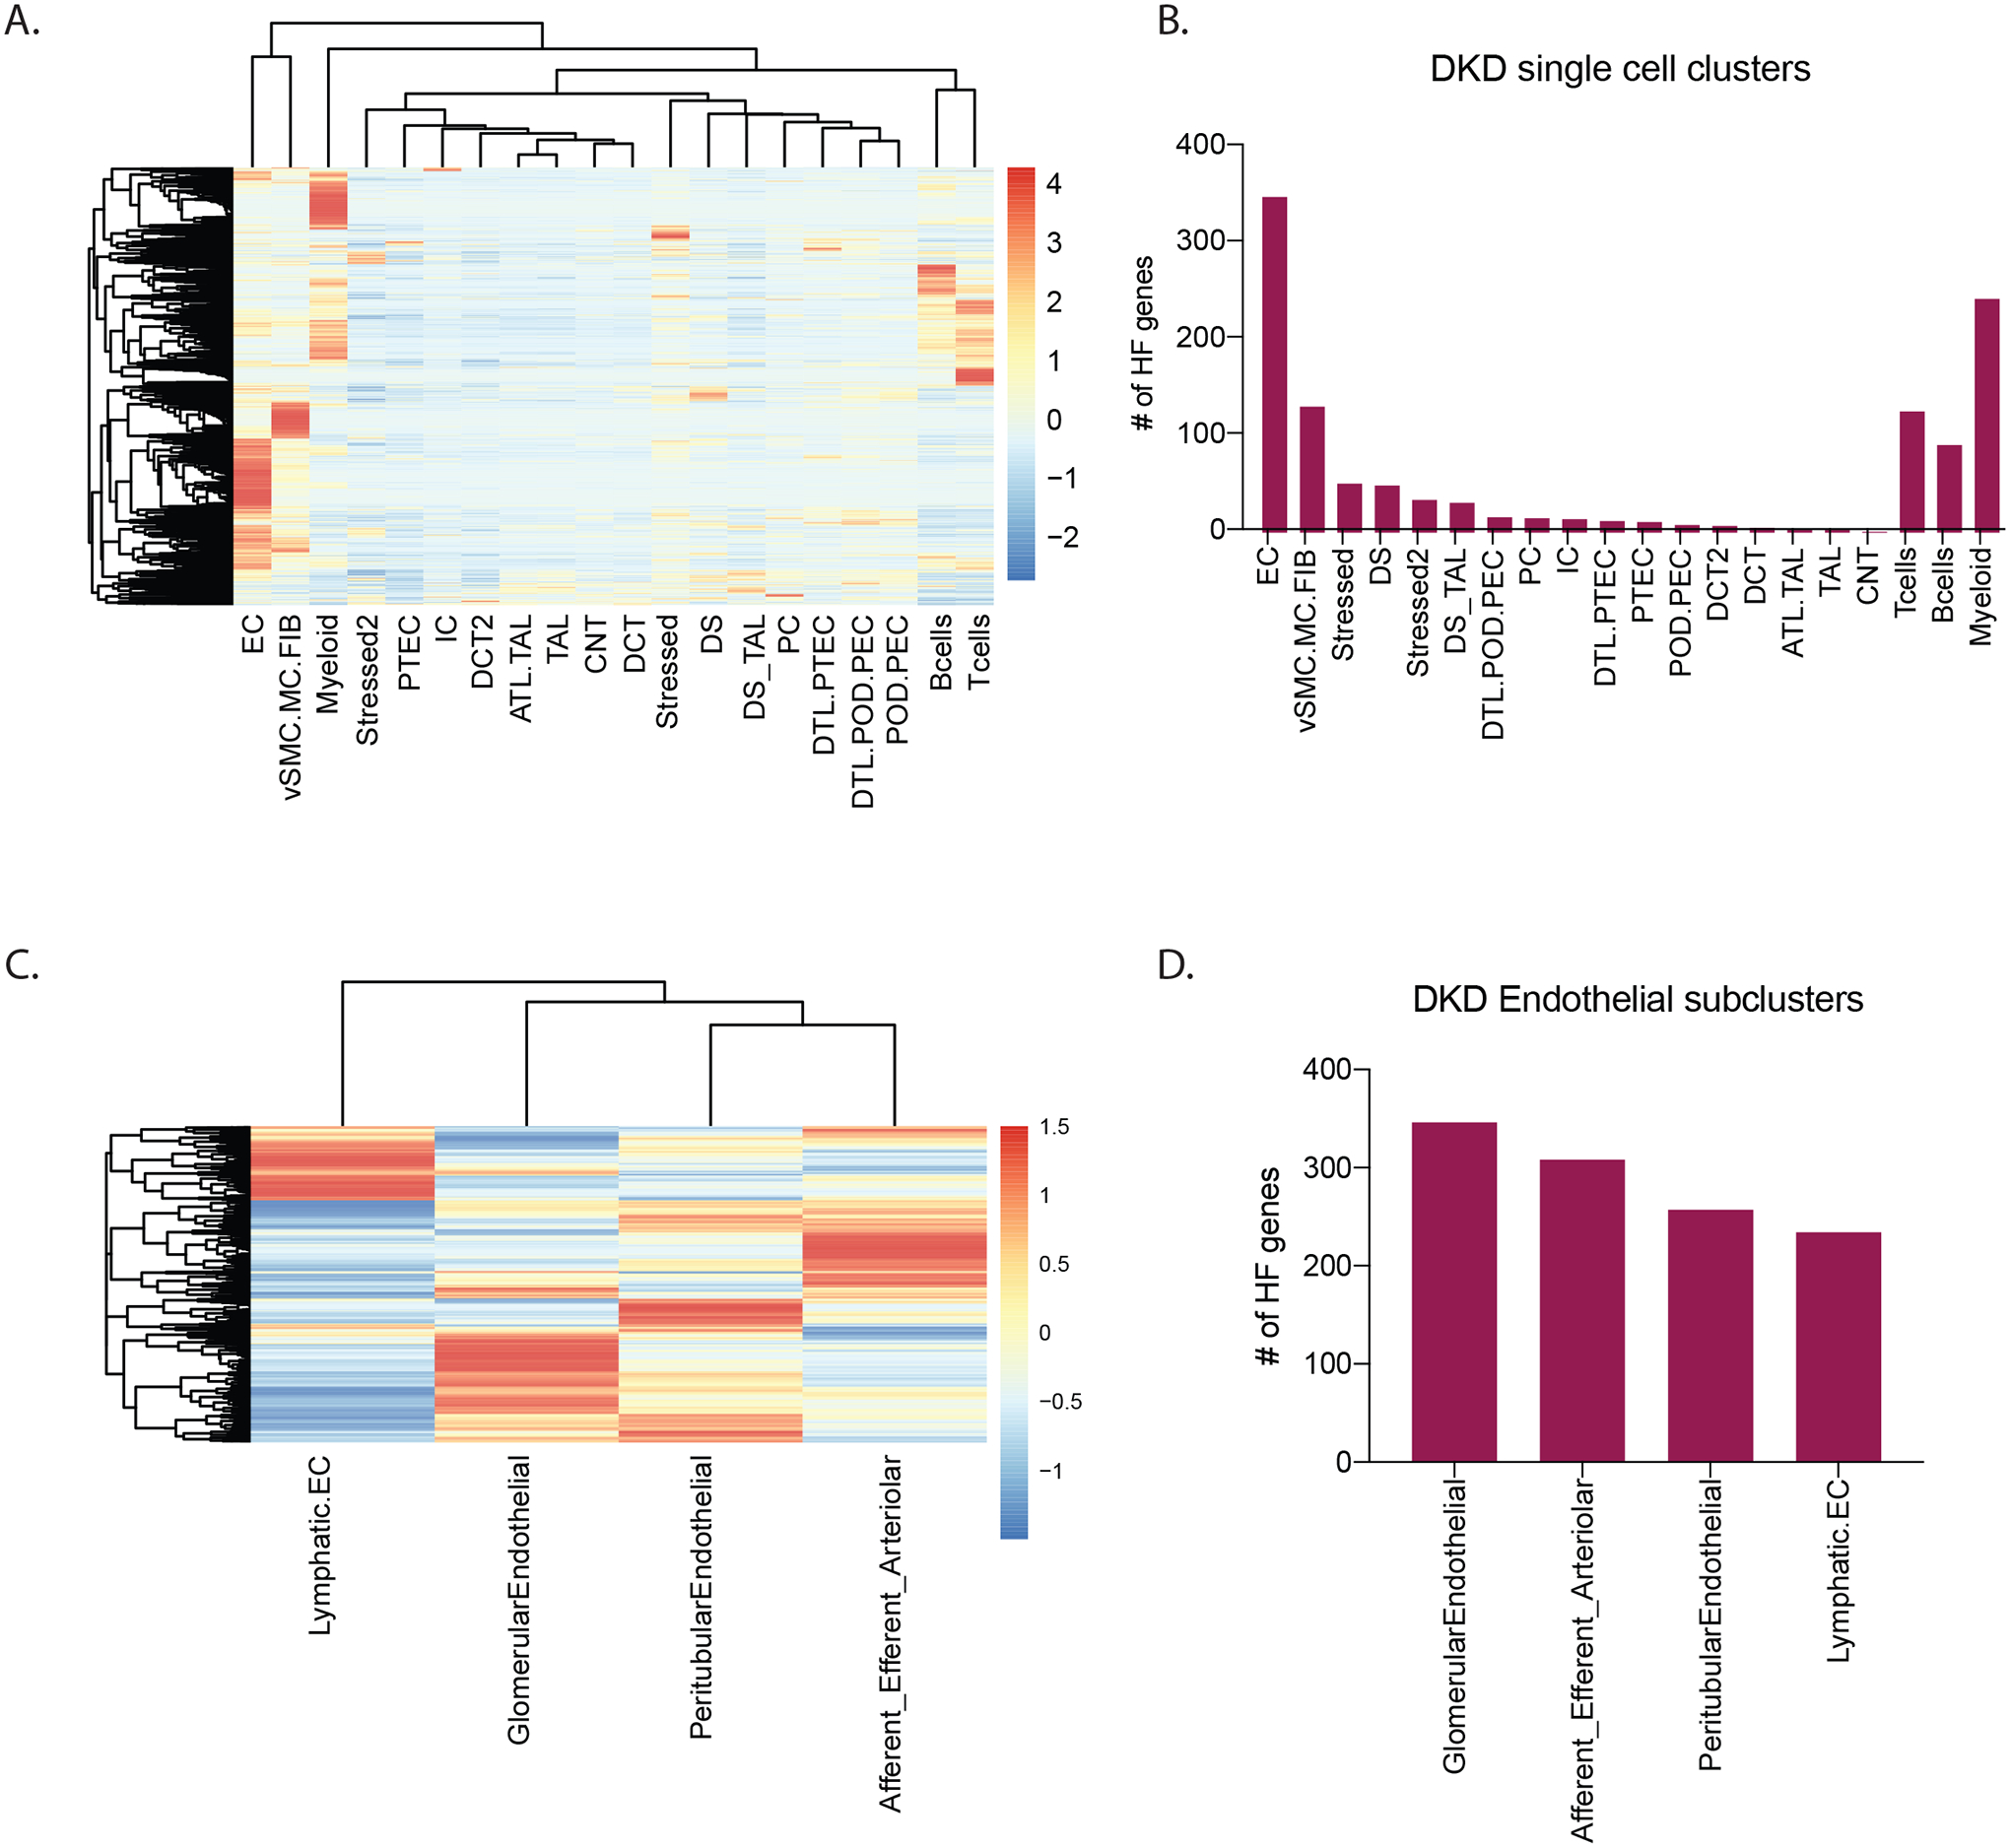
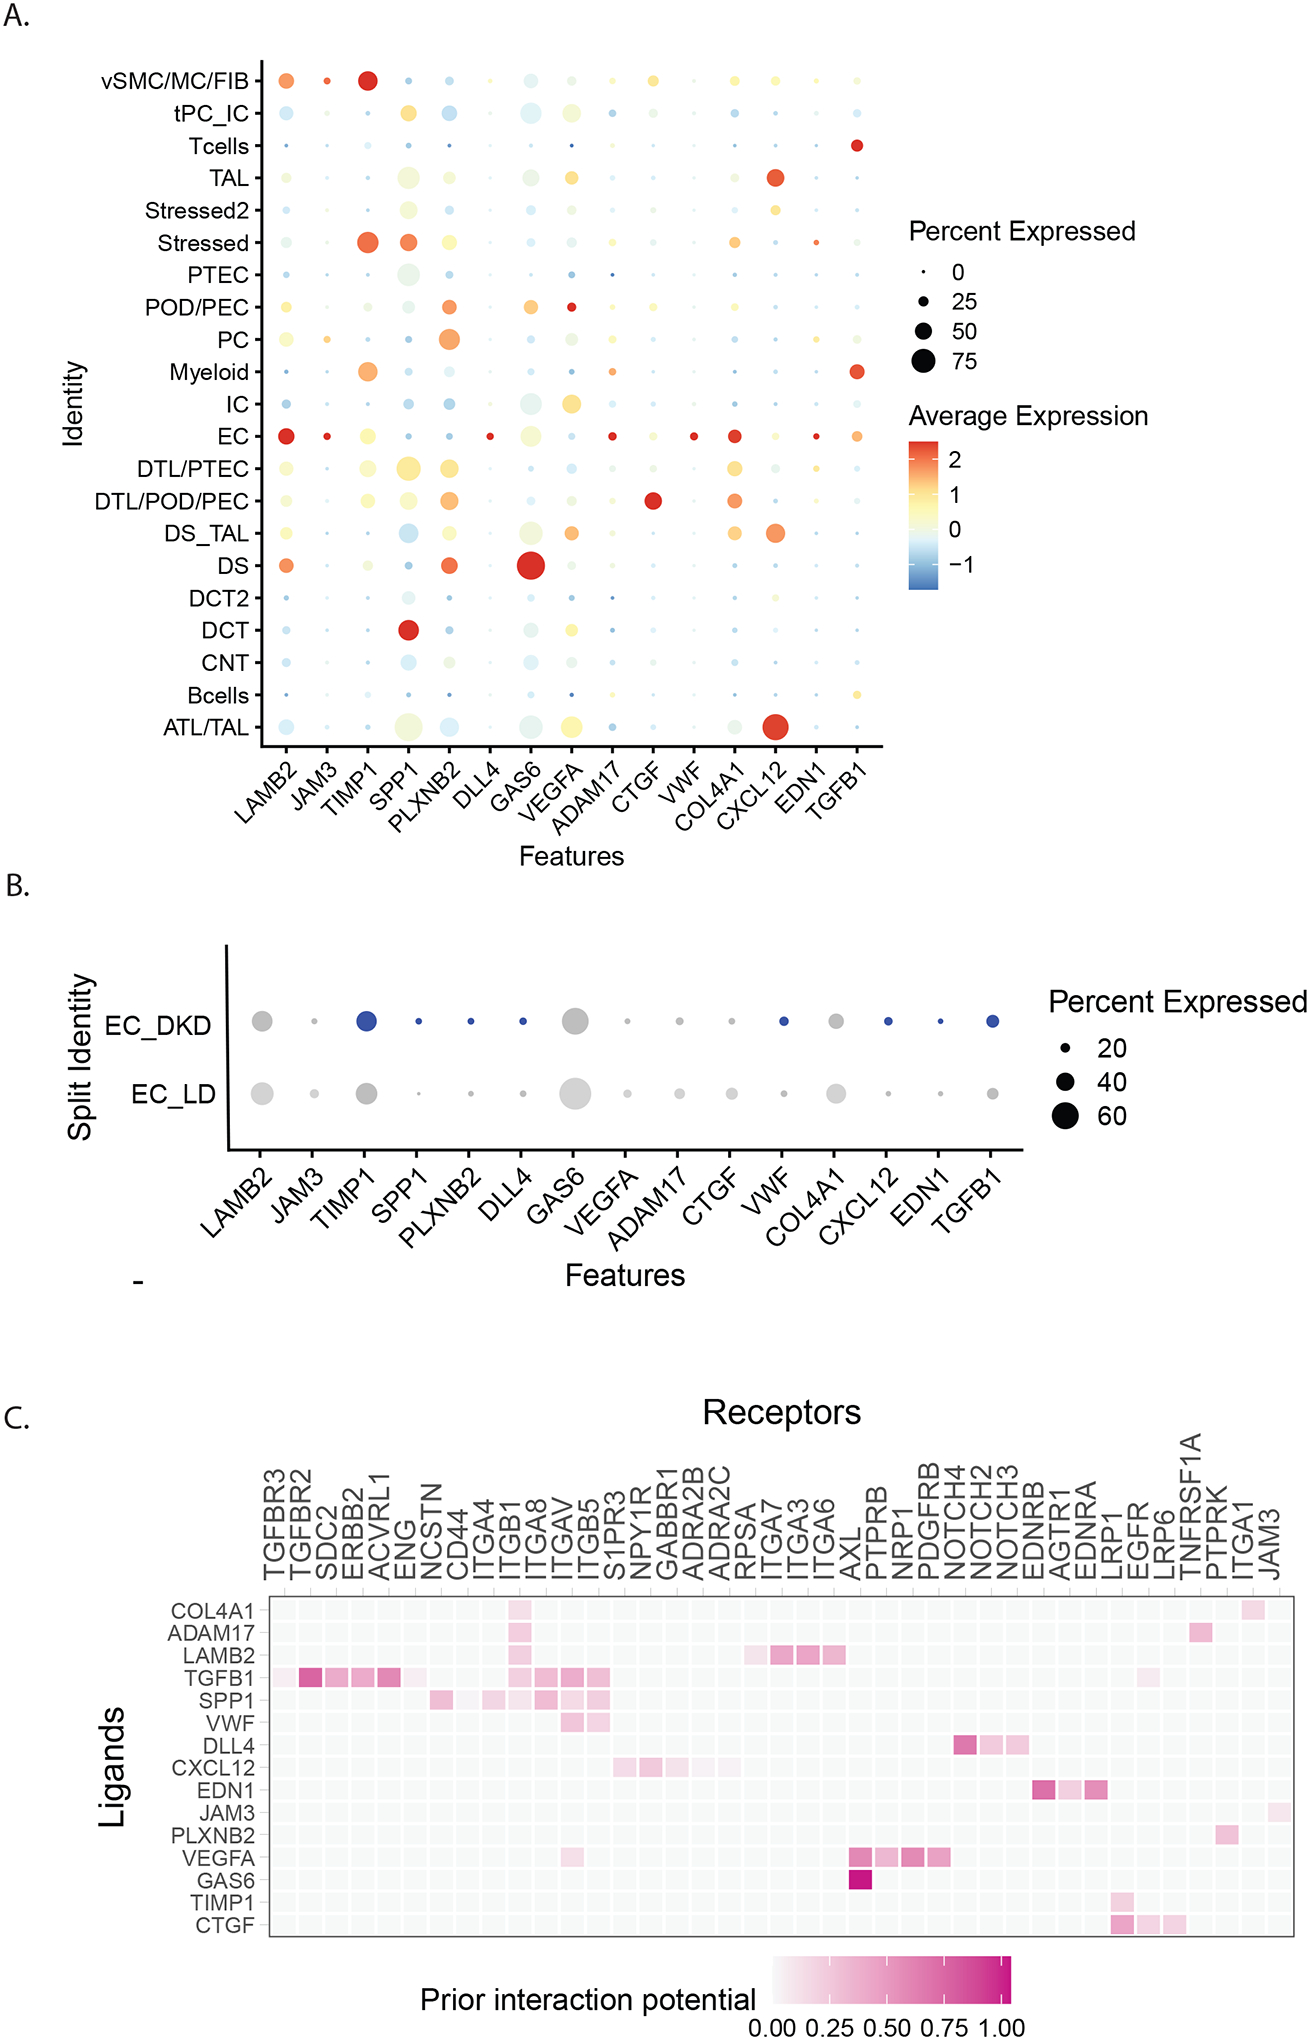
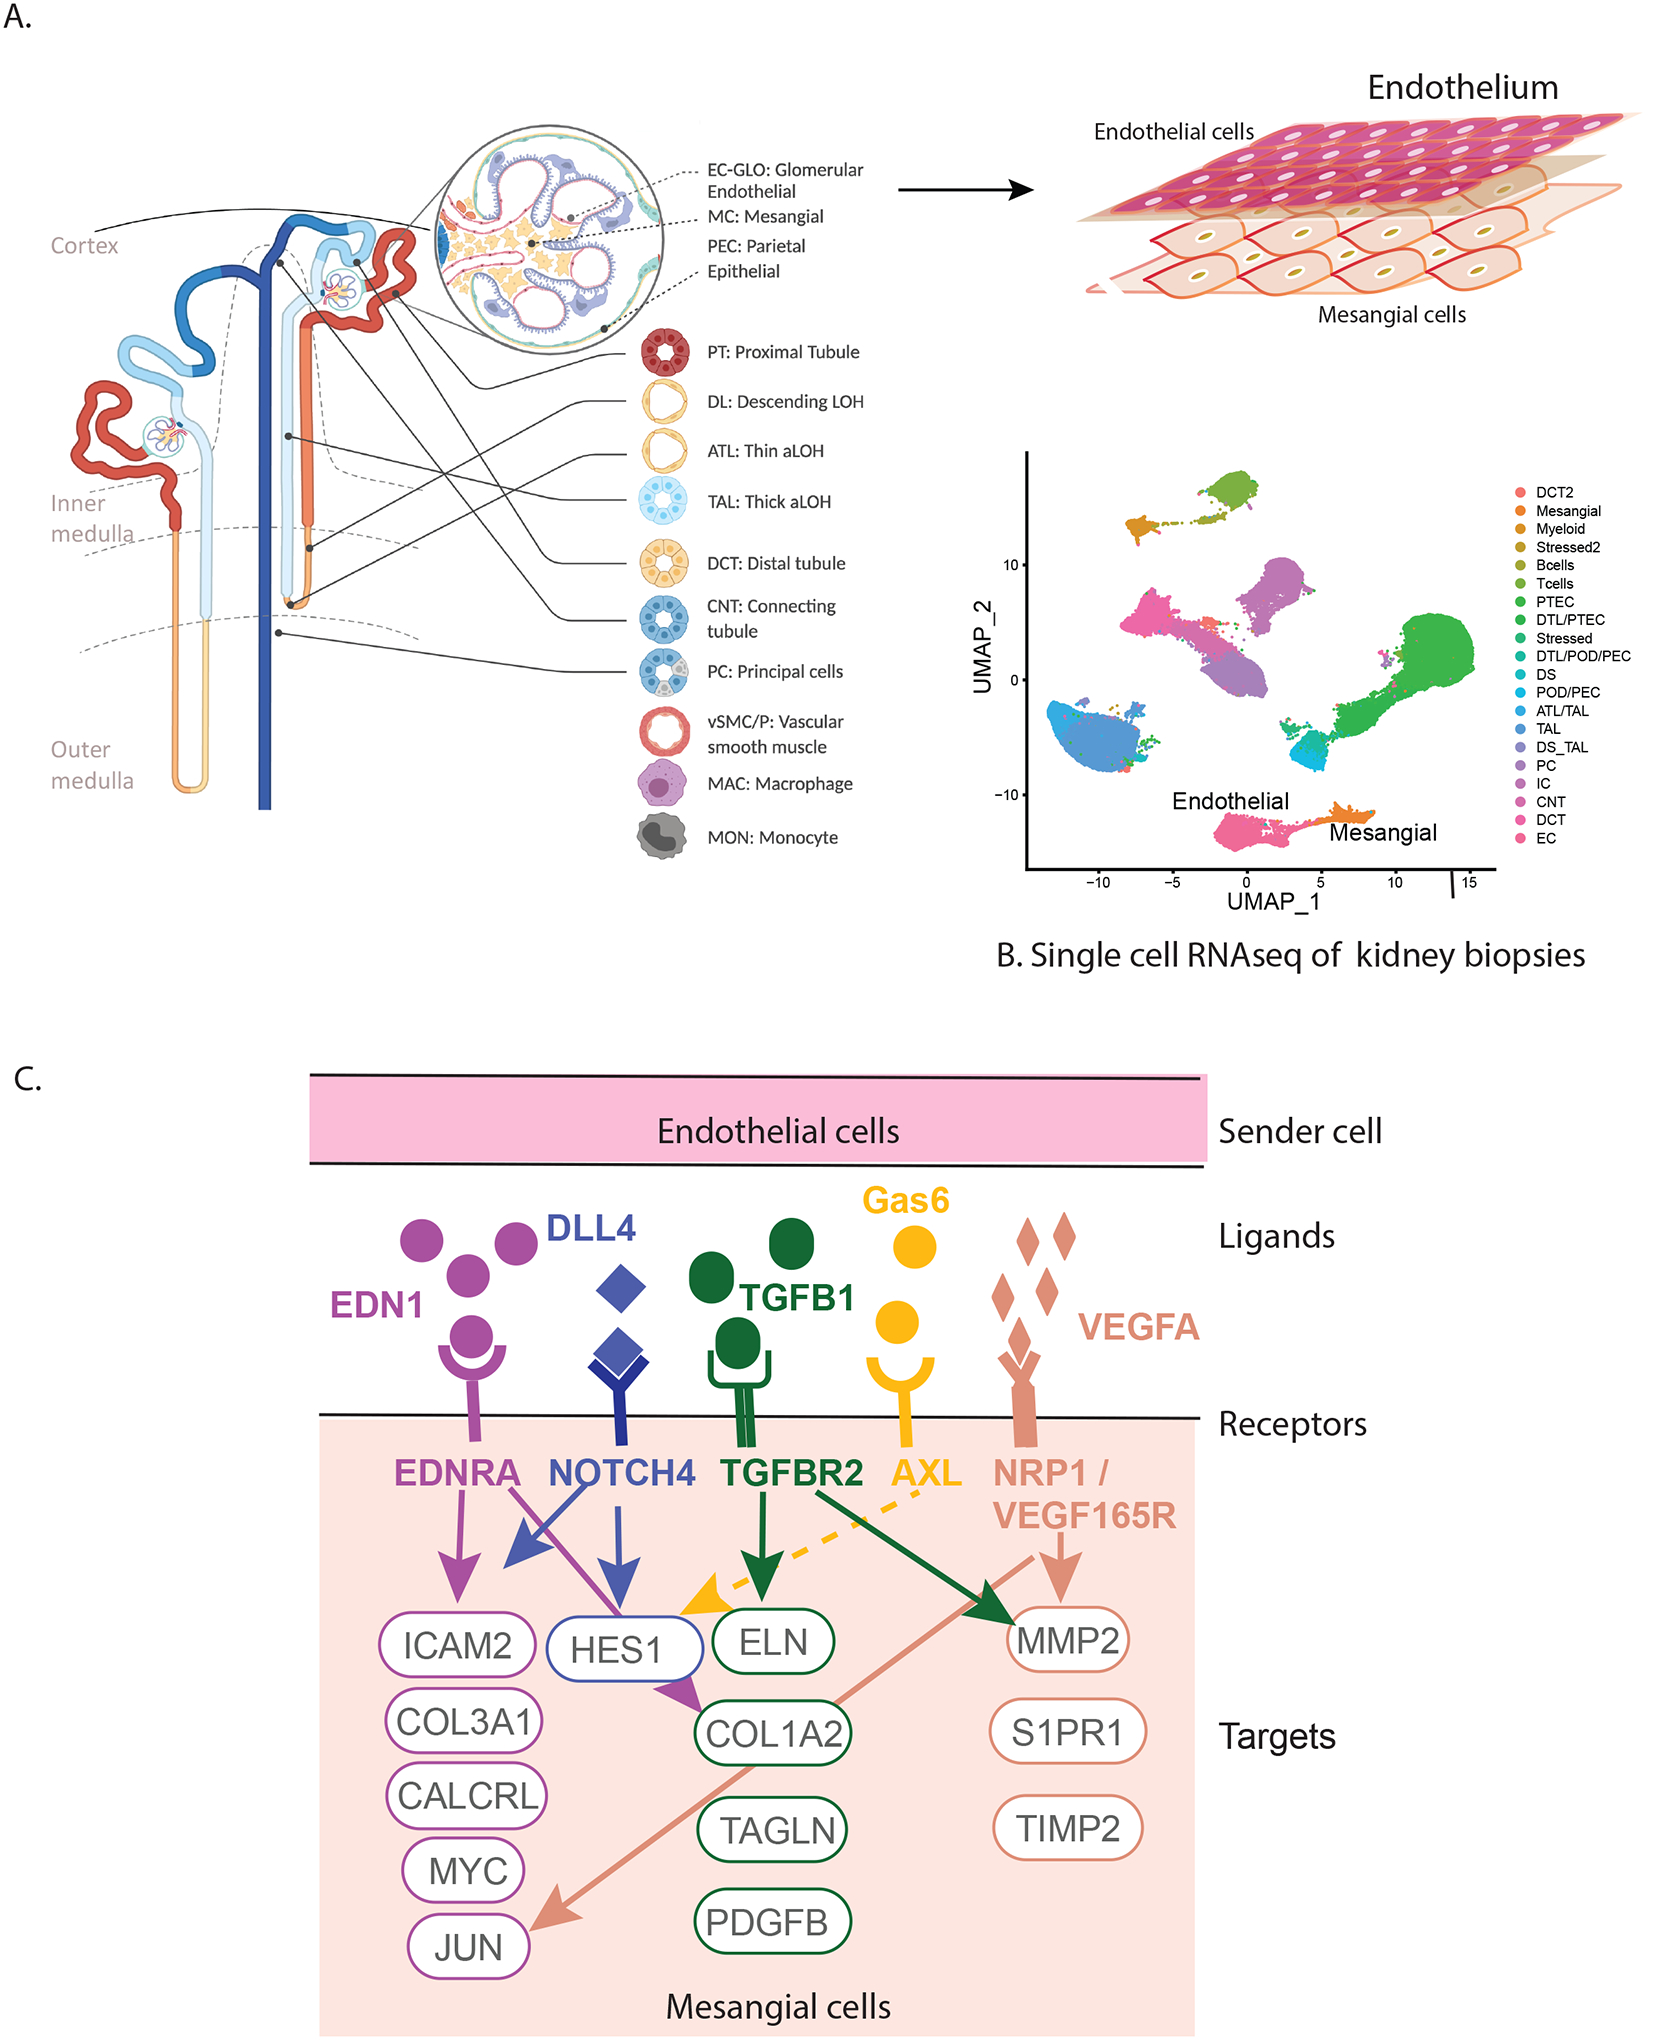
Hyperfiltration is a state of high glomerular filtration rate (GFR) observed in early diabetes that damages glomeruli, resulting in an iterative process of increasing filtration load on fewer and fewer remaining functional glomeruli. To delineate underlying cellular mechanisms of damage associated with hyperfiltration, transcriptional profiles of kidney biopsies from Pima Indians with type 2 diabetes with or without early-stage diabetic kidney disease were grouped into two hyperfiltration categories based on annual iothalamate GFR measurements. Twenty-six participants with a peak GFR measurement within two years of biopsy were categorized as the hyperfiltration group, and 26 in whom biopsy preceded peak GFR by over two years were considered pre-hyperfiltration. The hyperfiltration group had higher hemoglobin A1c, higher urine albumin-to-creatinine ratio, increased glomerular basement membrane width and lower podocyte density compared to the pre-hyperfiltration group. A glomerular 1240-gene transcriptional signature identified in the hyperfiltration group was enriched for endothelial stress response signaling genes, including endothelin-1, tec-kinase and transforming growth factor-β1 pathways, with the majority of the transcripts mapped to endothelial and inflammatory cell clusters in kidney single cell transcriptional data. Thus, our analysis reveals molecular pathomechanisms associated with hyperfiltration in early diabetic kidney disease involving putative ligand-receptor pairs with downstream intracellular targets linked to cellular crosstalk between endothelial and mesangial cells.

Keywords: diabetic nephropathy; gene expression; glomerulus; hyperfiltration; kidney biopsy.


Figures

Figure 1.
Figure 1.. Explanatory figure describing the analytical approach of the study.
Participants were clustered based on peak measured GFR and their kidney biopsy transcriptional profiles compared to identify HF related pathways and the specific cells in the kidney involved in HF related glomerular injury pathways.
Figure 2.
Figure 2.. Flow chart describing participant selection.
Participants, twenty-six each, in the HF group and pre-HF group were identified from those in the study cohort with a kidney biopsy (N=111), based on their peak GFR and in a subset with expression profiles.
Figure 3.
Figure 3.. HF associated modules and their eigengenes’ association with duration of diabetic kidney disease.
A. Cluster dendrogram of WGCNA based gene modules from glomerular transcription data from 29 participants. B. Three modules had ≥95% genes over-expressed in the HF group compared to pre-HF group. These modules were also significantly (*p<0.05, **p≤0.01) positively correlated with peak GFR at time of biopsy and negatively with mesangial cell volume (VVMC). Abbreviations: ME- modules; PeakGFRatBx – Peak GFR at kidney biopsy/HF group; HbA1c- Hemoglobin A1c; mGFR-measured glomerular filtration rate; uACR- urine albumin-to-creatinine ratio; VVMC - mesangial fractional volume per glomerulus; FPW- foot process width
Figure 4.
Figure 4.. Top 100 significantly enriched pathways represented in the HF gene set arranged alphabetically.
The top100 pathways encompassed by the HF genes were sorted based on adjusted p-values and plotted using the R package ggplot. The pathways in the figure are ordered alphabetically. The dots (Gene counts) are colored based on the number of pathway genes (purple >70; red <10) represented in the HF gene set and the x-axis describes membership of these genes in the corresponding pathway (adjusted p-values for all the genes in a dot)
Figure 5.
Figure 5.. Single cell RNAseq (scRNAseq) analyses.
A. Heatmap shows relative expression of HF genes in each of the cell type clusters derived from scRNAseq of kidney biopsies, with higher expression (red) of HF genes visualized in the endothelial cell (EC) cluster. B. Plot of the number of expressed HF genes in each scRNAseq cell type cluster also shows presence of more HF genes in the EC cluster. C. Heatmap shows expression profiles of HF genes and D. number of HF genes expressed in each EC subcluster. Number of genes in panels B and D were defined by their maximum average expression in each of the clusters. Each gene was assigned to only one cluster based on its maximum expression. Abbreviations: ATL-Ascending thin loop of Henle; CNT-Connecting tubule; DCT-Distal connecting tubule; DTL- Descending loop of Henle; EC- endothelial cells; IC- intercalated cells; MC-Mesangial Cell; PC- principal cells; PEC- Parietal epithelial cell: POD- Podocyte; PTEC- proximal tubular cells; TAL- thick ascending loop; vSMC-Vascular smooth muscle cells; Stressed/ Stressed 2-Clusters showing ribosomal/stress genes/ injury markers as top marker genes (Stressed cluster were akin to stressed proximal or descending loop of Henle cells whereas cells in the Stressed 2 cluster shared similarities with distal nephron cells.)
Figure 6.
Figure 6.. NicheNet Analysis of ligand receptor crosstalk.
NicheNetR (https://github.com/saeyslab/nichenetr) was used to identify ligand-receptor (LR) interactions that drive the observed expression changes in the single cell transcriptome. A. Expression of the top 15 nichenetR predicted ligands were compared across cell types. B. Several of these ligands are upregulated in DKD endothelial cells (EC_DKD) compared to endothelial cell of controls (EC_LD). The dot size represents the percentage of cells expressing the gene in the respective clusters and the color represent the intensity of the expression level from grey(low) to blue (high). C.Predicted ligand-receptor interaction for the top 15 ligands in the endothelial and mesangial cell. The interaction pairs are prioritized based on the weights derived from the ligand-receptor network from nichenet data sources. Abbreviations: ATL-Ascending thin loop of Henle; CNT-Connecting tubule; DCT-Distal connecting tubule; DTL- Descending loop of Henle; EC- endothelial cells; IC- intercalated cells; MC-Mesangial Cell; PC- principal cells; PEC- Parietal epithelial cell: POD- Podocyte; PTEC- proximal tubular cells; TAL- thick ascending loop; vSMC-Vascular smooth muscle cells; Stressed/ Stressed 2-Clusters showing ribosomal/stress genes/ injury markers as top marker genes (Stressed cluster were akin to stressed proximal or descending loop of Henle cells whereas cells in the Stressed 2 cluster shared similarities with distal nephron cells.)
Figure 7.
Figure 7.. Endothelial signaling activates intracellular targets in mesangial cells.
HF genes in the kidney are involved in the crosstalk between endothelial and mesangial cells in the glomerulus (A). The transcriptional profiles of these cell types in DKD could be distinguished using scRNAseq (B) leading to the identification of intracellular targets in mesangial cells (C) providing molecular insights into HF associated with early DKD.

Comment in

References

    1. System USRD. 2020. USRDS Annual Data Report: Epidemiology of kidney disease in the United States. National Institutes of Health, National Institute of Diabetes and Digestive and Kidney Diseases, Bethesda, MD.
    1. Ng M, Fleming T, Robinson M, et al. Global, regional, and national prevalence of overweight and obesity in children and adults during 1980–2013: a systematic analysis for the Global Burden of Disease Study 2013. Lancet 2014; 384: 766–781. - PMC - PubMed
    1. Brenner BM, Hostetter TH, Olson JL, et al. The role of glomerular hyperfiltration in the initiation and progression of diabetic nephropathy. Acta Endocrinol Suppl (Copenh) 1981; 242: 7–10. - PubMed
    1. Ruggenenti P, Porrini EL, Gaspari F, et al. Glomerular hyperfiltration and renal disease progression in type 2 diabetes. Diabetes Care 2012; 35: 2061–2068. - PMC - PubMed
    1. Nelson RG, Bennett PH, Beck GJ, et al. Development and progression of renal disease in Pima Indians with non-insulin-dependent diabetes mellitus. Diabetic Renal Disease Study Group. N Engl J Med 1996; 335: 1636–1642. - PubMed

Publication types

MeSH terms

Substances