. 2022 Sep 2;13(1):5172.
doi: 10.1038/s41467-022-32912-x.

Wireless charging-mediated angiogenesis and nerve repair by adaptable microporous hydrogels from conductive building blocks

Affiliations

Wireless charging-mediated angiogenesis and nerve repair by adaptable microporous hydrogels from conductive building blocks

Ru-Siou Hsu et al. Nat Commun. .

Abstract

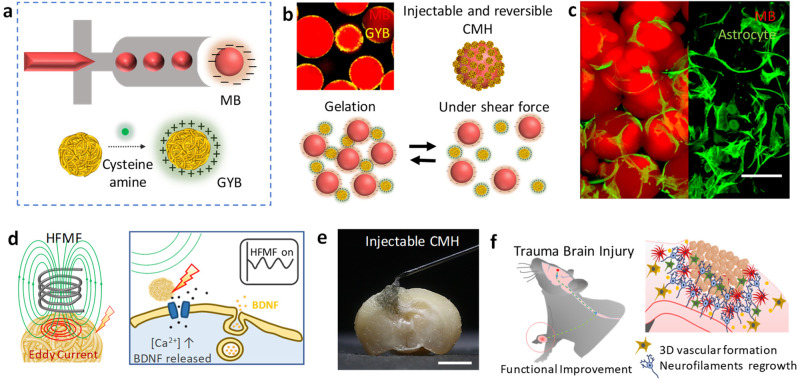
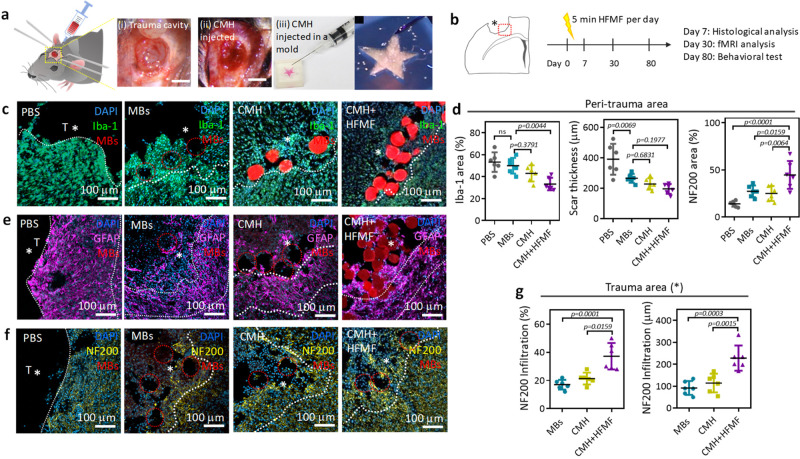
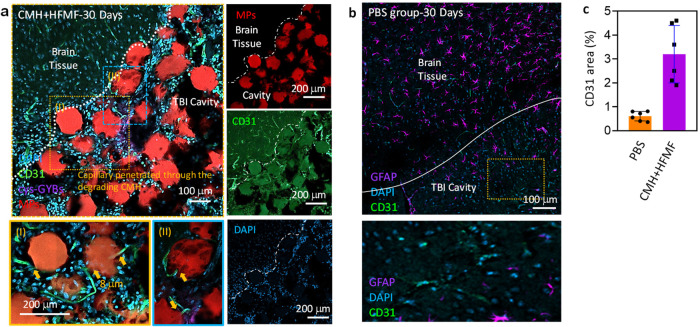
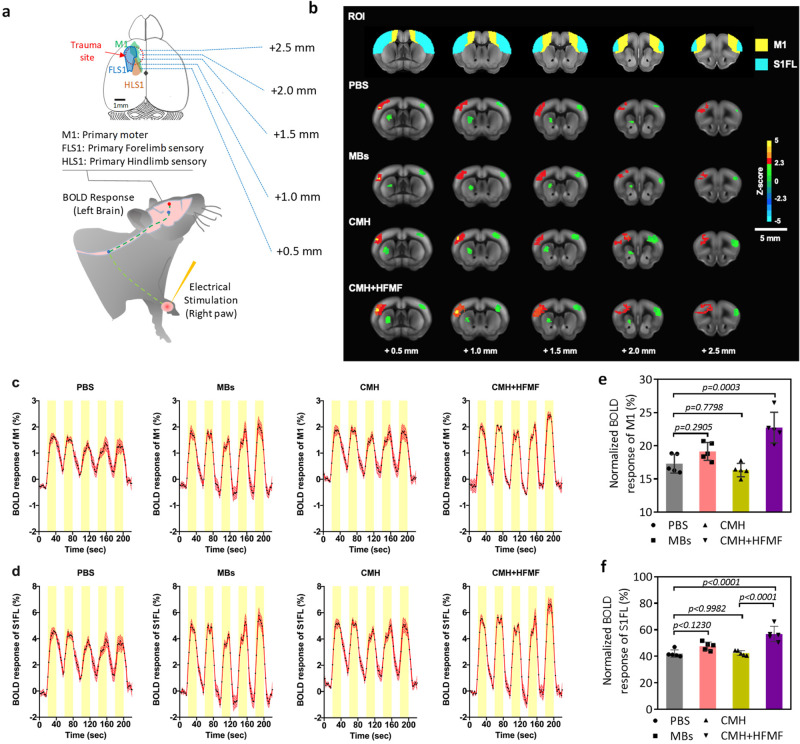
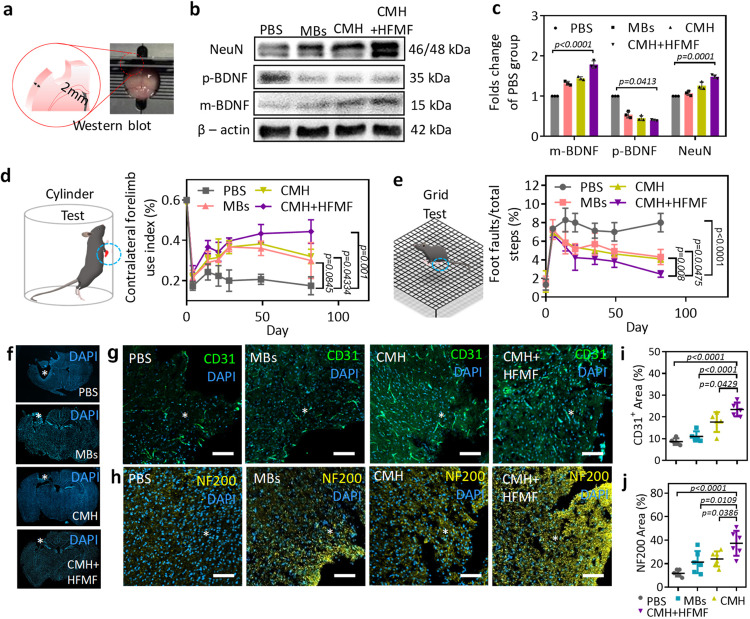
Traumatic brain injury causes inflammation and glial scarring that impede brain tissue repair, so stimulating angiogenesis and recovery of brain function remain challenging. Here we present an adaptable conductive microporous hydrogel consisting of gold nanoyarn balls-coated injectable building blocks possessing interconnected pores to improve angiogenesis and recovery of brain function in traumatic brain injury. We show that following minimally invasive implantation, the adaptable hydrogel is able to fill defects with complex shapes and regulate the traumatic brain injury environment in a mouse model. We find that placement of this injectable hydrogel at peri-trauma regions enhances mature brain-derived neurotrophic factor by 180% and improves angiogenesis by 250% in vivo within 2 weeks after electromagnetized stimulation, and that these effects facilitate neuron survival and motor function recovery by 50%. We use blood oxygenation level-dependent functional neuroimaging to reveal the successful restoration of functional brain connectivity in the corticostriatal and corticolimbic circuits.


Conflict of interest statement

The authors declare no competing interests.

Figures

Fig. 1
Fig. 1. Formation of an adaptable conductive microporous hydrogel (CMH).
a Schematic illustration of monodispersed gelatin methacrylamide (GelMA) injectable building blocks (microbeads, MBs) formation (upper); the process of synthesizing cys-GYB (lower). b Schematic illustration of injectable and reversible CMH. c Fluorescence image of a cell-laden micronetwork scaffold. Scale bar: 100 μm. d Schematic illustration of eddy current induced by HFMF (left) and promote BDNF releasing (right). e A photograph image represents the characteristic of injectable CMH into irregular cavity. Scale bar: 1.5 mm. f Schematic illustration of CMH with an electrical stimulation and axonal neurofiliments regrow in vivo.
Fig. 2
Fig. 2. Preparation and characterization of conductive microporous hydrogel (CMH).
a Schematic illustration of synthesis of cys-GYBs. b Scanning electron microscopy (SEM) images of GYBs and cys-GYBs. c TEM images of cys-GYBs and distribution of the elemental mapping of Au, S and N. de The surface charge of GYBs and cys-GYBs and zeta-potential measurements. Error bars represent mean ± s.d., n  =  5. HRXPS analysis of GYBs and cys-GYBs via (f) Au4f signal and (g) S2p signal. h Microscope image of the device generating GelMA droplets. i Zeta potential of gelatin and GelMA. Error bars represent mean ± s.d., n  =  5. j Compressive modulus of GelMA at various concentration. Error bars represent mean ± s.d., n  =  4. k Droplet size distribution of MBs in water and in oil. l Fluorescence images show the beads (red) with cys-GYBs (yellow) for visualization at different volume ratios. Scale bar: 100 μm. m Schematic of conductive microporous hydrogel. Blue line describes the proposed electron (e) transfer passing through each CMH. n Electrical conductivity in the various hydrogels (n = 6, mean ± s.d., one-way ANOVA with Tukey’s multiple-comparison test). o Output currents on various materials generated by HFMF with on/off control.
Fig. 3
Fig. 3. Rheological characterization of self-healing behavior of CMH.
a Storage (G′) modulus and (b) tan (G”/G’) of CMH as a function of cys-GYBs-to-MBs ratio (mg/ml). Error bars represent mean ± s.d., n  =  5. c The gelation of CMH at various cys-GYBs-to-MBs ratios. d The damage-healing property of CMH demonstrated by the continuous step strain (1% strain→500% strain→1% strain) measurements at 37 °C. e CMH was modulable to macroscale shapes in a TBI cavity.
Fig. 4
Fig. 4. Electromagnetized cys-GYBs stimulate neuron differentiation.
a Cell viability of NSCs, N2A cells and astrocytes treated with different concentrations of cys-GYBs. Error bars represent mean ± s.d., n  =  5. b Cell viability of NSCs, N2A cells and astrocytes treated with 100 μg/ml cys-GYBs with or without HFMF exposure. Error bars represent mean ± s.d., n  =  5. c Fluorescence photomicrographs showing the phenotypes of the cells that differentiated from embryonic cerebral cortical neurospheres after 7 days in culture. Anti-MAP-2 (purple) and anti-GFAP (green) antibodies show the immunoreaction of differentiated neurons and astrocytes, respectively. d Magnified images of the GYB + HFMF group. e Quantification of the percentage of differentiation into neurons and astrocytes from neurospheres. Error bars represent mean ± s.d., n  =  5. f Quantification of the number of migrated cells in the migrated zone. The cells were cultured under serum-free conditions at 250 neurospheres per cm2 for 7 days. Data represent the mean ± SD (n = 4 per group). ***p < 0.005 compared with the PBS group by one-way ANOVA with Tukey’s multiple-comparison test. Scar bars: 100 mm.
Fig. 5
Fig. 5. Animal study.
a Images of the TBI cavity before and after implanting the CMH scaffold (left panel). Images of CMH injected into a star-shaped mold via a syringe (right panel). b Schematic of the in vivo experimental timeline, including the sacrifice and analysis time points. c Fluorescence images of Iba-1 immunostaining after treatment with PBS, MB, CMH, and CMH + HFMF. d Analysis of Iba-1, scar thickness and NF200-positive responses at peri-trauma areas (n = 6, mean ± s.d., one-way ANOVA with Tukey’s multiple-comparison test). Fluorescence images of (e) GFAP and (f) NF200 immunostaining after various treatments. g Analysis of the NF200-positive responses and infiltration distance in the trauma area. (n = 6, mean ± s.d., one-way ANOVA with Tukey’s multiple-comparison test).
Fig. 6
Fig. 6. Endothelial cells (ECs) infiltrated and ingrowthed within channel network hydrogels from 30 days implantation in mouse.
Fluorescence images of blood vessels (CD31) in green), nucleic (DAPI) in blue and MBs (RITC) in red around the trauma site at 30 days postsurgery. a ECs lining a microchannel network in vivo after treated by cys-GMH + HFMF group (I and II: a cross-section view of EC-lined channel). Scale bar = 150 µm. b The fluorescence images of control group. c Quantification of CD31 area of images at TBI cavity Error bars represent mean ± s.d., n  =  6.
Fig. 7
Fig. 7. Blood-oxygenation level-dependent (BOLD) fMRI activation maps during contralateral forepaw stimulation.
a Illustration of the experimental design. Activation was triggered by electrical stimulation of the right forepaw 30 days after TBI. b Comparison of activation Z-maps obtained by group-level BOLD contrasts in the treated groups of PBS (n = 6), MBs (n = 6), CMH (n = 6) and CMH + HFMF (n = 6), respectively, superimposed on corresponding high-resolution RARE T2 images. Visualization of activation Z-maps displayed at z- threshold free and their activity in voxels within the red boundary reached the significant level threshold at Z > 2.3 (p < 0.05). Mean time courses of relative BOLD responses in contralateral (c) M1 and (d) S1FL in response to forepaw stimulation each group. The intervals of electrical stimuli are represented by yellow boxes with five repetitions. Data are represented as mean ± SEM. The average number of activated pixels across all slices representing ipsilateral (e) M1 and (f) S1FL, respectively. (n = 6, mean ± s.d., one-way ANOVA with a Tukey’s multiple-comparison test).
Fig. 8
Fig. 8. Western blot analysis and post-TBI neurological recovery and axonal sprouting.
a Tissue slice of trauma area of ipsilateral brain slice with 2 mm. b Western blot analysis of brain. β-actin was selected as the internal control with a protein weight of 42 kDa; the values of m-BDNF and p-BDNF were 15 and 35 kDa, respectively. NeuN was 46 and 48 KDa, respectively. c The quantitative results of proteins are expressed as the ratio of densitometries of m-BDNF, p-BDNF and NeuN to β-actin bands. Error bars represent mean ± s.d., n  =  6, one-way ANOVA with a Tukey’s post-hoc test. d The cylinder test to evaluate the dexterity of their contralateral forelimb. Error bars represent mean ± s.d., n  = 6, one-way ANOVA with a Tukey’s post-hoc test). e The grid test for the contralateral hindlimb normally sensitive to post-TBI lateralized impairments. Error bars represent mean ± s.d., n  =  6, one-way ANOVA with a Tukey’s post-hoc test). f Representative brain images illustrated cavity of tissue loss (white circle) in mice at 82 days postinjury. Fluorescent images of (g) endothelial cells (CD31) and (h) axonal neurofilaments (NF200) around the TBI site (*) at 60 days postinjury. Quantification of the (i) vessels (CD31) and (j) axonal area (NF200) in the ipsilateral peri-trauma cortex at 60 days after TBI. Error bars represent mean ± s.d., n  = 6, one-way ANOVA with a Tukey’s post-hoc test). Scar bars: 100 μm.

References

    1. Badhiwala JH, Wilson JR, Hehlings MG. Global burden of traumatic brain and spinal cord injury. Lancet Neurol. 2019;18:24–25. doi: 10.1016/S1474-4422(18)30444-7. - DOI - PubMed
    1. Graham NS. Understanding neurodegeneration after traumatic brain injury: from mechanisms to clinical trials in dementia. J. Neurol. Neurosurg. Psychiatry. 2019;90:1221–1233. doi: 10.1136/jnnp-2017-317557. - DOI - PMC - PubMed
    1. Bai W, et al. Bioresorbable photonic devices for the spectroscopic characterization of physiological status and neural activity. Nat. Biomed. Eng. 2019;3:644–654. doi: 10.1038/s41551-019-0435-y. - DOI - PubMed
    1. Möller K, et al. rterial hypertension aggravates innate immune responses after experimental stroke. Front Cell Neurosci. 2015;9:461. doi: 10.3389/fncel.2015.00461. - DOI - PMC - PubMed
    1. Kim, J., et al. Fungal brain infection modelled in a human-neurovascular-unit-on-a-chip with a functional blood–brain barrier. Nat. Biomed. Eng. 10.1038/s41551-021-00743-8 (2021). - PubMed

Publication types