. 2022 Sep 2;13(1):5176.
doi: 10.1038/s41467-022-32704-3.

Early warning signal for a tipping point suggested by a millennial Atlantic Multidecadal Variability reconstruction

Affiliations

Early warning signal for a tipping point suggested by a millennial Atlantic Multidecadal Variability reconstruction

Simon L L Michel et al. Nat Commun. .

Abstract

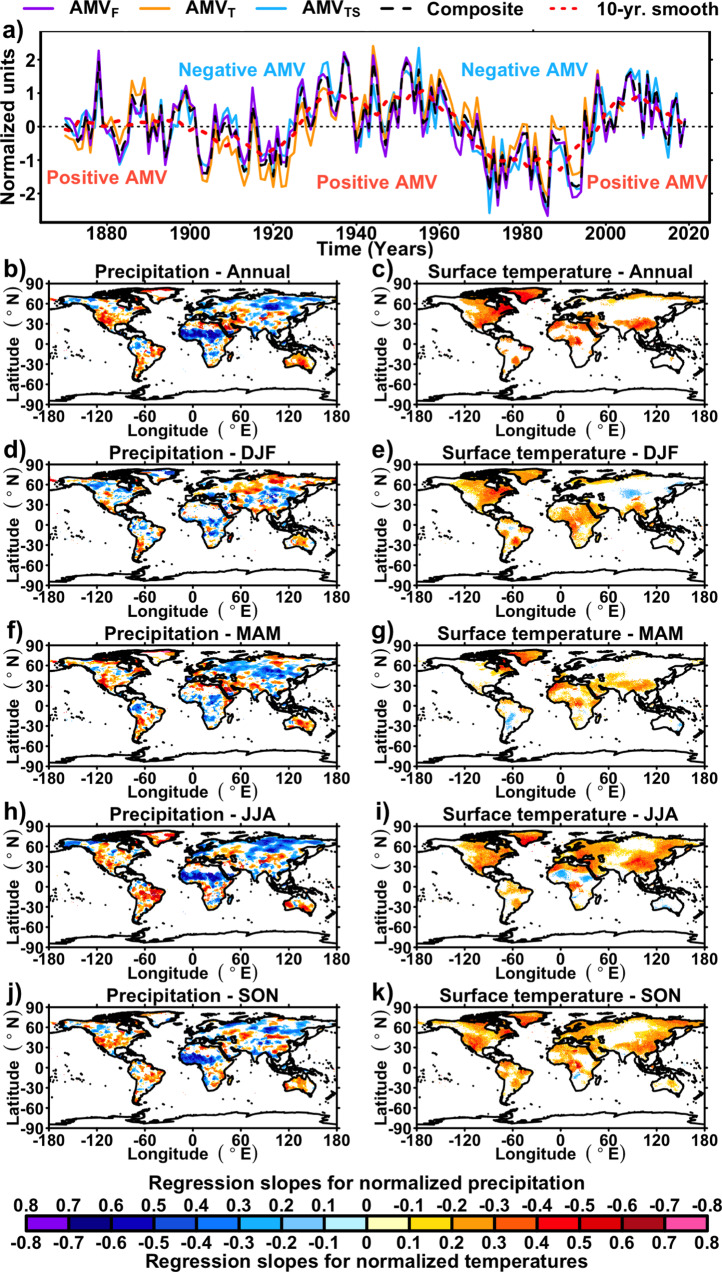
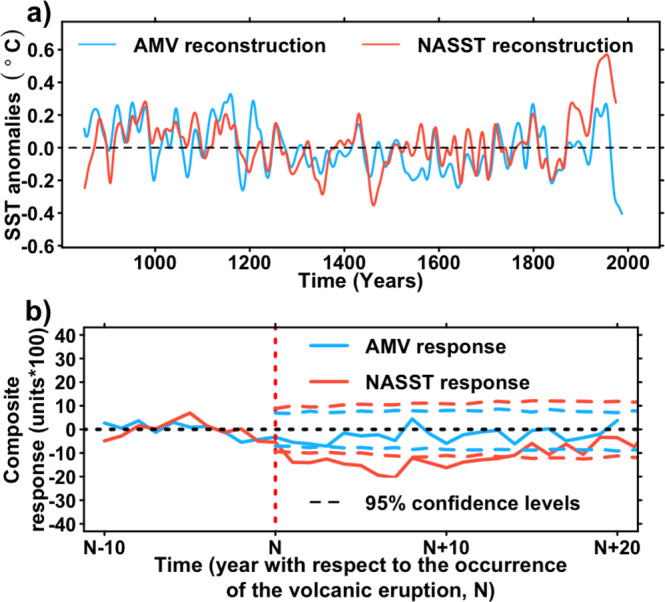
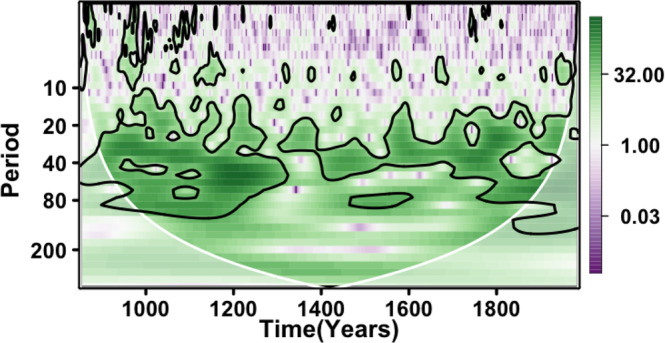
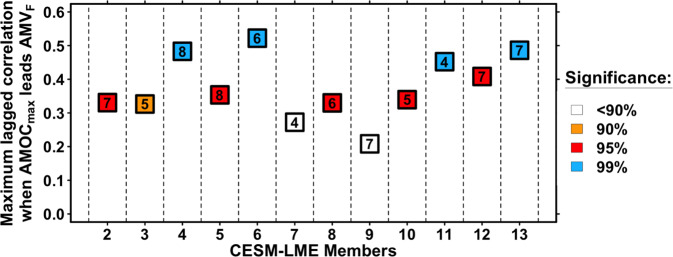
Atlantic multidecadal variability is a coherent mode of natural climate variability occurring in the North Atlantic Ocean, with strong impacts on human societies and ecosystems worldwide. However, its periodicity and drivers are widely debated due to the short temporal extent of instrumental observations and competing effects of both internal and external climate factors acting on North Atlantic surface temperature variability. Here, we use a paleoclimate database and an advanced statistical framework to generate, evaluate, and compare 312 reconstructions of the Atlantic multidecadal variability over the past millennium, based on different indices and regression methods. From this process, the best reconstruction is obtained with the random forest method, and its robustness is checked using climate model outputs and independent oceanic paleoclimate data. This reconstruction shows that memory in variations of Atlantic multidecadal variability have strongly increased recently-a potential early warning signal for the approach of a North Atlantic tipping point.


Conflict of interest statement

The authors declare no competing interests.

Figures

Fig. 1
Fig. 1. Climate impacts of the Atlantic multidecadal Variability (AMV) over the historical era.
a Historical evolution of AMV indices investigated in this study for the period 1870–2017 calculated using the HadISST dataset (“Methods”). b, d, f, h, j Maps of averaged regression coefficients between the 10-years smoothed composite of the three AMV indices from panel a and CRU TS4 precipitation data for the period 1901–2017. Maps are, showing Annual, December–January–February (DJF), March–April–May (MAM), June–July–August (JJA), and September–October–November (SON) regression coefficients, respectively. c, e, g, i, k Maps of regression coefficients between the composite of the three AMV indices from panel a and CRU TS4 surface temperature data for the period 1901–2017. Maps are respectively showing Annual, DJF, MAM, JJA, and SON regression coefficients, respectively. For all maps, white grid points indicate that regression coefficients are not significantly different than 0 at the 90% confidence level, using a two-tailed student test with corrected degrees of freedom (“Methods”).
Fig. 2
Fig. 2. Nested reconstruction of the Atlantic Multidecadal Variability (AMV) and related proxies.
a Black line: Annually resolved nested reconstruction of the AMVF index using random forest (see “Methods”). Red line: 10-years kernel smoothed nested reconstruction, black line: annually resolved nested reconstruction. The regression uncertainties of the annually resolved nested reconstruction (black line) are defined for each timestep of the nested reconstruction as ±2 standard error of the regression. Green line is the time series of the instrumental calculated from historical SST data. b Validation metrics (coefficient of efficiency in yellow and correlation in orange) obtained for 30 training-testing splits, and proxy records’ types and availabilities for the nested reconstruction (bottom). c Proxies weights from the random forest method, relative to the proxy records temporal availability (“Methods”). d Temporal coverage of the availability of the proxy records.
Fig. 3
Fig. 3. Comparison of the Atlantic Multidecadal Variability (AMV) with North Atlantic Sea Surface Temperature (NASST) and volcanic forcing.
a Final reconstructions of AMV and NASST in sea surface temperature anomalies (°C). b Superposed epoch analysis for responses of the AMV and NASST reconstructions to the ten largest eruptions of the last millennium (see Supplementary Table 5). Composite series are performed for 31 years, with the 11th year being the year of the eruptions. Each individual response is centered to its values 10 years before the eruption (from N-10 to N-1, where N describes the year of occurrence of the eruption) before computing the composite time series. 95% confidence levels have been calculated using a Monte-Carlo approach.
Fig. 4
Fig. 4. Discrete wavelet transform of the nested Atlantic Multidecadal Variability reconstruction from this study.
Contours provide the 90% confidence level of significance. The white line and the light white-shaded area below indicate the cone of influence. The cone of influence gives the spectrum borders where the edge effect (i.e., the time boundary effect) becomes too important, which cannot be robustly interpreted.
Fig. 5
Fig. 5. Maximum lagged correlations when the Atlantic Meridional Overturning Circulation index (AMOCmax) leads the Atlantic Multidecadal Variability index (AMVF) index in 12 members of Community Earth System Model Last Millennium Ensemble (CESM-LME).
Squares correspond to the maximum lagged correlation when AMOCmax leads the AMVF index. Orange, red, and blue colors indicate 90%, 95%, and 99% confidence levels, respectively. White points indicate no significance at the 90% confidence level. Numbers in each point indicate the timestep where the maximum cross-correlation is reached. All time series are smoothed with a 10-year kernel filter. Exact cross-correlation functions for each member are given in Supplementary Fig. 18.
Fig. 6
Fig. 6. Early Warning Signal (EWS) test of the Atlantic Multidecadal Variability reconstructed index (AMVF) and relevance in Community Earth System Model Last Millennium Ensemble (CESM-LME) simulations.
a EWS for the reconstruction. The applied test is based on first-order autoregressive coefficients (AR(1)), for different window lengths (WL), . For each WL, sliding AR(1) coefficient are computed, and a Kendall τ statistics between time and the sliding AR(1) time series are calculated (see “Methods”). Significances are approximated using Gaussian distributions because of the large length (>50) of the AR(1) coefficients (see “Methods”). bd EWS statistics in CESM-LME simulations. Kendall τ statistics obtained for the maximum Atlantic Meridional Overturning Circulation strength below 500 meters depth (AMOCmax) AR(1) coefficients (ordinates) are plotted against the Kendall τ statistics obtained for the AMVF AR(1) coefficients (abscissas) for WL = 200 (b), WL = 300 (c), and WL = 400 (d), respectively. Plotted numbers indicate the member index of the CESM-LME simulations (from 2 to 13). Red lines are the ordinary least squares regression lines, and their significance is calculated using a two-tailed Student t test of the regression slope.

References

    1. Kushnir Y. Interdecadal variations in North Atlantic sea surface temperatures and associated atmospheric conditions. J. Clim. 1994;7:1–20. doi: 10.1175/1520-0442(1994)007<0141:IVINAS>2.0.CO;2. - DOI
    1. Ting M, Kushnir Y, Saeger R, Cuihua L. Forced and internal twentieth-century SST trends in the North Atlantic. J. Clim. 2009;22:1469–1481. doi: 10.1175/2008JCLI2561.1. - DOI
    1. Mann ME, Steinman BA, Miller SK. On forced temperature changes, internal variability, and the AMO. Geophys. Res. Lett. 2014;41:3211–3219. doi: 10.1002/2014GL059233. - DOI
    1. Sutton RT, Hodson DLR. Atlantic Ocean forcing of North American and European summer climate. Science. 2005;309:115–118. doi: 10.1126/science.1109496. - DOI - PubMed
    1. Knight J, Folland C, Scaife A. Climate impacts of the Atlantic multidecadal oscillation. Geophys. Res. Lett. 2006;33:L17706. doi: 10.1029/2006GL026242. - DOI

Publication types