. 2022 Sep 2;13(1):5184.
doi: 10.1038/s41467-022-32849-1.

Distinct metabolic states guide maturation of inflammatory and tolerogenic dendritic cells

Affiliations

Distinct metabolic states guide maturation of inflammatory and tolerogenic dendritic cells

Juraj Adamik et al. Nat Commun. .

Abstract

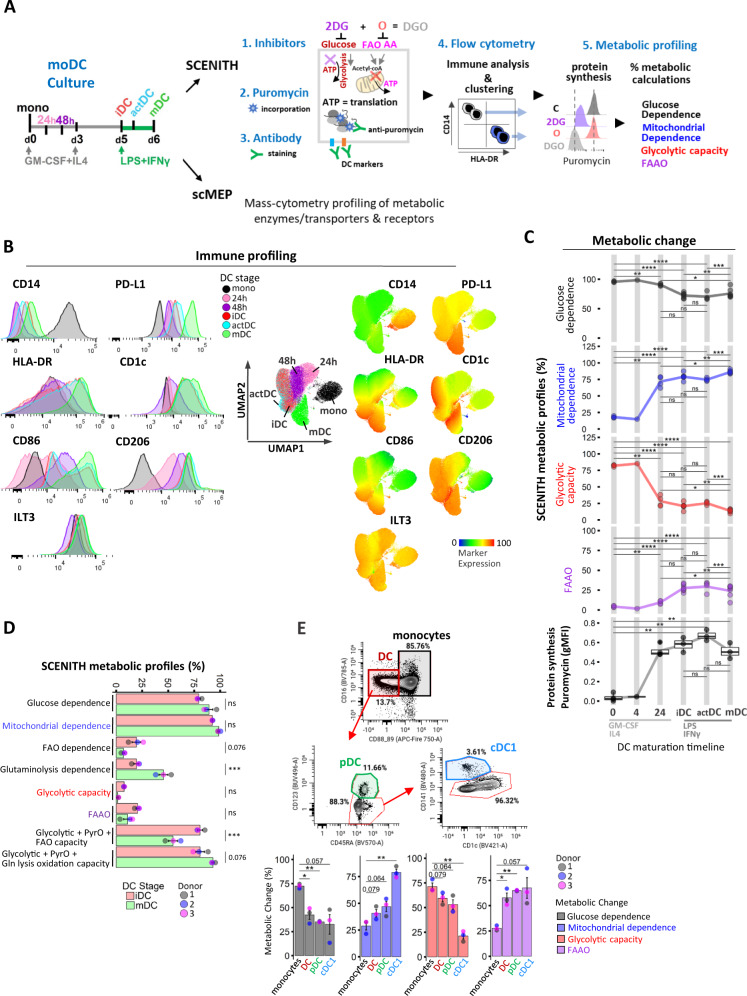
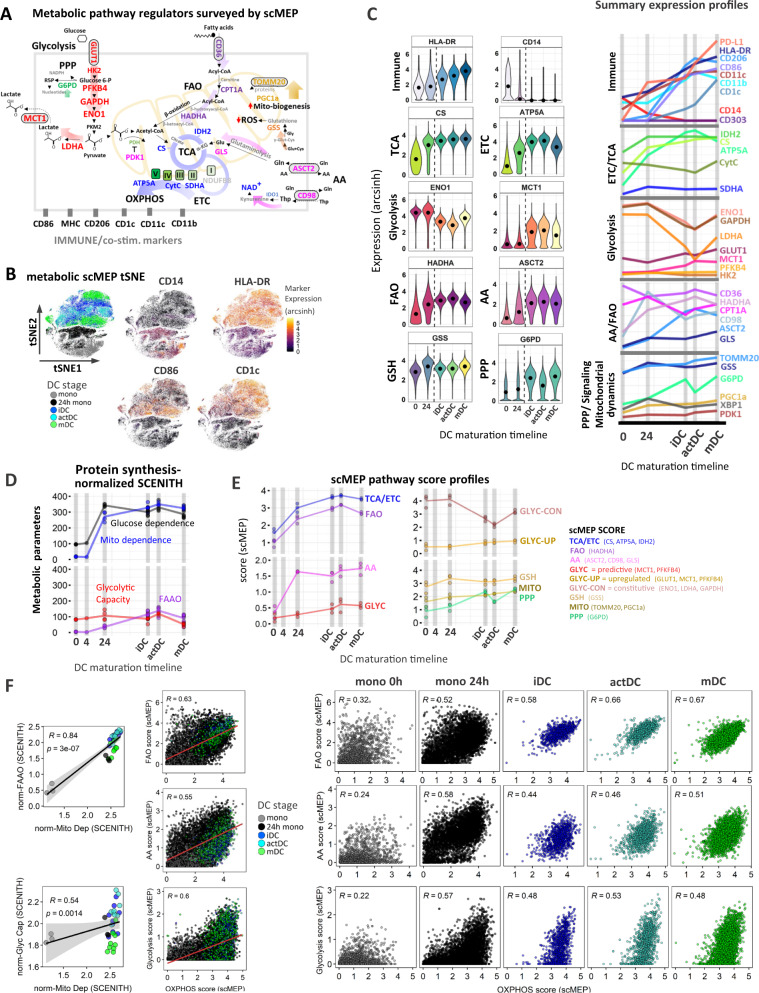
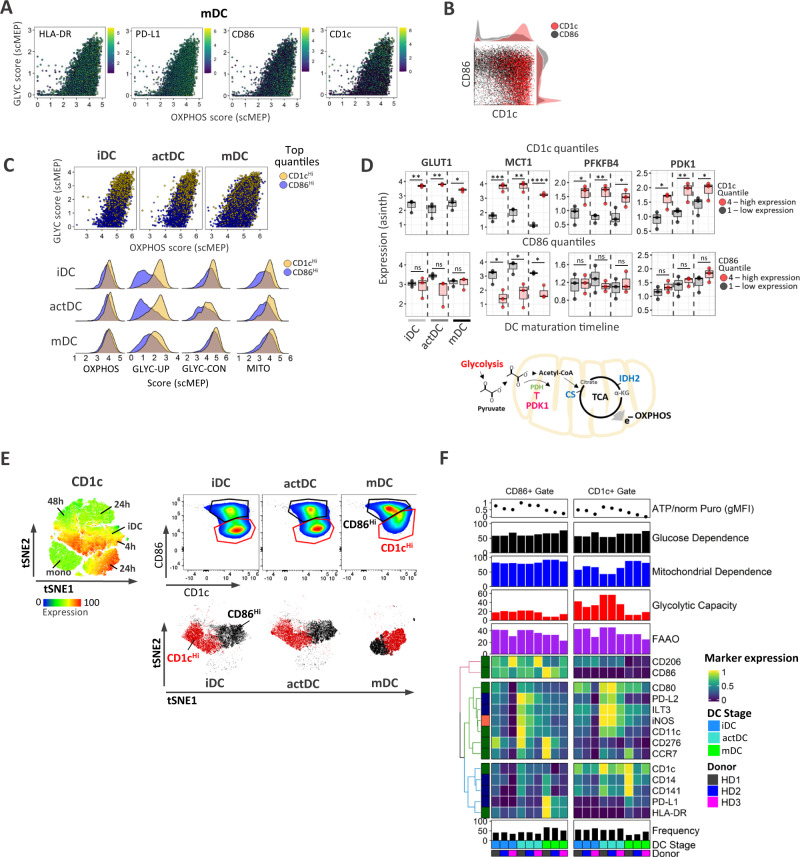
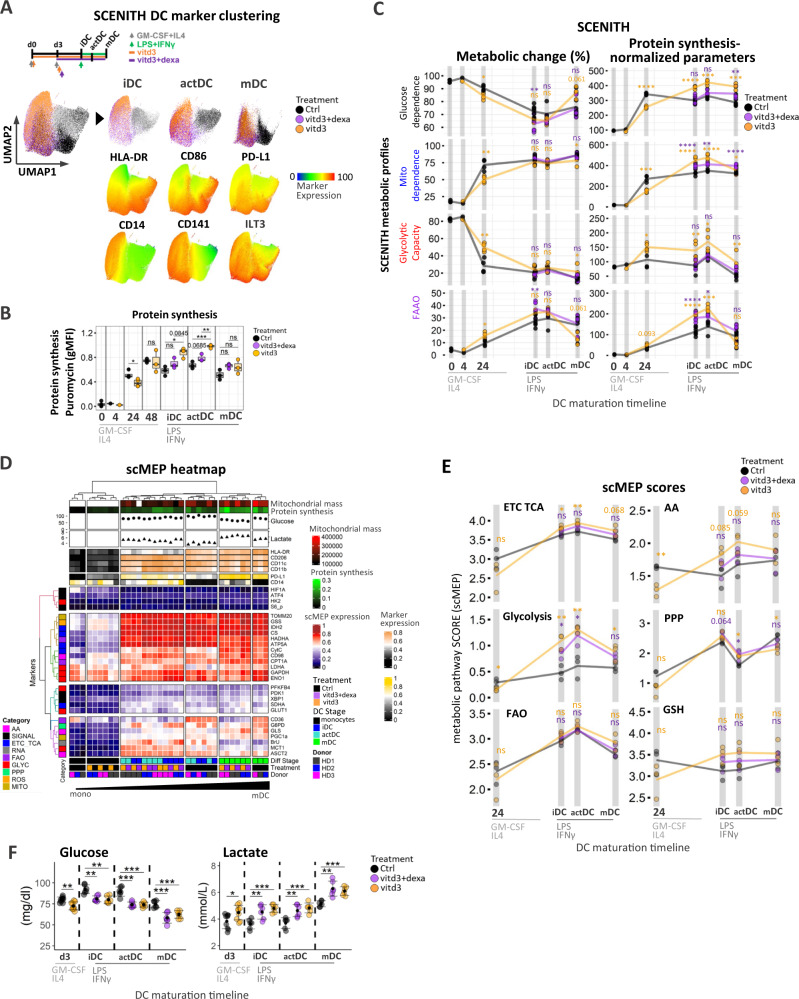
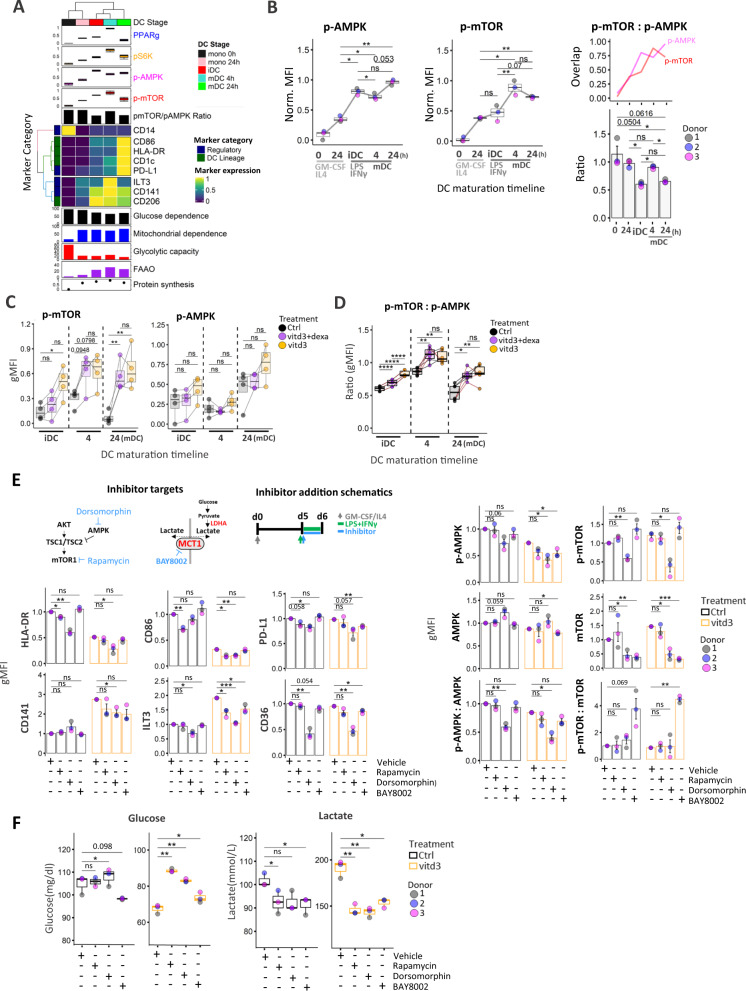
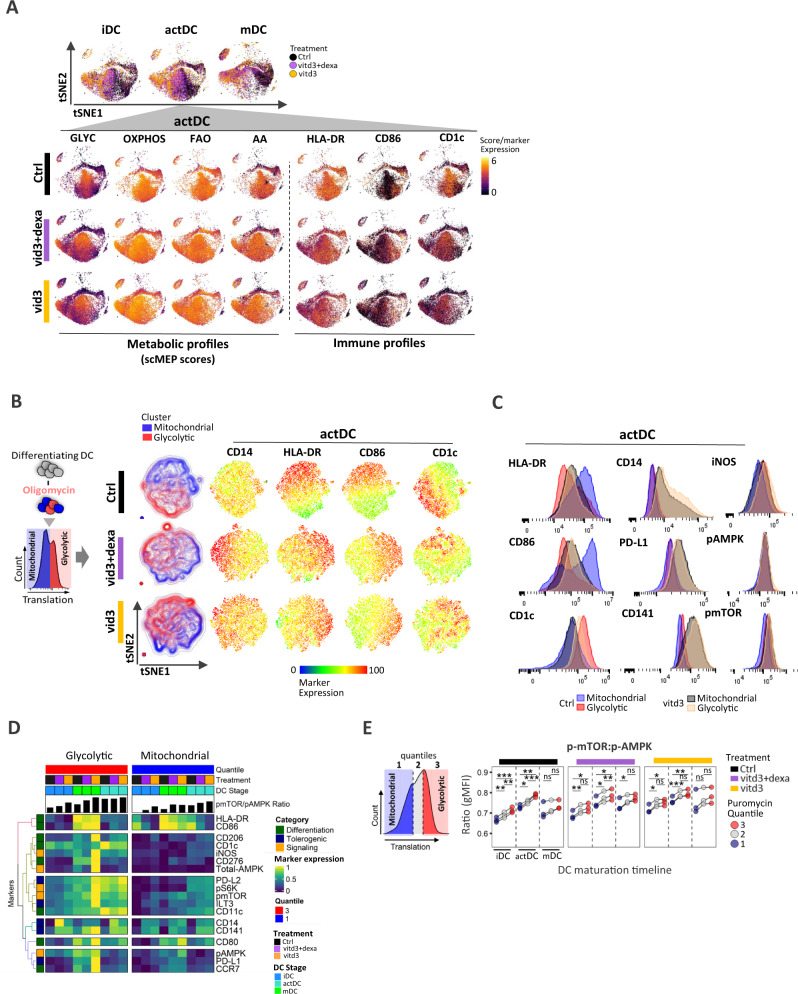
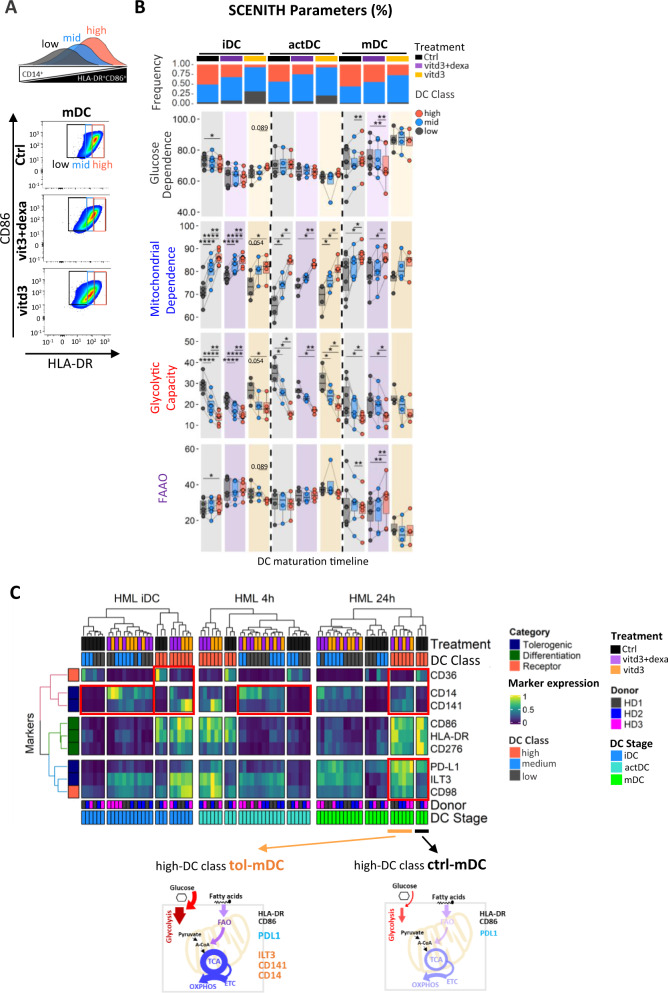
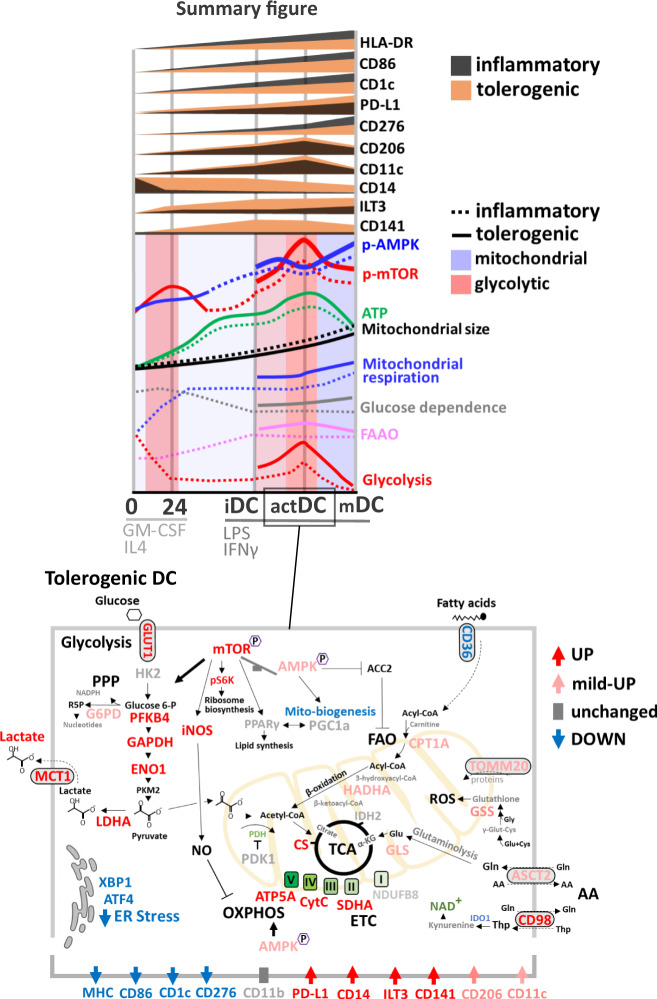
Cellular metabolism underpins immune cell functionality, yet our understanding of metabolic influences in human dendritic cell biology and their ability to orchestrate immune responses is poorly developed. Here, we map single-cell metabolic states and immune profiles of inflammatory and tolerogenic monocytic dendritic cells using recently developed multiparametric approaches. Single-cell metabolic pathway activation scores reveal simultaneous engagement of multiple metabolic pathways in distinct monocytic dendritic cell differentiation stages. GM-CSF/IL4-induce rapid reprogramming of glycolytic monocytes and transient co-activation of mitochondrial pathways followed by TLR4-dependent maturation of dendritic cells. Skewing of the mTOR:AMPK phosphorylation balance and upregulation of OXPHOS, glycolytic and fatty acid oxidation metabolism underpin metabolic hyperactivity and an immunosuppressive phenotype of tolerogenic dendritic cells, which exhibit maturation-resistance and a de-differentiated immune phenotype marked by unique immunoregulatory receptor signatures. This single-cell dataset provides important insights into metabolic pathways impacting the immune profiles of human dendritic cells.


Conflict of interest statement

L.H.B. declares the following unrelated competing interests: Calidi Scientific and Medical Advisory Board, April 6, 2017-present; KaliVir, Scientific Advisory Board, 2018–2021; Torque Therapeutics, Scientific Advisory Board, 2018–2020; Khloris, Scientific Advisory Board, 2019-present; Pyxis, Scientific Advisory Board, 2019-present; CytomX, Scientific Advisory Board, 2019-present; DCprime, Scientific Advisory Board meeting, Nov. 2020; RAPT, Scientific Advisory Board, 2020-present; Takeda, Scientific Advisor, 2020-present; EnaraBio scientific advisor, Feb. 2021. There are restrictions to the commercial use of SCENITH due to a pending patent application (PCT/EP2020/WO2020212362A1). The remaining author declare no competing interests.

Figures

Fig. 1
Fig. 1. Distinct metabolic profiles regulate in vitro DC-lineage differentiation and blood DC.
A Conceptual overview of in vitro culture conditions and experimental setup for scMEP and SCENITH functional metabolic profiling and immune characterization of DC differentiation states. B Expression of immune markers over the course of DC generation is illustrated in flow-cytometry histograms. UMAP clustering based on DC immune markers (CD14, HLA-DR, CD86, CD206, CD1c, PD-L1, ILT3, CD11c, CD276) across DC differentiation stages. Heatmap overlays depict immune marker expression. C Overview of kinetic changes in percentual SCENITH parameters and protein synthesis measurements across DC differentiation timeline. Lines represent average SCENITH profiles (precursor stages 0 h and 24 h represent three independent donors), iDC and mDC represent six independent donors, precursor 4 h time point is only a reference point for visualization purposes and represents 1 donor. D Percentual SCENITH comparisons between iDC and mDC including Etomoxir and CD-839-derived parameters are shown (bar graphs represent 3 independent replicates from 1 donor with mean ± SE). PyrO abbreviates proteins synthesis due to pyruvate oxidation. E Shown are gating strategies for immune characterization and percentual SCENITH profiles for freshly isolated blood monocytes and DC populations from 3 independent donors with mean ± SE. Statistical significance in A, E was calculated via one-way ANOVA with Tukey’s post-hoc test, D using two-sided Student’s t-test. For all panels, P-values are represented as *p ≤ 0.05, **p ≤ 0.01, ***p ≤ 0.001, ****p ≤ 0.0001. p-values < 0.05 were considered statistically significant (ns). Box plots indicate second and third quantile (box), median (horizontal line) and 1.5× the interquartile range (whiskers). Source data are provided as a source data file.
Fig. 2
Fig. 2. Dynamic changes in metabolic regulome and co-expression of multiple metabolic pathways governs the immune reprogramming of DC.
A Graphical overview of the scMEP approach depicting metabolic enzymes, signaling factors and metabolite receptors spanning multiple metabolic pathways as well DC-lineage markers profiled by CyTOF. B tSNE visualization of DC stages using scMEP metabolic markers. Heatmap overlay of single-cell CD14, HLA-DR, CD86 and CD1c (arcsinh transformed) expression highlights associations between DC stages and immune marker expression. Data show one representative experiment (out of N = 3 donors). C Shown are (arcsinh transformed) expression values for selected scMEP immune markers across DC differentiation states. Black dots represent population medians and the dotted line separates early precursors from iDC, actDC, and mDC stages. Violin plots are representative of 1 donor (out of N = 3). On the right side are represented summary (mean) kinetic expression profiles for all measured immune and metabolic scMEP parameters across DC differentiation. D Kinetic profiles of protein synthesis-adjusted SCENITH parameters (calculated as described in materials and methods) to obtain metabolic pathway-dependent changes accounting for ATP production. Lines highlight mean SCENITH profiles (precursor stages represent 3 independent donors, iDC, actDC, and mDC represent six independent donors). E Kinetic profiles for calculated mean scMEP pathways scores are illustrated. Connecting lines visualize mean pathway changes (N = 3 donors). F Correlations between median SCENITH parameters and respective calculated median scMEP pathway scores with Spearman correlation coefficient (R), p-value and grey shading denoting 95% confidence interval (CI). Middle and multi-panel graphs depict single-cell scMEP scores for combined and individual DC sample time points respectively. Subsampled single-cell data points for the individual donor (out of N = 3) are shown. Source data are provided as a Source Data file.
Fig. 3
Fig. 3. Metabolic heterogeneity associates with phenotypic polarization of CD1chi and CD86hi DC populations.
A Correlation analysis for single-cell glycolytic glycolysis and OXHOS scores with heatmap expression single-cell overly of indicated immune markers. Subsampled single-cell data points for the individual donor (out of N = 3) are shown for the entire figure. B Mass cytometry scatter plots for CD1c and CD86 expression profiles were used to emphasize the distribution of CD1chi and CD86hi populations. C Shown are single-cell scatter plot comparisons of the top 4th quantiles from CD1chi (blue) and CD86hi (gold) DC populations. Lower graphs represent histogram distributions of single-cell scMEP metabolic pathway scores in CD1chi and CD86hi populations. D Box plots represent median expression values of glycolytic enzymes and PDK1 in the 1st (lowest, black) and 4th (highest, red) quantile from CD1c and CD86 populations across iDC, actDC, and mDC from 3 independent donors. Statistical significance was calculated using two-sided Student’s t-test. A role for PDK1 in pyruvate to Acetyl-CoA conversion is depicted underneath the graphs. E tSNE visualization of SCENITH profiling depicts clustering of DC stages with CD1c expression heatmap overlay. Adjacent gating strategy was used to select CD1chi and CD86hi populations, whose spatial distribution is emphasized (with matching colors) on tSNE maps divided into separate iDC, actDC, and mDC stages. F Heatmap of gMFI expression for collection of SCENITH phenotyping markers in CD1chi and CD86hi populations from iDC, actDC, and mDC (N = 3 donors). Donor label, DC differentiation stages population frequency, protein synthesis levels along with SCENITH percentual metabolic profiles are annotated. For all panels, P-values are represented as *p ≤ 0.05, **p ≤ 0.01, ***p ≤ 0.001, ****p ≤ 0.0001. p-values < 0.05 were considered statistically significant (ns). Box plots indicate second and third quantile (box), median (horizontal line) and 1.5× the interquartile range (whiskers). Source data are provided as a Source Data file.
Fig. 4
Fig. 4. Vitd3 and dexamethasone alters metabolic and signaling networks in immune-suppressive phenotypes of tol-DC.
A Schematic diagram of tolerogenic DC treatment conditions. Control (black), vitd3+dexa (purple) and vitd3 (orange) cells sampled at iDC, actDC, and mDC were subjected to dimensionality reduction using UMAP. Single-cell heatmaps were overlayed on concatenated (iDC, actDC, and mDC) samples to depict immune marker expression changes between maturation stages in control and tolerogenic cell clusters. B Boxplots represent changes in SCENITH puromycin protein synthesis (gMFI puromycin) levels across DC stages and treatment conditions (N = 3 donors). C Overview of kinetic changes and differences in percentual (left panel) and protein synthesis-adjusted (right panel) SCENITH metabolic parameters between control, vitd3+dexa (purple) and vitd3-treated (orange) DC across differentiation timeline. Connecting lines visualize average pathway changes (precursor stages represent 3 independent donors, iDC, actDC, and mDC represent SIX independent donors). Statistical significance of pairwise comparisons between control and vitd3-dexa-tol (purple asterisk) and control and vitd3-tol samples (orange asterisk) analyses are depicted. D Integrated clustering heatmap of DC activation stages based on median arcsinh transformed expression values for scMEP metabolic regulators (N = 3). Bottom heatmap annotations include donor labels, treatment conditions and DC differentiation stages. Fluorescent quantitation of mitochondrial size (Mitotracker Deep Red) along with protein translation/ATP levels are annotated in the form of a heatmap. Point annotations representing lactate and glucose supernatant measurements were determined in iDC, actDC, and mDC. Heatmap annotation for DC immune signatures are located at the top of the clustering matrix. scMEP markers are colored according to their metabolic pathway activity. E Kinetic profiles for calculated median scMEP pathways scores for control (black), vitd3+dexa (purple) and vitd3 (orange)-treated DC across DC maturation timeline. Connecting lines visualize mean pathway changes (N = 3). Statistical significance of pairwise comparisons between control and vitd3-dexa-tol (purple asterisk) and control and vitd3-tol samples (orange asterisk) analyses are depicted. F Glucose and lactate measurements in control and tolerogenic DC culture supernatants are shown. Of note glucose level measurement increase in the media between d3 and iDC stage is due to media change at day 3. Three technical replicates from three donors are presented with error bars indicating standard deviation. Multiple comparisons statistical significance in B, C, E, F was calculated via one-way ANOVA with Tukey’s post-hoc test. For all panels, P-values are represented as *p ≤ 0.05, **p ≤ 0.01, ***p ≤ 0.001, ****p ≤ 0.0001. p-values < 0.05 were considered statistically significant (ns). Box plots indicate second and third quantile (box), median (horizontal line) and 1.5× the interquartile range (whiskers). Source data are provided as a Source Data file.
Fig. 5
Fig. 5. AMPK:mTOR signaling axis and lactate transporter MCT1 are critical regulators of tolerogenic DC.
A Heatmap and clustering analysis of gMFI expression profiles for DC-lineage markers over time. Average expression from three donors is represented. Protein synthesis levels, Percentual SCENITH parameters, donor label, and DC differentiation stages are annotated along with expression profiles for signaling factors and calculated mTOR:AMPK phosphorylation ratio. B Kinetic phosphorylation levels for p-AMPK and p-mTOR across DC differentiation and their trajectory overlaps are depicted. Barplots with mean ± SE represent changes in calculated p-mTOR:p-AMPK ratios (N = 3). C gMFI expression values of p-AMPK and p-mTOR in control (black), vitd3+dexa (purple) and vitd3 (orange)-treated DC across maturation stages are shown (N = 4). Lines connect data points from an individual donor. D Boxplots represent changes in calculated p-mTOR:p-AMPK ratios between control (black), vitd3+dexa (purple) and vitd3 (orange)-treated DC (N = 5 donors) across maturation timeline. Lines connect data points from an individual donor. E Bar graphs with mean ± SE represent gMFI expression values and F box plots represent Glucose and lactate measurements for control and vitd3-tol mDC treated with Vehicle (DMSO), Rapamycin (1 μM), Dorsomorphin (3.75 μM) and BAY8002 (80 μM) (N = 3). Diagrams of pathway inhibitor targets and timeline for inhibitor treatment are depicted. Multiple comparisons statistical significance in BF was calculated via one-way ANOVA with Tukey’s post-hoc test. For all panels, P-values are represented as *p ≤ 0.05, **p ≤ 0.01, ***p ≤ 0.001, ****P ≤ 0.0001. p-values < 0.05 were considered statistically significant (ns). Box plots indicate second and third quantile (box), median (horizontal line) and 1.5× the interquartile range (whiskers). Source data are provided as a Source Data file.
Fig. 6
Fig. 6. Distinct metabolic states of mitochondrial and glycolytic cell populations exhibit unique immune activation DC profiles in control and tolerogenic culture conditions.
A tSNE maps based on metabolic marker expression of control (black), vitd3+dexa (purple) and vitd3 (orange)-treated DC across three maturation stages from one donor (out of N = 3 donors) are shown. Heatmap overlay of single-cell scMEP metabolic pathway scores and expression of DC-lineage markers are depicted at actDC stage to emphasize both immune and underlying metabolic heterogeneity including differences between control and tolerogenic DC. B Schematics of oligomycin-treated SCENITH samples, which separates cells that can effectively utilize glycolysis (red population) for producing ATP measured by protein synthesis when mitochondrial respiration is inhibited. Puromycin/ protein synthesis histograms represent cells isolated from single oligomycin-treated wells. Control (black), vitd3+dexa (purple) and vitd3 (orange)-cultured samples after oligomycin treatment exhibit glycolytic (red) and mitochondrial-dependent (blue) DC subsets in a tSNE clustering based on immune markers. Single-cell heatmap expression overlays emphasize differences in surface marker expression between glycolytic and mitochondrial DC subsets. C Flow-cytometry histogram profiles for differential SCENITH panel markers in glycolytic (red, orange) and mitochondrial (blue, black) populations in control and vitd3-tol-DC samples. Representative histograms from single donor (out of N = 3 donors) are shown. D Heatmap of gMFI SCENITH marker profiles in glycolytic and mitochondrial metabolic clusters from control, vitd3+dexa and vitd3 DC across distinct maturation stages. Mean expression values from three independent donors are presented. Donor label, treatment and DC differentiation stages are annotated along with the calculated mTOR:AMPK phosphorylation ratio. Marker colors represent functional categories. E Schematics of puromycin/protein synthesis quantile levels in oligomycin-treated SCENITH samples. Dot plots show calculated comparisons of p-mTOR:p-AMPK ratio changes between individual quantiles within respective treatment groups across maturation stages from three independent donors. Lines connect data points from an individual donor. Statistical significance was calculated via one-way ANOVA with Tukey’s post-hoc test. For all panels, P-values are represented as *p ≤ 0.05, **p ≤ 0.01, ***p ≤ 0.001, ****p ≤ 0.0001. p-values < 0.05 were considered statistically significant (ns). Source data are provided as a Source Data file.
Fig. 7
Fig. 7. High mitochondrial dependence and low glycolytic capacity associates with increased expression of maturation markers HLA-DR+CD86+ in control but is imbalanced in tolerogenic DC.
A Schematic depiction and gating strategy for identifying high, mid, and low HLA-DR+CD86+ expressing control, vitd3+dexa and vitd3-treated DC populations across differentiation stages. B Boxplots represent changes in percentual SCENITH parameters emphasizing changes between high, mid, and low HLA-DR+CD86+ populations from control (black), vitd3+dexa (purple) and vitd3 (orange)-treated DC across maturation stages (N = 5 donors). Lines connect data points from an individual donor. Frequencies of DC classes across individual samples are depicted at the top of the panel. Statistical significance was calculated via one-way ANOVA with Tukey’s post-hoc test. C Integrative heatmap and clustering analysis shows gMFI SCENITH immune marker profiles for high, mid, and low HLA-DR+CD86+ DC classes in control, vitd3+dexa and vitd3 samples across distinct DC maturation stages. Red boxes highlight interesting immuno-phenotypic differences between control and tol-DCs within the same DC classes. Schematics summary for metabolic and phenotypic differences between HLA-DR+CD86+ DC classes across maturation stages in control and tol-DCs. For all panels, P-values are represented as *p ≤ 0.05, **p ≤ 0.01, ***p ≤ 0.001, ****P ≤ 0.0001. p-values < 0.05 were considered statistically significant (ns). Box plots indicate second and third quantile (box), median (horizontal line) and 1.5× the interquartile range (whiskers). Source data are provided as a Source Data file.
Fig. 8
Fig. 8. Summary diagram of immunometabolic reprogramming of inflammatory and tolerogenic DC during differentiation signaling.
A schematic depiction of the metabolic and immune changes of inflammatory and tolerogenic DC is presented, noting key mechanisms and pathways.

References

    1. Qian C, Cao X. Dendritic cells in the regulation of immunity and inflammation. Semin Immunol. 2017;35:3–11. doi: 10.1016/j.smim.2017.12.002. - DOI - PubMed
    1. Dalod M, Chelbi R, Malissen B, Lawrence T. Dendritic cell maturation: functional specialization through signaling specificity and transcriptional programming. Embo J. 2014;33:1104–1116. doi: 10.1002/embj.201488027. - DOI - PMC - PubMed
    1. Raker VK, Domogalla MP, Steinbrink K. Tolerogenic dendritic cells for regulatory T cell induction in man. Front Immunol. 2015;6:569. doi: 10.3389/fimmu.2015.00569. - DOI - PMC - PubMed
    1. Thomaz L, et al. The impact of metabolic reprogramming on dendritic cell function. Int Immunopharmacol. 2018;63:84–93. doi: 10.1016/j.intimp.2018.07.031. - DOI - PubMed
    1. Krawczyk CM, et al. Toll-like receptor–induced changes in glycolytic metabolism regulate dendritic cell activation. Blood. 2010;115:4742–4749. doi: 10.1182/blood-2009-10-249540. - DOI - PMC - PubMed

Publication types