. 2022 Sep 2;12(1):14965.
doi: 10.1038/s41598-022-19314-1.

A machine learning analysis of COVID-19 mental health data

Affiliations

A machine learning analysis of COVID-19 mental health data

Mostafa Rezapour et al. Sci Rep. .

Abstract

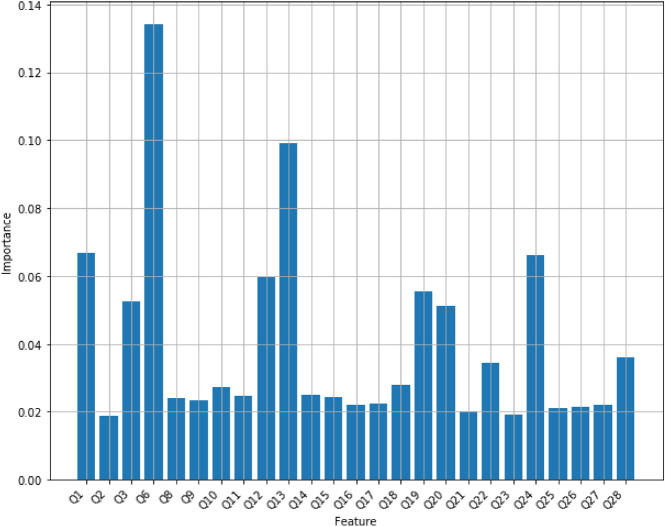
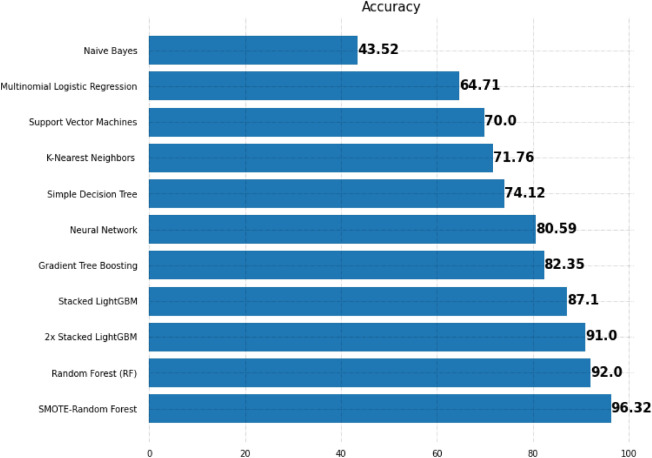
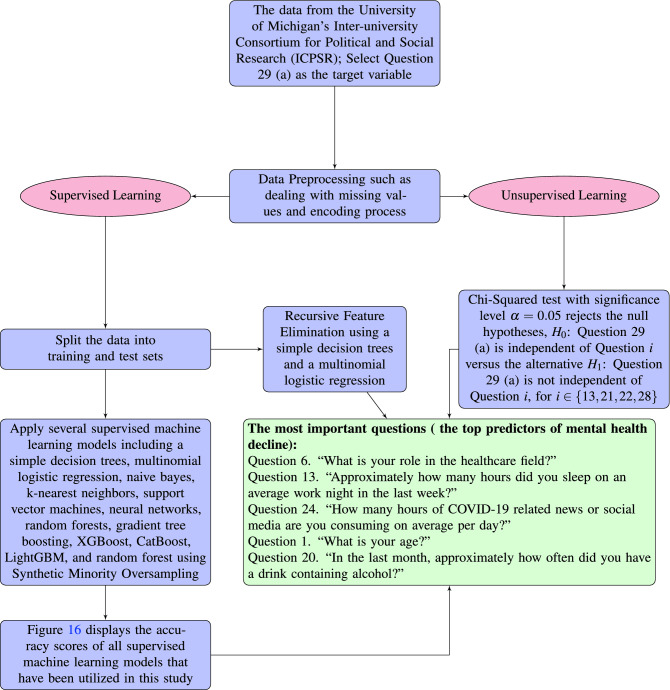
In late December 2019, the novel coronavirus (Sars-Cov-2) and the resulting disease COVID-19 were first identified in Wuhan China. The disease slipped through containment measures, with the first known case in the United States being identified on January 20th, 2020. In this paper, we utilize survey data from the Inter-university Consortium for Political and Social Research and apply several statistical and machine learning models and techniques such as Decision Trees, Multinomial Logistic Regression, Naive Bayes, k-Nearest Neighbors, Support Vector Machines, Neural Networks, Random Forests, Gradient Tree Boosting, XGBoost, CatBoost, LightGBM, Synthetic Minority Oversampling, and Chi-Squared Test to analyze the impacts the COVID-19 pandemic has had on the mental health of frontline workers in the United States. Through the interpretation of the many models applied to the mental health survey data, we have concluded that the most important factor in predicting the mental health decline of a frontline worker is the healthcare role the individual is in (Nurse, Emergency Room Staff, Surgeon, etc.), followed by the amount of sleep the individual has had in the last week, the amount of COVID-19 related news an individual has consumed on average in a day, the age of the worker, and the usage of alcohol and cannabis.


Conflict of interest statement

The authors declare no competing interests.

Figures

Figure 1
Figure 1
Q29 (a): “Please tell us how your mood has changed. My mood has been:”.
Figure 2
Figure 2
Bar graph grouped for the variables that pass the Chi-Squared test with significance level α=0.05.
Figure 3
Figure 3
Bar graph grouped for the variables that pass the Chi-Squared test with significance level α=0.05.
Figure 4
Figure 4
Feature importance scores of Random Forest with 10 trees with maximum depth of 10.
Figure 5
Figure 5
The accuracy scores of random forests with multiple values for its hyper-parameters. Red dots display the maximum accuracy of 92% for random forest models using 15 trees with the maximum depth of 9, or 44 trees with the maximum depth of 12, or 45 trees with the maximum depth of 12, or 57 trees with the maximum depth of 12, or 60 trees with the maximum depth of 12, or 61 trees with the maximum depth of 12, or 63 trees with the maximum depth of 12.
Figure 6
Figure 6
Feature importance scores of Random Forest with 44 trees with a maximum depth of 12.
Figure 7
Figure 7
Box plot for the mean accuracy of Gradient Tree Boosting with different number of trees.
Figure 8
Figure 8
The feature scores of Gradient Tree Boosting with 19 trees.
Figure 9
Figure 9
The mean accuracy of XGBoost using k-fold cross-validation.
Figure 10
Figure 10
The feature scores of XGBoost using k=9 cross-validation.
Figure 11
Figure 11
The mean accuracy of CatBoost using several trees.
Figure 12
Figure 12
The feature scores of the CatBoost model using 60 trees.
Figure 13
Figure 13
LightGBM.
Figure 14
Figure 14
Applying SMOTE to oversample all classes to the number of examples in the majority class.
Figure 15
Figure 15
Feature importance scores of SMOTE Random Forest.
Figure 16
Figure 16
Improving the Randome Forest accuracy by means of SMOTE.
Figure 17
Figure 17
Multiple statistical and machine learning models and techniques such as Decision Trees, Multinomial Logistic Regression, Naive Bayes, k-Nearest Neighbors, Support Vector Machines, Neural Networks, Random Forests, Gradient Tree Boosting, XGBoost, CatBoost, LightGBM, Synthetic Minority Oversampling, and a Chi Squared Test have been used to identify the most important factor in predicting the mental health decline of a frontline worker. It turns out that the top predictors are the healthcare role the individual is in (Nurse, Emergency Room Staff, Surgeon, etc.), followed by the amount of sleep the individual has had in the last week, the amount of COVID-19 related news an individual has consumed on average in a day, the age of the worker, and the usage of alcohol and cannabis.

References

    1. Huang C, et al. Clinical features of patients infected with 2019 novel coronavirus in Wuhan, China. The Lancet. 2020;395(10223):497–506. doi: 10.1016/S0140-6736(20)30183-5. - DOI - PMC - PubMed
    1. Nishiura H, et al. The extent of transmission of novel coronavirus in Wuhan, China. J. Clin. Med. 2020;9:330. doi: 10.3390/jcm9020330. - DOI - PMC - PubMed
    1. Harcourt J, et al. Severe acute respiratory syndrome coronavirus 2 from patient with coronavirus disease, United States. Emerg. Infect. Dis. 2020;26(6):1266. doi: 10.3201/eid2606.200516. - DOI - PMC - PubMed
    1. WHO Coronavirus Disease (COVID-19) Dashboard. World Health Organization. 2020 Aug 31 (accessed 01 January 2020): https://covid19.who.int/.
    1. Centers for Disease Control and Prevention. Lesson 1: Introduction to epidemiology, section 11: Epidemic disease occurrence. CDC (accessed 5th May 2020): https://www.cdc.gov/csels/dsepd/ss1978/lesson1/section11.html (2018).