. 2022 Sep 2;12(1):14997.
doi: 10.1038/s41598-022-19293-3.

3D proximal tubule-on-chip model derived from kidney organoids with improved drug uptake

Affiliations

3D proximal tubule-on-chip model derived from kidney organoids with improved drug uptake

Jeffrey O Aceves et al. Sci Rep. .

Abstract

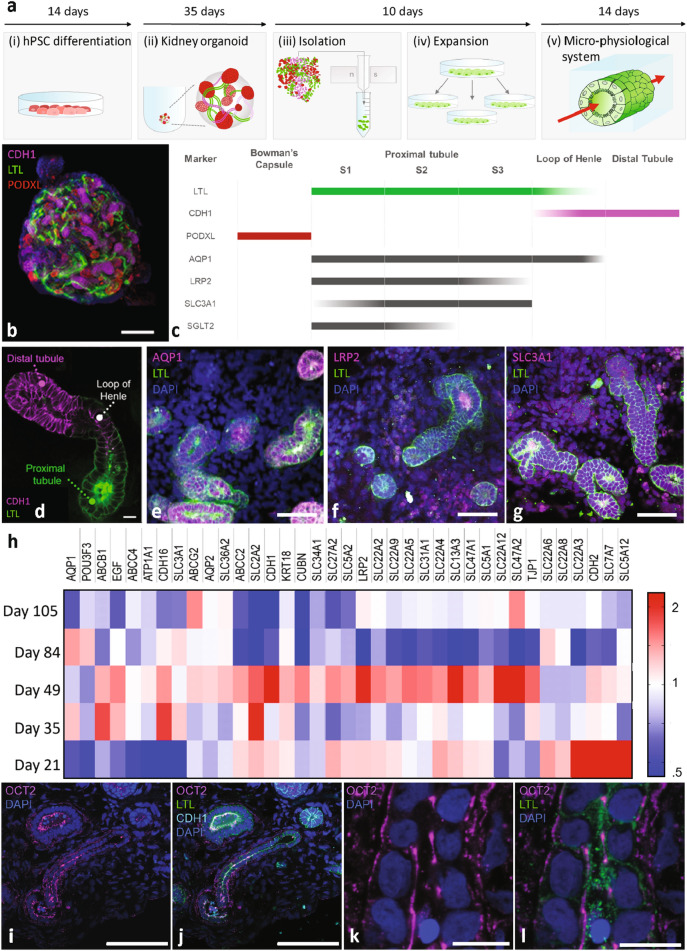
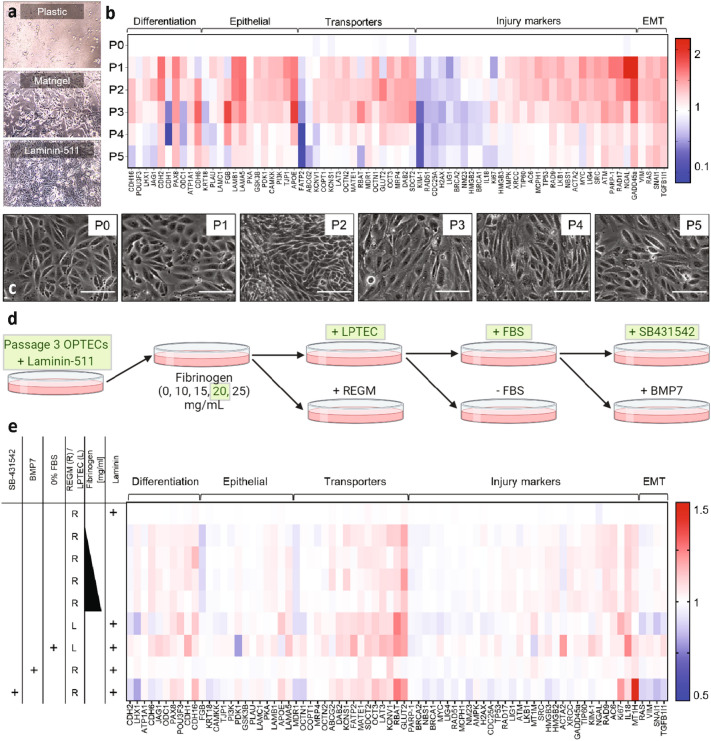
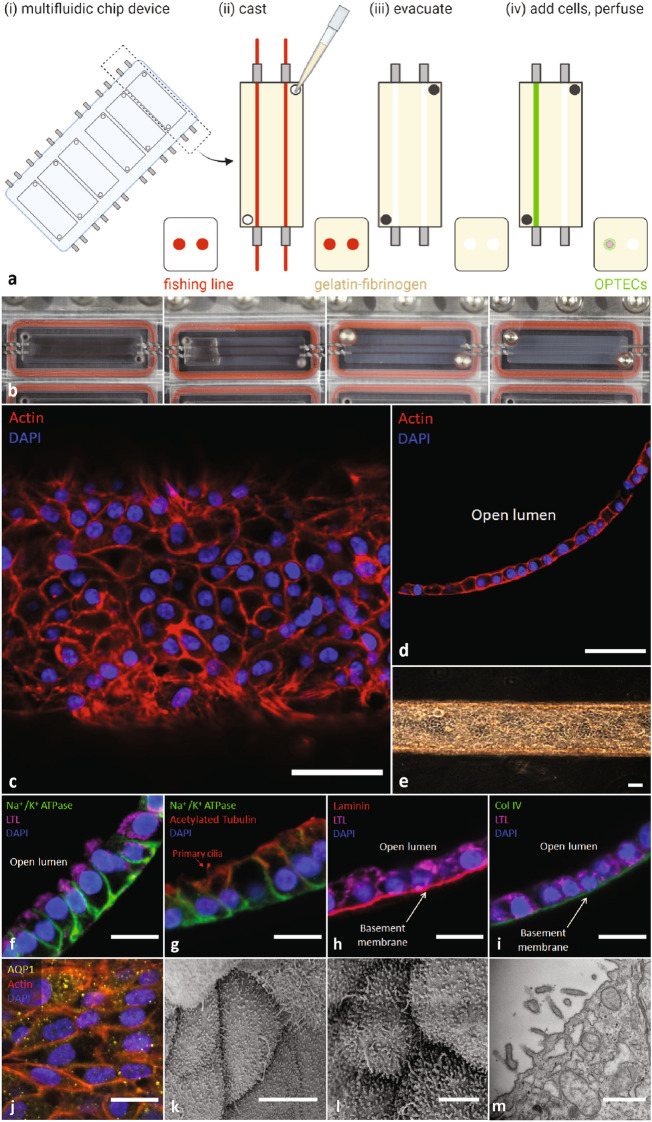
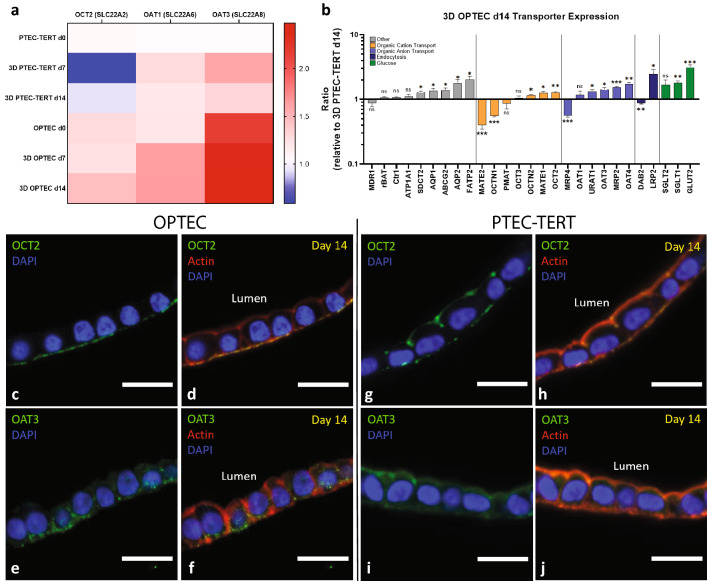
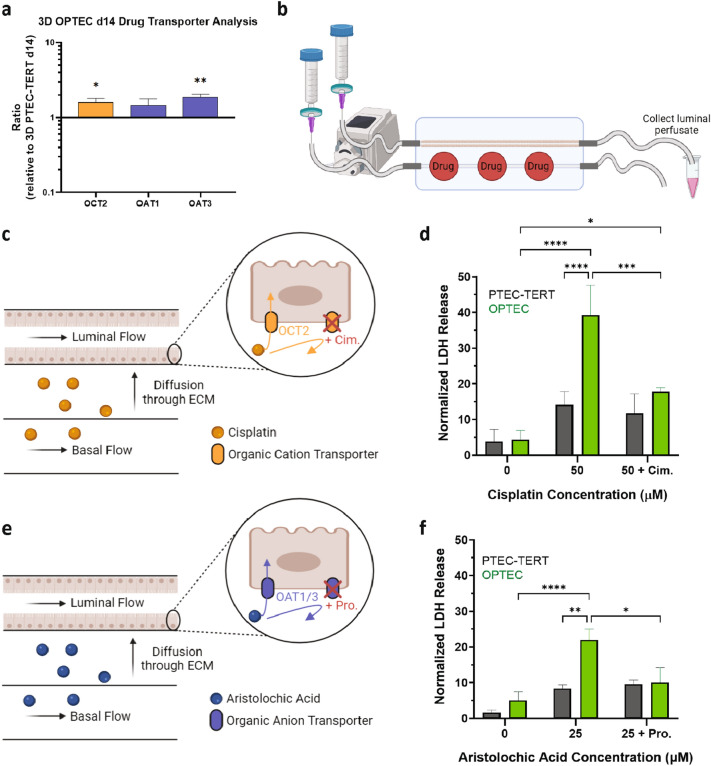
Three-dimensional, organ-on-chip models that recapitulate kidney tissue are needed for drug screening and disease modeling. Here, we report a method for creating a perfusable 3D proximal tubule model composed of epithelial cells isolated from kidney organoids matured under static conditions. These organoid-derived proximal tubule epithelial cells (OPTECs) are seeded in cylindrical channels fully embedded within an extracellular matrix, where they form a confluent monolayer. A second perfusable channel is placed adjacent to each proximal tubule within these reusable multiplexed chips to mimic basolateral drug transport and uptake. Our 3D OPTEC-on-chip model exhibits significant upregulation of organic cation (OCT2) and organic anion (OAT1/3) transporters, which leads to improved drug uptake, compared to control chips based on immortalized proximal tubule epithelial cells. Hence, OPTEC tubules exhibit a higher normalized lactate dehydrogenase (LDH) release, when exposed to known nephrotoxins, cisplatin and aristolochic acid, which are diminished upon adding OCT2 and OAT1/3 transport inhibitors. Our integrated multifluidic platform paves the way for personalized kidney-on-chip models for drug screening and disease modeling.


Conflict of interest statement

Dr. Lewis has been funded by F. Hoffman-La Roche AG, Inc. and AstraZeneca, Inc. Dr. Lewis and Dr. Morizane serve on the Scientific Advisory Board of Trestle Biotherapeutics, which has licensed technology from their labs. The other authors declare no potential conflict of interest.

Figures

Figure 1
Figure 1
Proximal tubule epithelial cells in kidney organoids. (a) Schematic overview of process used to create 3D organoid-derived proximal tubule epithelial cell (3D OPTECs)-on-chip models. (b) Confocal image of kidney organoid (tissue-cleared) stained for PODXL+ (red), LTL+ (green), and CDH1+ (magenta), scale bar = 100 μm. (c) Schematic showing marker localization in different segments of the nephron. (d) Higher magnification, confocal image of kidney organoid (cryo-sectioned) stained for LTL+ and CDH1+ regions, scale bar = 10 μm. (eg) Confocal images of kidney organoid (cryo-sectioned) stained for AQP1+, LRP2+, and SLC3A1+ (magenta) in nephron segments, scale bars = 50 μm. (h) Heat map comparing transporter expression of OPTECs isolated from kidney organoids at days 21, 35, 49, 84, and 105. (i, j) Confocal images of kidney organoid (day 49, cryos-ectioned) stained for OCT2+ (magenta), LTL+ (green), and CDH1+ (cyan), scale bar = 100 μm. (k, l) Higher magnification, confocal images of kidney organoid (day 49, cryo-sectioned) stained for OCT2+ (magenta) and LTL+ (green), scale bar = 10 μm.
Figure 2
Figure 2
Optimizing OPTEC expansion. (a) Brightfield images showing OPTECs grown on plastic, matrigel, and laminin-511 substrates. (b) Heat map showing transporter expression of OPTECs between passages 0 (after isolation) and 5. (c) Brightfield images showing OPTEC populations at passages 0–5, scale bar = 20 μm. (d) Schematic view of the extracellular matrix (ECM), media, and media supplement conditions explored for optimizing OPTEC culture conditions. (e) Heat map comparing transporter expression as a function of the experimental conditions tested in (d).
Figure 3
Figure 3
3D OPTEC-on-chip model. (a) Schematic views showing the processing steps used to create multiplexed, 3D OPTEC-on-chip models. (b) Corresponding images (left to right) of a representative chip after placing the channel templates, infilling the chip with ECM, removing the templates to create two-colocalized channels, and seeding one channel with OPTECs to create a 3D proximal tubule. (c) Confocal image of 3D OPTEC tubule showing actin (red) and DAPI (blue), scale bar = 50 μm. (d) Cross-sectional image of 3D OPTEC tubule (day 14, perfusion) highlighting the formation of a confluent monolayer, scale bar = 50 μm. (e) Brightfield image of 3D OPTEC tubule upon reaching confluency (day 7), scale bar = 75 μm. (f) OPTEC tubule (day 14, perfusion) stained for Na+/K+ ATPase (green), LTL (magenta), and DAPI (blue). (g) OPTEC tubules exhibit proper apical polarization of primary cilia marker, acetylated alpha tubulin (red). (h, i) Basement membrane proteins laminin (red) and Col IV (green) are deposited by OPTECs on chip. (j) Proper expression of AQP1 (yellow) is observed in OPTEC tubules. (f, j) scale bars = 20 μm. (k) SEM image highlighting primary cilia on OPTEC, scale bar = 5 μm. (l) SEM image of OPTEC brush border, scale bar = 20 μm. (m) TEM image of brush border, scale bar = 1 μm.
Figure 4
Figure 4
Improved transporter expression and polarization of 3D OPTECs-on-chip. (a) Heat map showing OCT2, OAT1, and OAT3 transporter expression for OPTECs and PTEC-TERT1s-on-chip (day 0, as seeded), after achieving confluency (day 7, perfusion), and one-week after achieving confluency on chip (day 14, perfusion). (b) General transporter analysis comparing OPTEC tubules normalized by PTEC-TERT1 tubules after day 14 of perfusion on chip, one sample t test, n = 6 tubules across 3 batches of OPTECs, *p < 0.05, **p < 0.01, ***p < 0.005. (c, d) Immunofluorescence images showing OCT2 (green) and DAPI (blue) staining in OPTEC tubules after day 14 of perfusion on chip. (e–f) Immunofluorescence images of showing localization of OAT3 (green) and DAPI (blue) in OPTEC tubules after day 14 of perfusion on chip (g, h), Immunofluorescence images showing OCT2 (green) and DAPI (blue) staining in PTEC-TERT1 tubules after day 14 of perfusion on chip, and (i, j) Immunofluorescence images of showing localization of OAT3 (green) and DAPI (blue) in PTEC-TERT1 tubules after day 14 of perfusion on chip, scale bars = 20 μm.
Figure 5
Figure 5
Nephrotoxicity testing. (a) Comparison of OCT2, OAT1, and OAT3 transporter expression in OPTEC tubules (n = 6) after day 14 of perfusion on chip compared PTEC-TERT1 tubules (controls), one sample t test. (b) Schematic view of experimental step used to introduce drugs and corresponding inhibitors as well as collect luminal perfusate. (c) Schematic view of OCT2-mediated uptake of cisplatin and inhibition using cimetidine. (d) Normalized LDH release observed after dosing the OPTEC (n = 4–5) and PTEC-TERT1 (n = 3–4) tubules on chip with cisplatin for 48 h, two-way ANOVA. (e) Schematic view of OAT1/3-mediated uptake of aristolochic acid and inhibition using probenecid. (f) Normalized LDH release observed after dosing the OPTEC (n = 4–10) and PTEC-TERT1 (n = 3–9) tubules on chip with aristolochic acid for 48 h, two-way ANOVA, *p < 0.05, **p < 0.01, ***p < 0.005, ****p < 0.001.

References

    1. Eaton DC, Pooler JP. Vander’s renal physiology. Medicine. 2009;2009:5.
    1. Perazella MA. Renal vulnerability to drug toxicity. Clin. J. Am. Soc. Nephrol. 2009 doi: 10.2215/CJN.02050309. - DOI - PubMed
    1. Tiong HY, et al. Drug-induced nephrotoxicity: Clinical impact and preclinical in vitro models. Mol. Pharm. 2014 doi: 10.1021/mp400720w. - DOI - PubMed
    1. Eric D, Gary M. Drug-induced renal injury. Contin. Med. Educ. 2011;111:349.
    1. Choudhury D, Ahmed Z. Drug-associated renal dysfunction and injury. Nat. Clin. Pract. Nephrol. 2006 doi: 10.1038/ncpneph0076. - DOI - PubMed

Publication types

MeSH terms

Substances