. 2022 Sep 2;12(1):15018.
doi: 10.1038/s41598-022-19327-w.

Tissue-wide metabolomics reveals wide impact of gut microbiota on mice metabolite composition

Affiliations

Tissue-wide metabolomics reveals wide impact of gut microbiota on mice metabolite composition

Iman Zarei et al. Sci Rep. .

Abstract

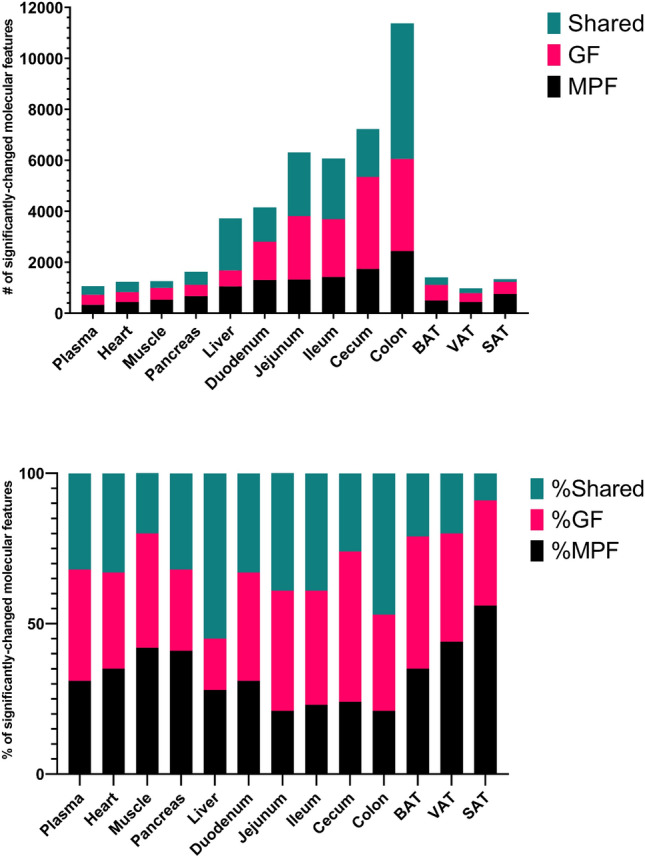
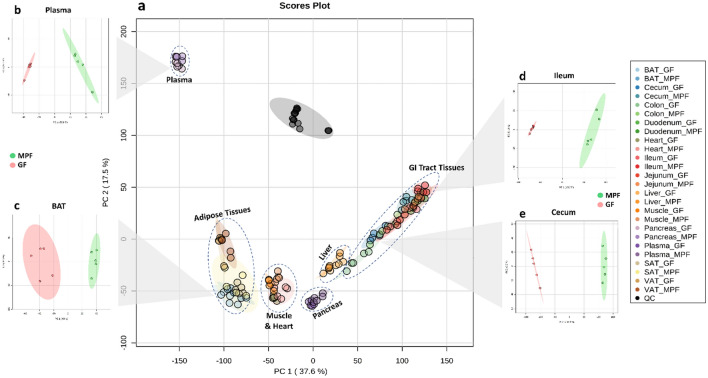
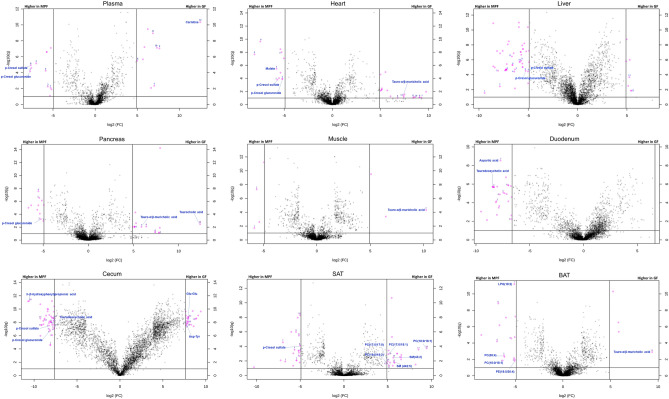
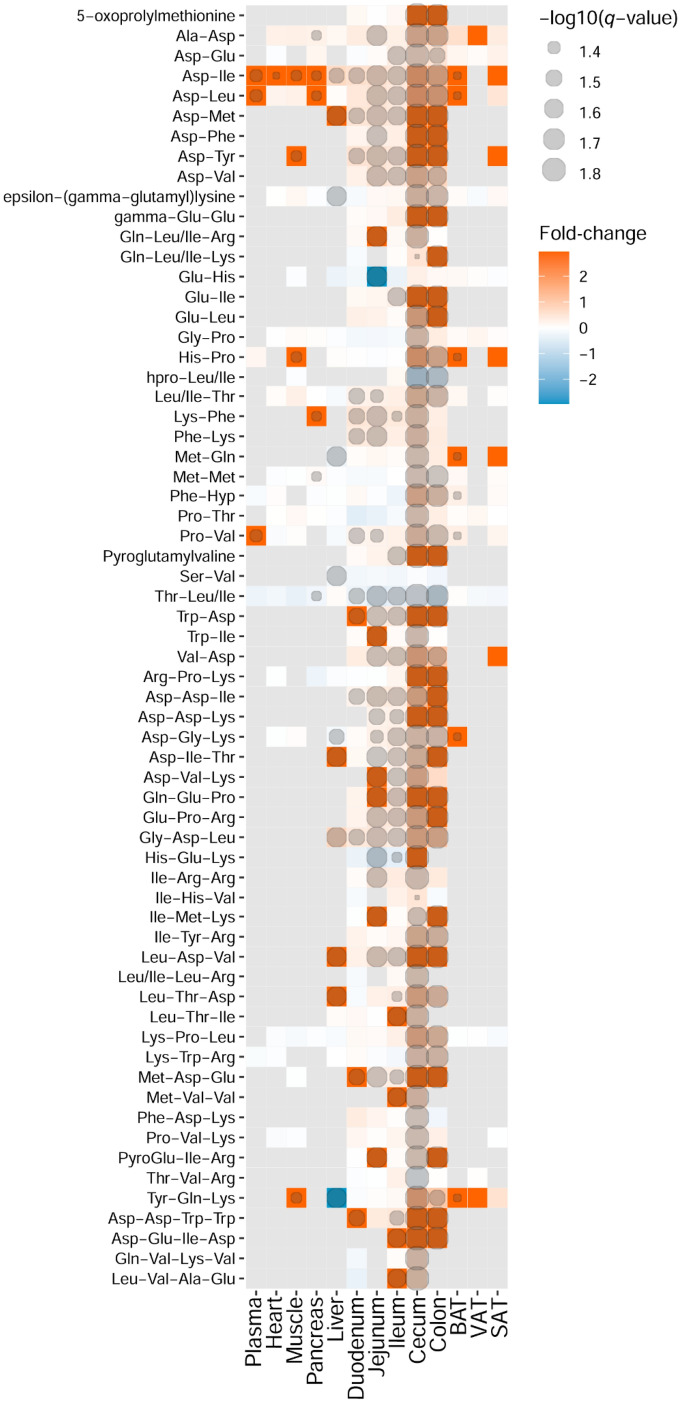
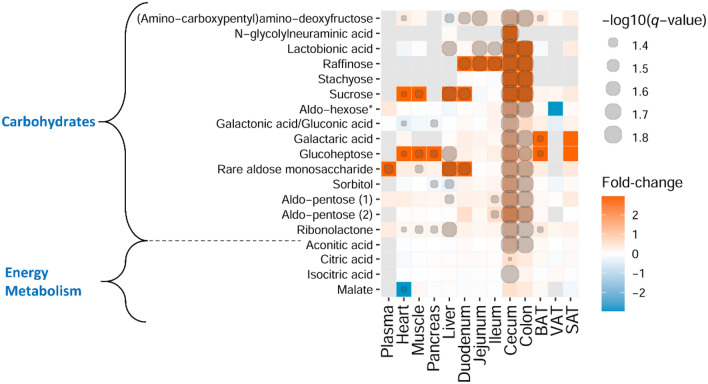
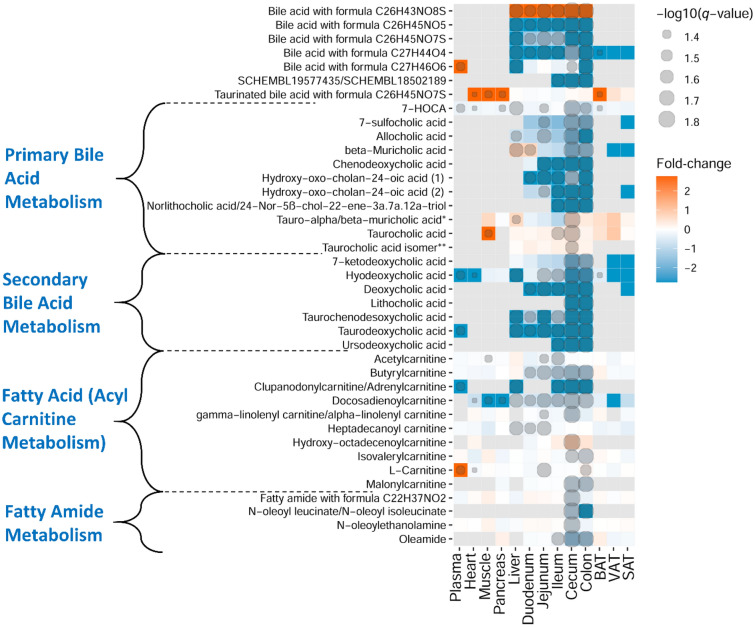
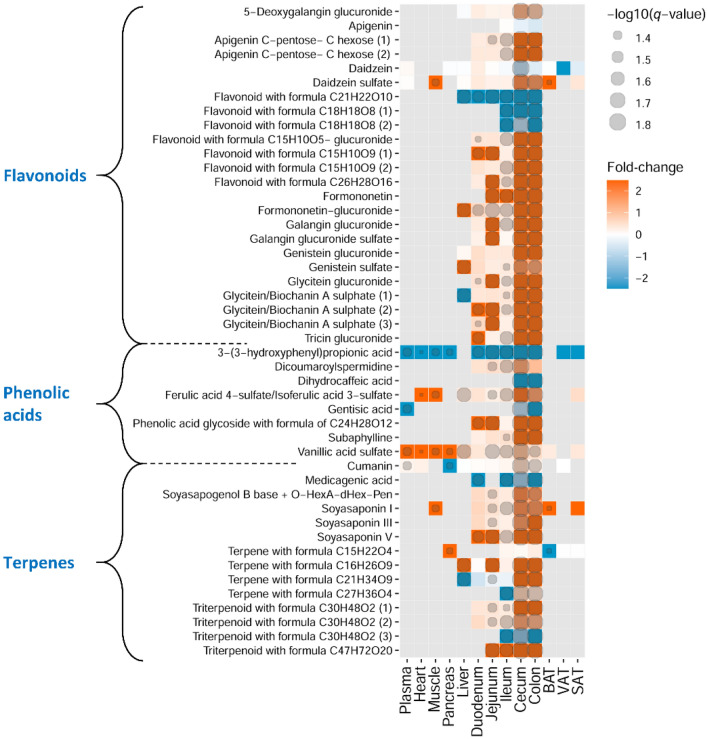
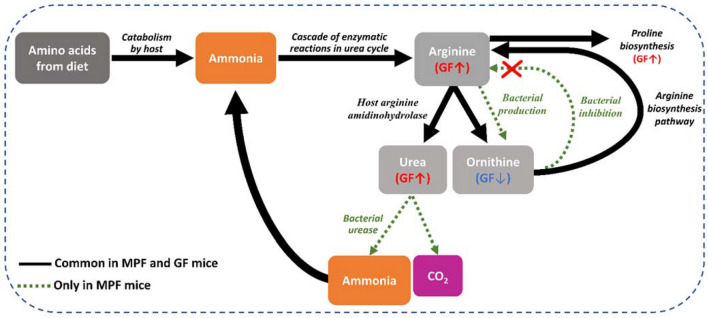
The essential role of gut microbiota in health and disease is well recognized, but the biochemical details that underlie the beneficial impact remain largely undefined. To maintain its stability, microbiota participates in an interactive host-microbiota metabolic signaling, impacting metabolic phenotypes of the host. Dysbiosis of microbiota results in alteration of certain microbial and host metabolites. Identifying these markers could enhance early detection of certain diseases. We report LC-MS based non-targeted metabolic profiling that demonstrates a large effect of gut microbiota on mammalian tissue metabolites. It was hypothesized that gut microbiota influences the overall biochemistry of host metabolome and this effect is tissue-specific. Thirteen different tissues from germ-free (GF) and conventionally-raised (MPF) C57BL/6NTac mice were selected and their metabolic differences were analyzed. Our study demonstrated a large effect of microbiota on mammalian biochemistry at different tissues and resulted in statistically-significant modulation of metabolites from multiple metabolic pathways (p ≤ 0.05). Hundreds of molecular features were detected exclusively in one mouse group, with the majority of these being unique to specific tissue. A vast metabolic response of host to metabolites generated by the microbiota was observed, suggesting gut microbiota has a direct impact on host metabolism.


Conflict of interest statement

Kati Hanhineva (KH), Ville M. Koistinen (VMK), Anton Klåvus (AK), and Ambrin Farizah Babu (AFB) are affiliated with Afekta Technologies Ltd. The remaining authors do not have any competing interests.

Figures

Figure 1
Figure 1
Number and percentage of significant molecular features per tissue. The total number of total significant molecular features from each tissue sourced from MPF only, GF only or shared (upper), Percentage of significant unique molecular features from each murine class per tissue (lower). Level of significance is defined as having a fold change ≥ 1.3, p value ≤ 0.05, and q value ≤ 0.05.
Figure 2
Figure 2
Principal component analysis (PCA) of the profiling data shows separation between tissues and mice groups. Data shown for reverse phase (RP) and HILIC modes with both positive and negative ionization; (a) PCA of all the analyzed samples from all tissues, (b) PCA of plasma samples from the GF and MPF mice, (c) PCA of BAT samples from the GF and MPF mice, (d) PCA of ileal samples from the GF and MPF mice, (e) PCA of cecal samples from the GF and MPF mice.
Figure 3
Figure 3
Volcano plots of the molecular features detected in nine representative tissues. The illustrated tissues include plasma, heart, liver, pancreas, muscle, duodenum, cecum, subcutaneous adipose tissue (SAT), and brown adipose tissue (BAT); see Supplementary Fig. 1 for volcano plots of all studied tissues individually with selected metabolites annotated. The binary logarithm of the fold change (FC) is shown as the function of the negative common logarithm of the q value (false discovery rate corrected p value). A positive log2(FC) signifies a higher abundance in the GF mice compared to the MPF mice. The purple dots represent molecular features fulfilling the significance criteria (FC > 200 or FC < 0.005 for the cecum and the colon tissues, FC > 100 or FC < 0.01 for duodenum, jejunum, and ileum, FC > 30 or FC < 0.033 for the rest of the tissue types, and q < 0.1). Molecular features are presented as their binary logarithmic fold change [log2(FC)]against the negative common logarithm of the q value [false discovery rate corrected p value; − log10(q)] of the differential expression between the GF and MPF mouse group. Although the purple dots represent molecular features fulfilling the above-mentioned significance criteria, and were unique to the sample type.
Figure 4
Figure 4
Heatmap representation of identified metabolites in amino acid chemical class. Fold-change (GF vs. MPF) and degree of significance comparisons were performed between the GF and MPF within each tissue (Mann–Whitney U-test and Benjamini and Hochberg false discovery rate correction p value ≤ 0.05, and q value ≤ 0.05). Each comparison for a tissue is represented by a colored cell. Gray cells represent metabolites that were not found in the tissue. Orange and blue cells represent metabolites more abundant in GF and MPF mice, respectively. *Metabolite is known to be bacterial-borne.
Figure 5
Figure 5
Heatmap representation of identified metabolites in peptide chemical class. Fold-change (GF vs. MPF) and degree of significance comparisons were performed between the GF and MPF within each tissue (Mann–Whitney U-test and Benjamini and Hochberg false discovery rate correction p value ≤ 0.05, and q value ≤ 0.05). Each comparison for a tissue is represented by a colored cell. Gray cells represent metabolites that were not found in the tissue. Orange and blue cells represent metabolites more abundant in GF and MPF mice, respectively.
Figure 6
Figure 6
Heatmap representation of identified metabolites involved in carbohydrate and energy metabolism. Fold-change (GF vs. MPF) and degree of significance comparisons were performed between the GF and MPF within each tissue (Mann–Whitney U-test and Benjamini and Hochberg false discovery rate correction p value ≤ 0.05, and q value ≤ 0.05). Each comparison for a tissue is represented by a colored cell. Gray cells represent metabolites that were not found in the tissue. Orange and blue cells represent metabolites more abundant in GF and MPF mice, respectively. *This metabolite is one the following isomers: Mannitol, Galactitol, Iditol.
Figure 7
Figure 7
Heatmap representation of identified metabolites in bile acids, fatty amides, carnitine, and acylcarnitine metabolism classes. Fold-change (GF vs. MPF) and degree of significance comparisons were performed between the GF and MPF within each tissue (Mann–Whitney U-test and Benjamini and Hochberg false discovery rate correction p value ≤ 0.05, and q value ≤ 0.05). Each comparison for a tissue is represented by a colored cell. Gray cells represent metabolites that were not found in the tissue. Orange and blue cells represent metabolites more abundant in GF and MPF mice, respectively. *Despite comparing the spectra against the purified standard, we were not able to differentiate between tauro-α-muricholic acid and tauro-β-muricholic acid. **Taurocholic acid isomer: either taurallocholate or tauroursocholate or taurohyocholate.
Figure 8
Figure 8
Heatmap representation of identified metabolites in phenolic acid derivatives, flavonoids, and terpenes. Fold-change (GF vs. MPF) and degree of significance comparisons were performed between the GF and MPF within each tissue (Mann–Whitney U-test and Benjamini and Hochberg false discovery rate correction p value ≤ 0.05, and q value ≤ 0.05). Each comparison for a tissue is represented by a colored cell. Gray cells represent metabolites that were not found in the tissue. Orange and blue cells represent metabolites more abundant in GF and MPF mice, respectively.
Figure 9
Figure 9
Summary of the fate of key metabolites (arginine, proline, urea, and ornithine) in the arginine and proline metabolism (urea cycle). Catabolism of dietary amino acids leads to the production of ammonia. Ammonia further undergoes conversion to urea via the urea cycle. In mammals with conventional gut microbiota, urea is broken down to ammonia and CO2 by bacterial urease. The ammonia produced by microbiota is released into the GI tract and is taken up by host cells and serves as a substrate to synthesize arginine in the urea cycle. Within the urea cycle, arginine is then converted into urea and ornithine. Simultaneously, ornithine can also be synthesized by gut bacteria. Ornithine produced from the two mentioned pathways, can enter the arginine biosynthesis pathway to synthesize more arginine; nevertheless, the bacterial inhibition of arginine biosynthesis can be inhibited by some bacteria. This excess amount of arginine can either enter the arginine and proline biosynthesis pathways or the urea cycle.
Figure 10
Figure 10
Proposed interrelation between tauro-conjugated muricholic acids and fatty amide biosynthesis in proximal and distal GI tract. When the FXR is bound to tauro-α- and β-muricholic acids in the upper section of the GI tract, the fatty amides biosynthesis is downregulated. As tauro-α- and -β-muricholic acids pass through the GI tract, they get deconjugated by gut microbiota. Therefore, there are fewer tauro-α- and β-muricholic acids are available to bind to FXR in the lower section of the GI tract. Thus, the FXR expression is upregulated in this area, and that may explain the higher abundances of fatty amides in the lower part of the GI tract.

Similar articles

Cited by

References

    1. Sidhu M, van der Poorten D. The gut microbiome. Austral. Family Physician. 2017;46:206–211. - PubMed
    1. Berg G, et al. Microbiome definition re-visited: Old concepts and new challenges. Microbiome. 2020;8:103. doi: 10.1186/s40168-020-00875-0. - DOI - PMC - PubMed
    1. Marchesi JR, Ravel J. The vocabulary of microbiome research: A proposal. Microbiome. 2015;3:31. doi: 10.1186/s40168-015-0094-5. - DOI - PMC - PubMed
    1. Huttenhower C, et al. Structure, function and diversity of the healthy human microbiome. Nature. 2012;486:207–214. doi: 10.1038/nature11234. - DOI - PMC - PubMed
    1. Wang B, Yao M, Lv L, Ling Z, Li L. The human microbiota in health and disease. Engineering. 2017;3:71–82. doi: 10.1016/J.ENG.2017.01.008. - DOI

Publication types