. 2022 Sep 2;12(1):14989.
doi: 10.1038/s41598-022-18965-4.

Geometry-controlled phase transition in vibrated granular media

Affiliations

Geometry-controlled phase transition in vibrated granular media

René Zuñiga et al. Sci Rep. .

Abstract

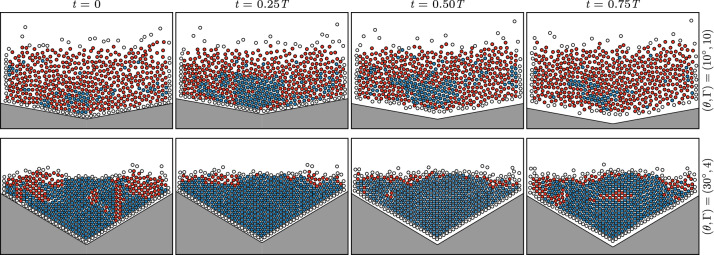
We report experiments on the dynamics of vibrated particles constrained in a two-dimensional vertical container, motivated by the following question: how to get the most out of a given external vibration to maximize internal disorder (e.g. to blend particles) and agitation (e.g. to absorb vibrations)? Granular media are analogs to classical thermodynamic systems, where the injection of energy can be achieved by shaking them: fluidization arises by tuning either the amplitude or the frequency of the oscillations. Alternatively, we explore what happens when another feature, the container geometry, is modified while keeping constant the energy injection. Our method consists in modifying the container base into a V-shape to break the symmetries of the inner particulate arrangement. The lattice contains a compact hexagonal solid-like crystalline phase coexisting with a loose amorphous fluid-like phase, at any thermal agitation. We show that both the solid-to-fluid volume fraction and the granular temperature depend not only on the external vibration but also on the number of topological defects triggered by the asymmetry of the container. The former relies on the statistics of the energy fluctuations and the latter is consistent with a two-dimensional melting transition described by the KTHNY theory.


Conflict of interest statement

The authors declare no competing interests.

Figures

Figure 1
Figure 1
(a) Sketch of the experimental setup. (b) Image crop displaying few particles and the instantaneous velocity field (yellow arrows). (c) The local order parameter ψ6(j) probes the internal orientations of the nearest neighbors (NN) of a particle j, thanks to the Delaunay triangulation (DT) of the lattice. (d) The local compaction C(j) is the ratio of particle cross-section (in orange) to cell area (in gray) of the Voronoi tessellation (VT, dual of the DT). Maps in a sample at rest (θ,Γ)=(10,0) of (e) the coordination number Z(j) (i.e. the number of NN of j) revealing the disclinations (isolated particles with Z=5 or Z=7) and the dislocations (pairs uniting Z=5 and Z=7, see the white lines), (f) the magnitude of the order parameter |ψ6(j)| and (g) the relative compaction Cr(j)=C(j)/Chcp.
Figure 2
Figure 2
(a) Fraction of disclinations, (b) fraction of dislocations, (c) order parameter, (d) relative compaction, (e) solid fraction and (f) normalized solid fraction as a function of V-shape angle θ and acceleration amplitude Γ. (a,b,e,f) are averages over time whereas (c,d) are averages over time and particles.
Figure 3
Figure 3
Snapshots of solid-like (blue) and fluid-like (red) particles at four instants of vibrations within a period of oscillation. Top: (θ,Γ)=(10,10). Bottom: (θ,Γ)=(30,4). The particles located at the outer edge of the ensemble, shown in white, are not used in the analysis.
Figure 4
Figure 4
Probability density function of the horizontal and vertical velocity fluctuations, v~x,y/vcell, for (a,b) (θ,Γ)=(30,4) and (c,d) (θ,Γ)=(10,10). The red lines in (ad) are the best fits with the normal distribution, see Eq. (2). Vertical standard deviation m2y versus (e) θ and (f) Γ. (g) Vertical skewness m3y and (h) vertical kurtosis m4y versus θ for different Γ. (i) Horizontal-to-vertical temperature ratio, kTx/kTy, and (j) mean temperature, kT=(kTx+kTy)/2, versus θ for different Γ.
Figure 5
Figure 5
(a) Solid fraction, (b) fluid fraction superimposed with defects fractions and (c) susceptibility, as a function of temperature, merging all the data shown in Figs. 1, 2 and 4 at various (θ,Γ) into a single data set. The black curve in (a,b) stands for the Maxwell–Boltzmann cumulative density function cdf(E,T)=1-exp(-E/kT) with E=108 nJ, see Eq. (3). The blue and red curves in (b) are guidelines parallel to the Maxwell–Boltzmann approximation. Black bold markers located at T=0 in (a) and (c) correspond to the average data obtained from ten realizations of static heaps at each angle, as seen for instance in Fig. 1. (d) Snapshots of solid-like (blue) and fluid-like (red) particles, as in Fig. 3, showing weak (first), intermediate (second and third) and large (fourth) temperatures and solid fractions; note the two intermediate cases with different (θ,Γ) but similar T and nS.

References

    1. Aranson IS, Tsimring LS. Patterns and collective behavior in granular media: Theoretical concepts. Rev. Mod. Phys. 2006;78:641–692. doi: 10.1103/RevModPhys.78.641. - DOI
    1. Jaeger HM, Nagel SR, Behringer RP. Granular solids, liquids, and gases. Rev. Mod. Phys. 1996;68:1259–1273. doi: 10.1103/RevModPhys.68.1259. - DOI
    1. de Gennes PG. Granular matter: A tentative view. Rev. Mod. Phys. 1999;71:S374–S382. doi: 10.1103/RevModPhys.71.S374. - DOI
    1. Olafsen JS, Urbach JS. Clustering, order, and collapse in a driven granular monolayer. Phys. Rev. Lett. 1998;81:4369–4372. doi: 10.1103/physrevlett.81.4369. - DOI
    1. Quinn PV, Hong DC. Liquid-solid transition of hard spheres under gravity. Phys. Rev. E. 2000;62:8295–8298. doi: 10.1103/physreve.62.8295. - DOI - PubMed