. 2023 Jan 4;31(1):134-153.
doi: 10.1016/j.ymthe.2022.08.021. Epub 2022 Sep 2.

CXCL11-armed oncolytic adenoviruses enhance CAR-T cell therapeutic efficacy and reprogram tumor microenvironment in glioblastoma

Affiliations

CXCL11-armed oncolytic adenoviruses enhance CAR-T cell therapeutic efficacy and reprogram tumor microenvironment in glioblastoma

Guoqing Wang et al. Mol Ther. .

Abstract

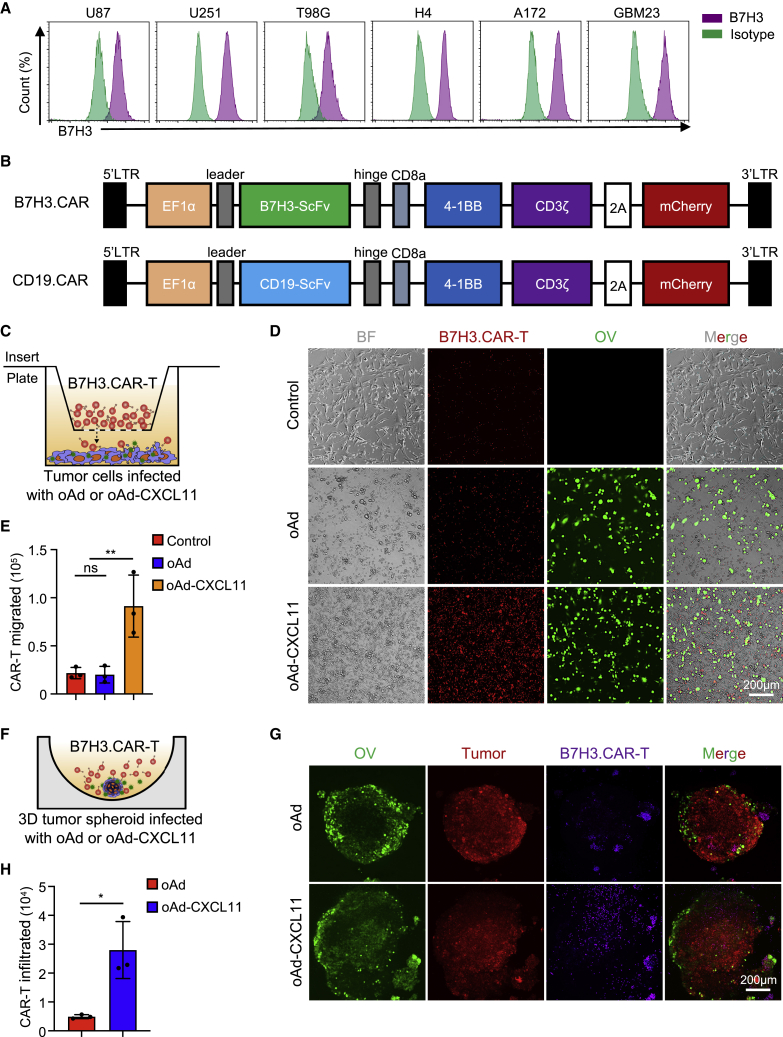
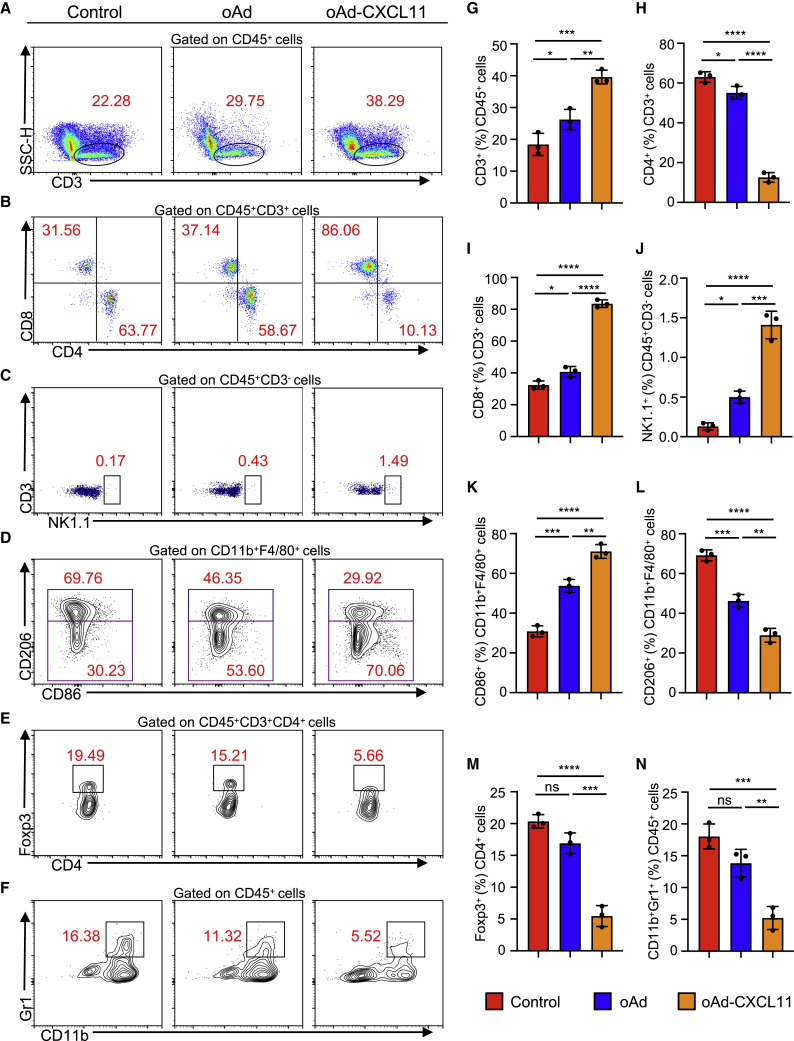
Glioblastoma (GBM) is the most aggressive primary malignant brain cancer and urgently requires effective treatments. Chimeric antigen receptor T (CAR-T) cell therapy offers a potential treatment method, but it is often hindered by poor infiltration of CAR-T cells in tumors and highly immunosuppressive tumor microenvironment (TME). Here, we armed an oncolytic adenovirus (oAds) with a chemokine CXCL11 to increase the infiltration of CAR-T cells and reprogram the immunosuppressive TME, thus improving its therapeutic efficacy. In both immunodeficient and immunocompetent orthotopic GBM mice models, we showed that B7H3-targeted CAR-T cells alone failed to inhibit GBM growth but, when combined with the intratumoral administration of CXCL11-armed oAd, it achieved a durable antitumor response. Besides, oAd-CXCL11 had a potent antitumor effect and reprogramed the immunosuppressive TME in GL261 GBM models, in which increased infiltration of CD8+ T lymphocytes, natural killer (NK) cells, and M1-polarized macrophages, while decreased proportions of myeloid-derived suppressor cells (MDSCs), regulatory T cells (Tregs) and M2-polarized macrophages were observed. Furthermore, the antitumor effect of the oAd-CXCL11 was CD8+ T cell dependent. Our findings thus revealed that CXCL11-armed oAd can improve immune-virotherapy and can be a promising adjuvant of CAR-T therapy for GBM.

Keywords: CAR-T; GBM; chemokine; combination therapy; oncolytic virus; tumor microenvironment.


Conflict of interest statement

Declaration of interests G.W., A.T., and L.Z. have filed patents related to this work. The other authors declare no competing interests.

Figures

Figure 1
Figure 1
CXCR3 is highly expressed on freshly isolated T cells and CXCL11 was a potent ligand to attract CAR-T cells (A and B) Heatmap (A) and ridgeline plot (B) of expression of chemokine receptor genes in the human T cells (both GBM patients and healthy donors). (C) The expression of CXCR3 on freshly isolated T cells from GBM patients and healthy donors and their corresponding B7H3.CAR-T cells were measured by flow cytometry. (D) Summary data of (C). (E) Media were supplemented with various concentrations of recombinant CXCL9, CXCL10, and CXCL11, after which Transwell assay was performed and the directional movements of B7H3.CAR-T cells were monitored. (F) Summary data of (E). Scale bar, 50 μm. The statistical analysis was estimated by one-way ANOVA with Tukey’s correction. Data are presented as mean values ±SD. ∗p < 0.05, ∗∗p < 0.01.
Figure 2
Figure 2
Construction and characterization of oAd and oAd-CXCL11 (A) Schema of oncolytic adenoviruses. Top: genetic map of control oncolytic adenovirus, oAd, with deletion of E3 region sparing adenovirus death protein (ADP), insertion of the hTERT promoter into the E1 region, and insertion of EGFP gene into the E3 region. Bottom: genetic map of oAd-CXCL11 showing the inserted coding gene of the human CXCL11. (B) GBM cell lines and B7H3.CAR-T cells were explored for the expression levels of coxsackie-adenovirus receptor (CXADR) by flow cytometric analysis. A549, a lung carcinoma cell line, was utilized as a positive control. Green and purple filled lines correspond to isotype control and CXADR, respectively. (C) Human U87 glioma cells, U251 glioma cells, and GBM patient-derived GBM23 cells were challenged with oAd and oAd-CXCL11 at an MOI of 1. The oncolytic adenovirus titers were measured using TCID50 assay at different time points post infection. (D) The replication of the oncolytic virus and secretion of CXCL11 at different times post infection were confirmed by immunoblot. (E) The quantity of secreted CXCL11 was measured in the culture media harvested from infected GBM cells by ELISA assay. (F) U87, U251 glioma cells, and GBM patient-derived GBM23 cells were infected with different titers of oAd-CXCL11 or with the control adenovirus oAd and measured 48 h later by MTT assay. (G) Cell lysate of oAd-CXCL11-infected U87 cells was harvested. Full-length Caspase-3 and cleaved Caspase-3 were detected by immunoblot. (H) U87 glioma cells were infected with saline control, oAd, or oAd-CXCL11 at an MOI of 1 for 24 h. The early apoptotic cells were confirmed as the 7-AAD/Annexin V+ population. (I) Summary data of (H). All data were presented in at least three independent experiments. The statistical analysis was estimated by one-way ANOVA with Tukey’s correction. Data are presented as mean values ±SD. ∗∗∗∗p < 0.0001; ns, not significant.
Figure 3
Figure 3
oAd-CXCL11 improved the migration and infiltration of B7H3.CAR-T cells (A) B7H3 expression on GBM cell lines and GBM23 cells was detected by flow cytometry. (B) Schematic of B7H3.CAR and CD19.CAR construct. (C) Schema of the Transwell assay. B7H3.CAR-T cells (2 × 105) were plated to the upper chambers and the lower chambers contained U87 cells (5 × 104) infected with oAd, oAd-CXCL11, or saline control. (D) Representative images showing the migration of B7H3.CAR-T cells. Scale bar, 200 μm. (E) Summary data of (D). (F) Schema of the chemotaxis experiment assessing the infiltration of B7H3.CAR-T cells into 3D tumor spheroid. 3D tumor spheroids of U87-mCherry cells were infected with oAd or oAd-CXCL11 at an MOI of 1 for 24 h. Then B7H3.CAR-T cells (5 × 104) were added to the wells. (G) Representative images showing the infiltration of B7H3.CAR-T cell. Scale bar, 200 μm. (H) Summary data of (G). The statistical analysis was estimated by one-way ANOVA with Tukey’s correction. Data are presented as mean values ±SD. ∗p < 0.05; ∗∗p < 0.01; ns, not significant.
Figure 4
Figure 4
Combined oAd-CXCL11 and B7H3.CAR-T cells have a superior cytotoxic effect against GBM cells in vitro (A) In vitro modified coculture assays based on Transwell experiments were used to assess the antitumor efficacy of either monotherapy or combination therapy. U87 cells were seeded and infected with oAd, oAd-CXCL11, or saline control for 48 h. Then B7H3.CAR-T or CD19.CAR-T cells were added to the upper chambers; 24 h later, cell viabilities were assessed using crystal violet staining assay, and (B) the viable and stained cells were counted. (C) The RTCA system was used to assess the antitumor effect of either monotherapy or combination therapy and the viable cells were calculated as the cell index. (D) Representative images showing the cytotoxic effect of either monotherapy or combined therapy against 3D spheroids of U87 cells by Calcein/PI staining. Scale bar, 200 μm. (E) Concentrations of TNFα and IFNγ in culture media were measured by ELISA. The statistical analysis was estimated by one-way ANOVA with Tukey’s correction. Data are presented as mean values ± SD. ∗∗∗p < 0.001; ∗∗∗∗p < 0.0001; ns, not significant.
Figure 5
Figure 5
A comparison of combined therapy and monotherapy for improving in vivo CAR-T therapy in a human GBM orthotopic model (A) Experimental timeline. An orthotopic human GBM mice model was utilized by intracranial administration of 1 × 105 GBM23-Luc cells into NCG mice. On the seventh day, mice were intratumorally administered with 5 × 108 PFU of oAd, oAd-CXCL11, or vehicle control. Two days after virus administration, 5 × 106 B7H3.CAR-T cells or vehicle control were intravenously administered. (B) Representative images of GBM23-Luc growth in mice after different treatments. (C) The change of tumor total flux (p/s) in different groups. (D) Survival times of tumor-bearing mice were analyzed using the Kaplan-Meier method with the log rank test (n = 5). (E) A body weight measurement was taken once every other day for each experimental mouse. (F) H&E staining of the specimen isolated from experimental mice (scale bar, 2 mm) and immunostaining of CD3 and E1A (scale bar, 50 μm). (G) The ratio of CD3+ cells per field in groups with different treatments. (H–J) Detection of CXCL11 (H), IFNγ (I), and TNFα (J) by ELISA in tumor homogenates harvested from experimental mice. The statistical analysis was estimated by one-way ANOVA with Tukey’s correction. Data are presented as mean values ± SD. ∗∗p < 0.01; ∗∗∗∗p < 0.0001; ns, not significant.
Figure 6
Figure 6
A comparison of oAd-CXCL11 and oAd for the antitumor efficacy in an immunocompetent mouse GBM model (A) Schema of oncolytic adenoviruses. Top: genetic map of control oncolytic adenovirus, oAd, with deletion of E3 region sparing ADP, insertion of the hTERT promoter into the E1 region, and insertion of EGFP gene into the E3 region. Bottom: genetic map of oAd-CXCL11 showing the inserted coding gene of the murine CXCL11. (B) Experimental timeline. An immunocompetent GBM mice model was utilized by intracranial administration of 1 × 105 GL261 mouse GBM cells into C57BL/6 mice. On the third day, mice were intratumorally administered with 5 × 108 PFU of oAd, oAd-CXCL11, or vehicle control. (C) Representative images of GL261 growth in mice after different treatments. (D) The change of tumor total flux (p/s) in different groups. (E) Survival times of tumor-bearing mice were analyzed using the Kaplan-Meier method with the log rank test (n = 5). (F) A body weight measurement was taken once every other day for each experimental mouse. Data are presented as mean values ± SD. ∗∗p < 0.01, ∗∗∗p < 0.001.
Figure 7
Figure 7
The immune microenvironment of GL261 tumors was examined using flow cytometry Representative images of (A) T cells, (B) CD4+ and CD8+ T cells, (C) NK cells, (D) M1 or M2 macrophages, (E) regulatory T cells (Tregs), and (F) myeloid-derived suppressor cells (MDSCs). (G) Summary data of (A). (H and I) Summary data of (B). (J) Summary data of (C). (K and L) Summary data of (D). (M) Summary data of (E). (N) Summary data of (F). The statistical analysis was estimated by one-way ANOVA with Tukey’s correction. Data are presented as mean values ± SD. ∗p < 0.05, ∗∗p < 0.01, ∗∗∗p < 0.001, ∗∗∗∗p < 0.0001.
Figure 8
Figure 8
The antitumor effect of oAd-CXCL11 is mediated by CD8+ T cells, and combined therapy induces a better antitumor activity in GL261 tumors (A) Experimental timeline. An immunocompetent GBM mice model was utilized by intracranial administration of 1 × 105 GL261 mouse GBM cells into C57BL/6 mice. On the third day, mice were intratumorally administered with 5 × 108 PFU of oAd-CXCL11 or vehicle control. Anti-NK or anti-CD8 antibodies were intraperitoneally administered on day 3, 4, and 5. (B) Representative images of GL261 growth in mice after different treatments. (C) Survival time of GL261 tumor-bearing mice. (D) Murine CAR construct. (E) Experimental timeline. (F) Representative images of GL261 growth in mice after different treatments. (G) The change of BLI (p/s) in different groups. (H) Survival of GL261 GBM-bearing mice. (I) CAR-T cell infiltration 7 days post infusion was confirmed by immunohistochemistry and flow cytometry for the marker gene CD34. Scale bar, 50 μm. (J) and (K) Quantification of (I). Survival times of tumor-bearing mice were analyzed using the Kaplan-Meier method with the log rank test (n = 5). The statistical analysis was estimated by one-way ANOVA with Tukey’s correction. Data are presented as mean values ± SD. ∗p < 0.05; ∗∗p < 0.01; ∗∗∗∗p < 0.0001; ns, not significant.

References

    1. Stupp R., Mason W.P., van den Bent M.J., Weller M., Fisher B., Taphoorn M.J.B., Belanger K., Brandes A.A., Marosi C., Bogdahn U., et al. Radiotherapy plus concomitant and adjuvant temozolomide for glioblastoma. N. Engl. J. Med. 2005;352:987–996. - PubMed
    1. Tan A.C., Ashley D.M., López G.Y., Malinzak M., Friedman H.S., Khasraw M. Management of glioblastoma: state of the art and future directions. CA. Cancer J. Clin. 2020;70:299–312. - PubMed
    1. Medikonda R., Dunn G., Rahman M., Fecci P., Lim M. A review of glioblastoma immunotherapy. J. Neurooncol. 2021;151:41–53. - PubMed
    1. Johnson P.C., Abramson J.S. Engineered T cells: CAR T cell therapy and beyond. Curr. Oncol. Rep. 2022;24:23–31. - PubMed
    1. Lim W.A., June C.H. The principles of engineering immune cells to treat cancer. Cell. 2017;168:724–740. - PMC - PubMed

Publication types

Substances