. 2022 Oct:56:102446.
doi: 10.1016/j.redox.2022.102446. Epub 2022 Aug 23.

LDHA-mediated metabolic reprogramming promoted cardiomyocyte proliferation by alleviating ROS and inducing M2 macrophage polarization

Affiliations

LDHA-mediated metabolic reprogramming promoted cardiomyocyte proliferation by alleviating ROS and inducing M2 macrophage polarization

Yijin Chen et al. Redox Biol. 2022 Oct.

Abstract

Aims: Metabolic switching during heart development contributes to postnatal cardiomyocyte (CM) cell cycle exit and loss of regenerative capacity in the mammalian heart. Metabolic control has potential for developing effective CM proliferation strategies. We sought to determine whether lactate dehydrogenase A (LDHA) regulated CM proliferation by inducing metabolic reprogramming.

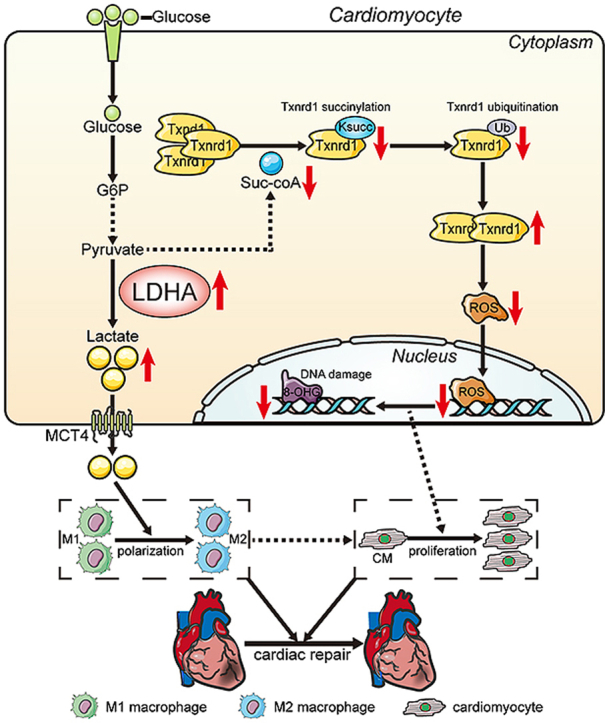
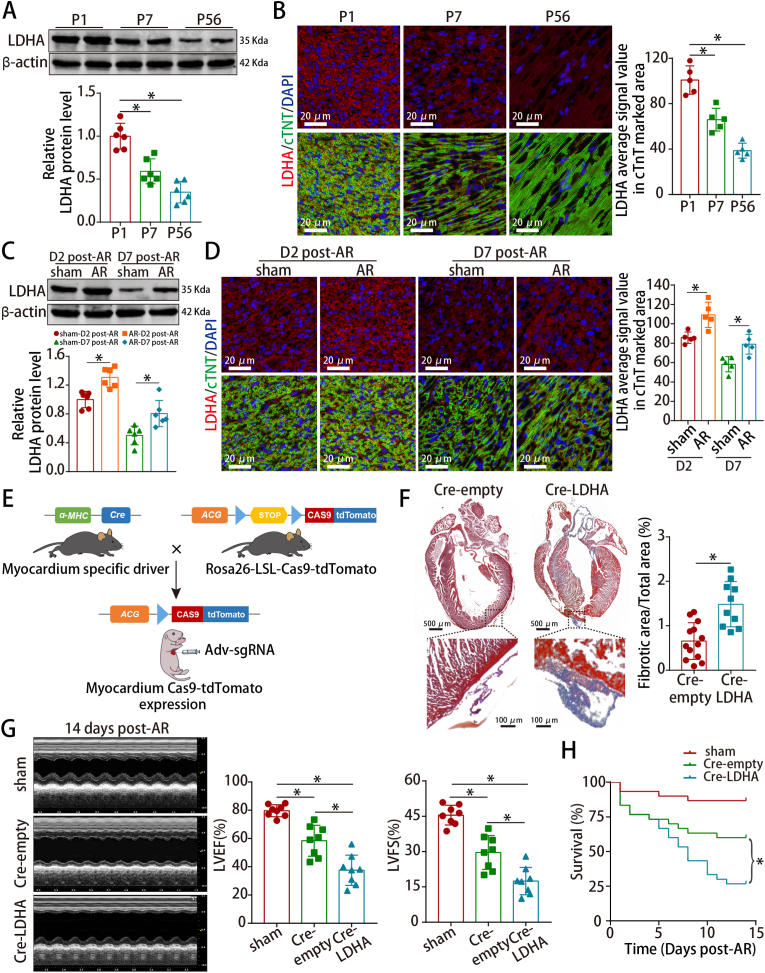
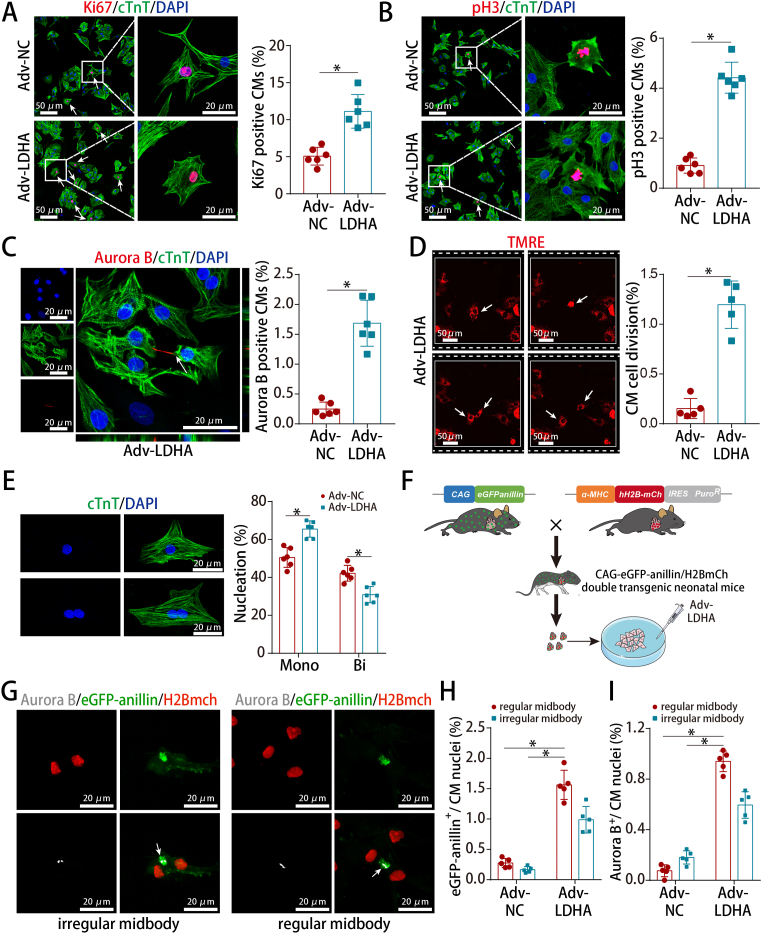
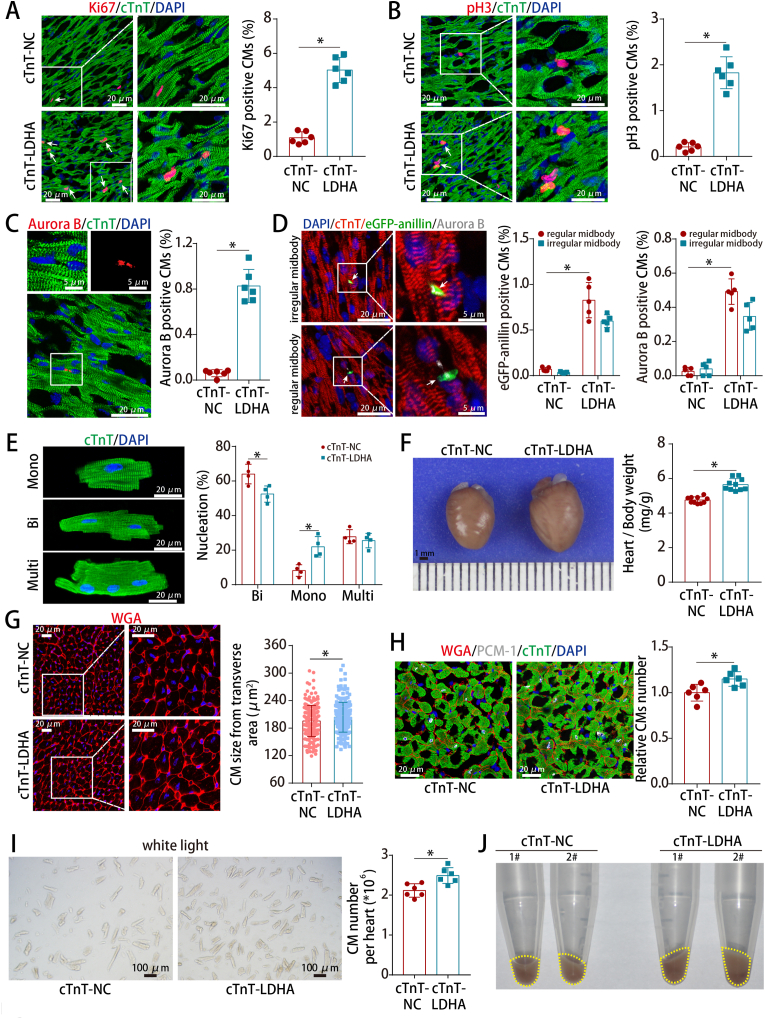
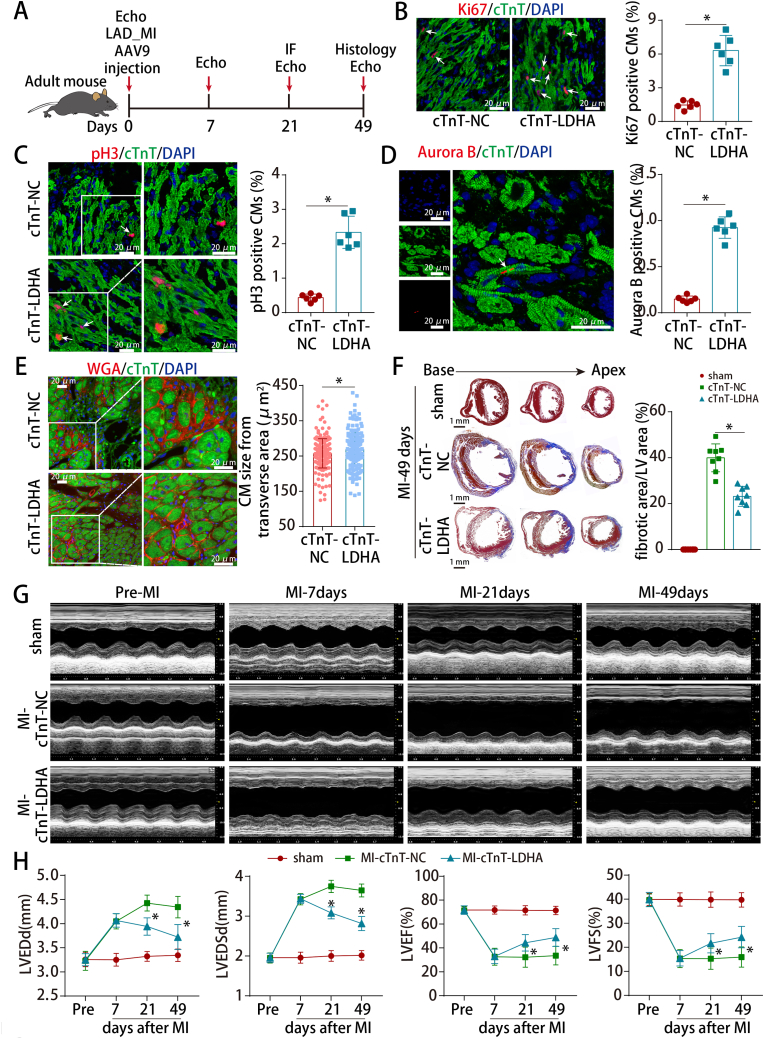
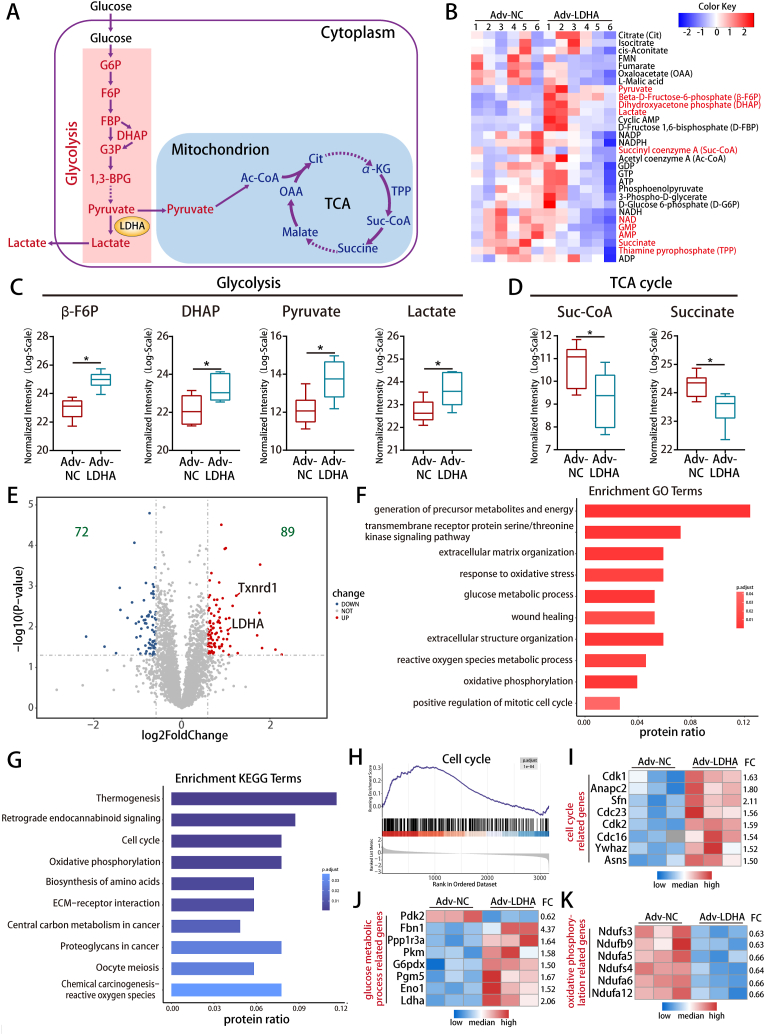
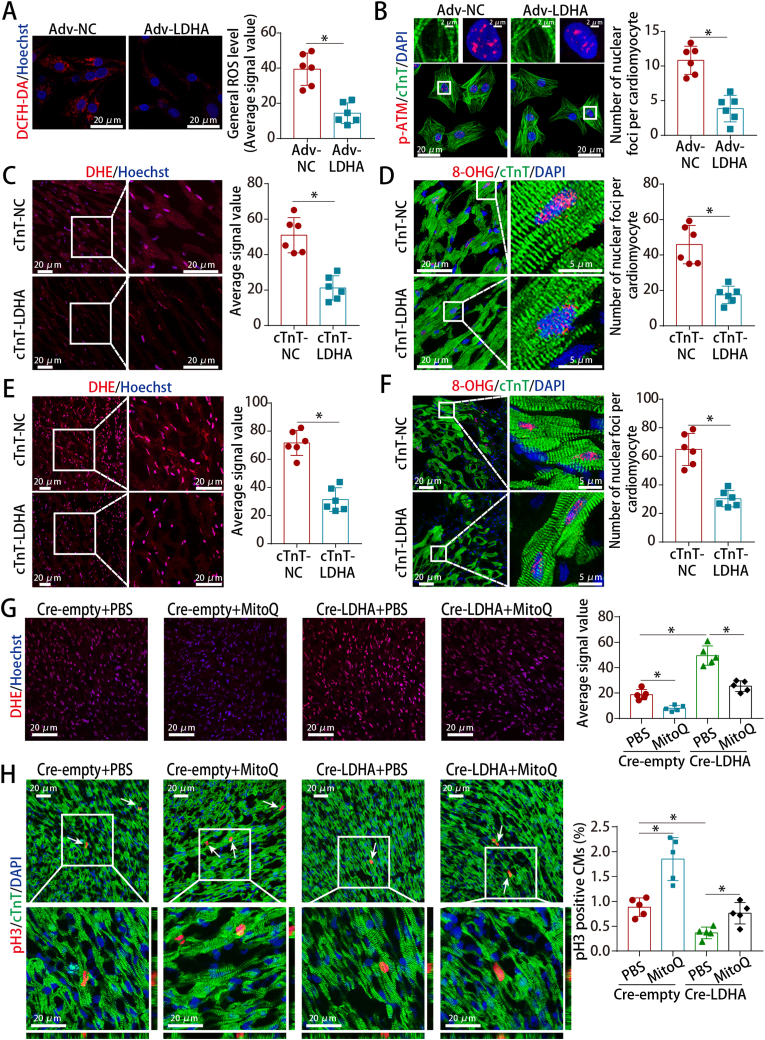
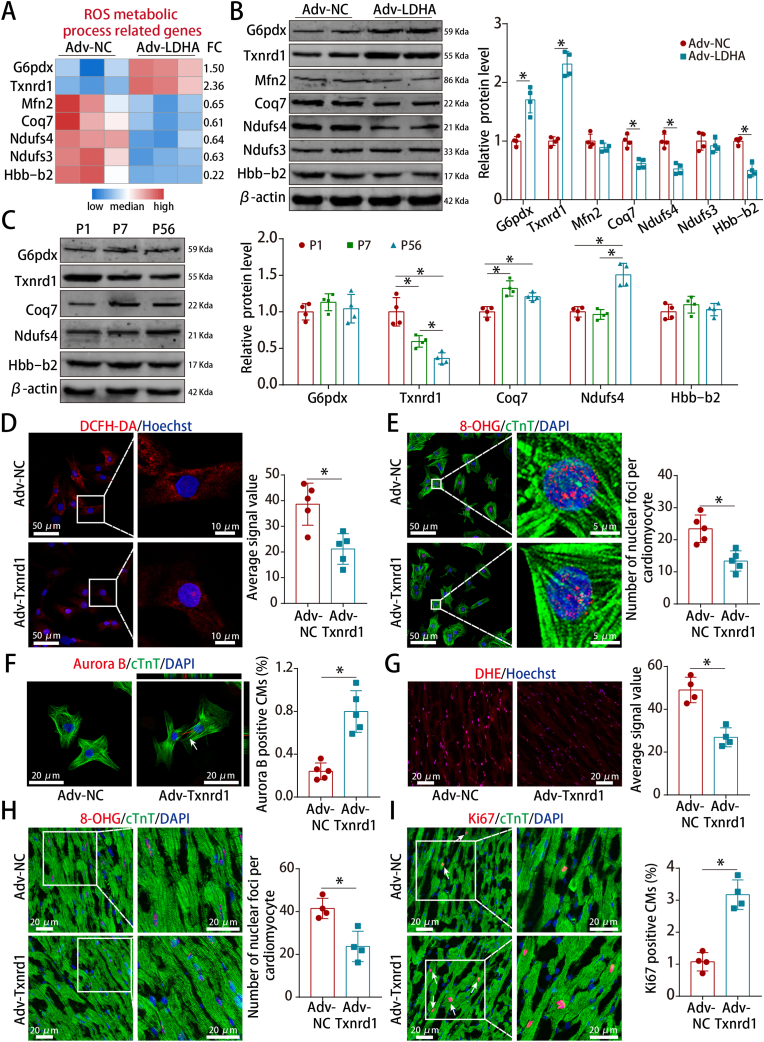
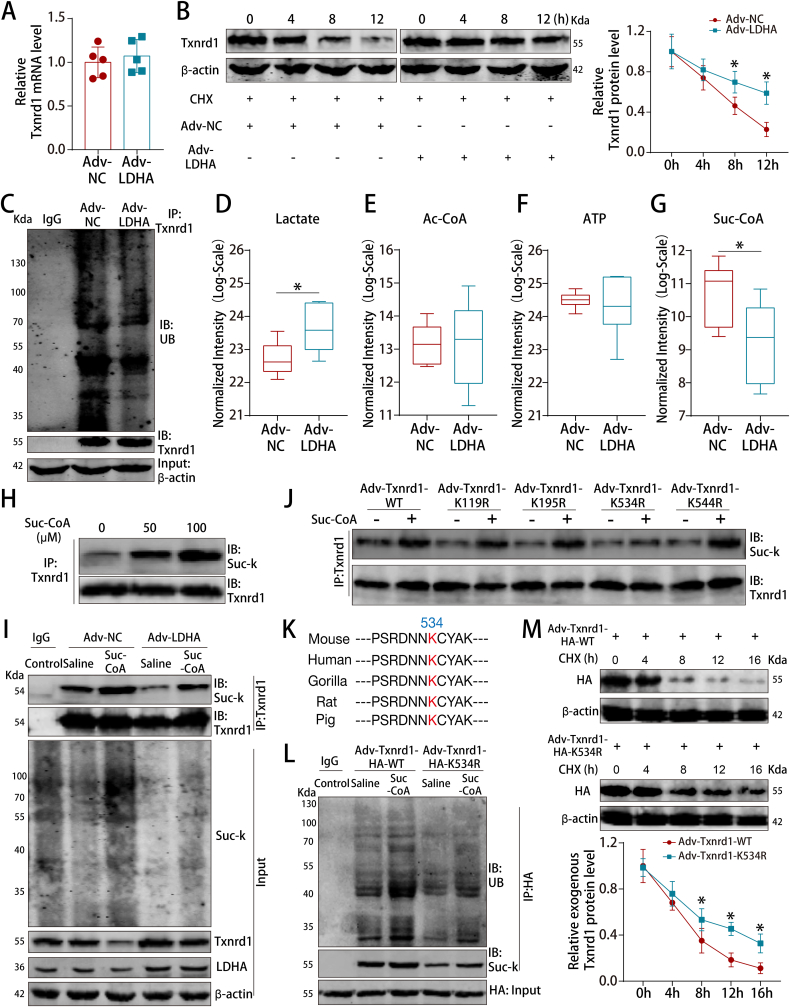
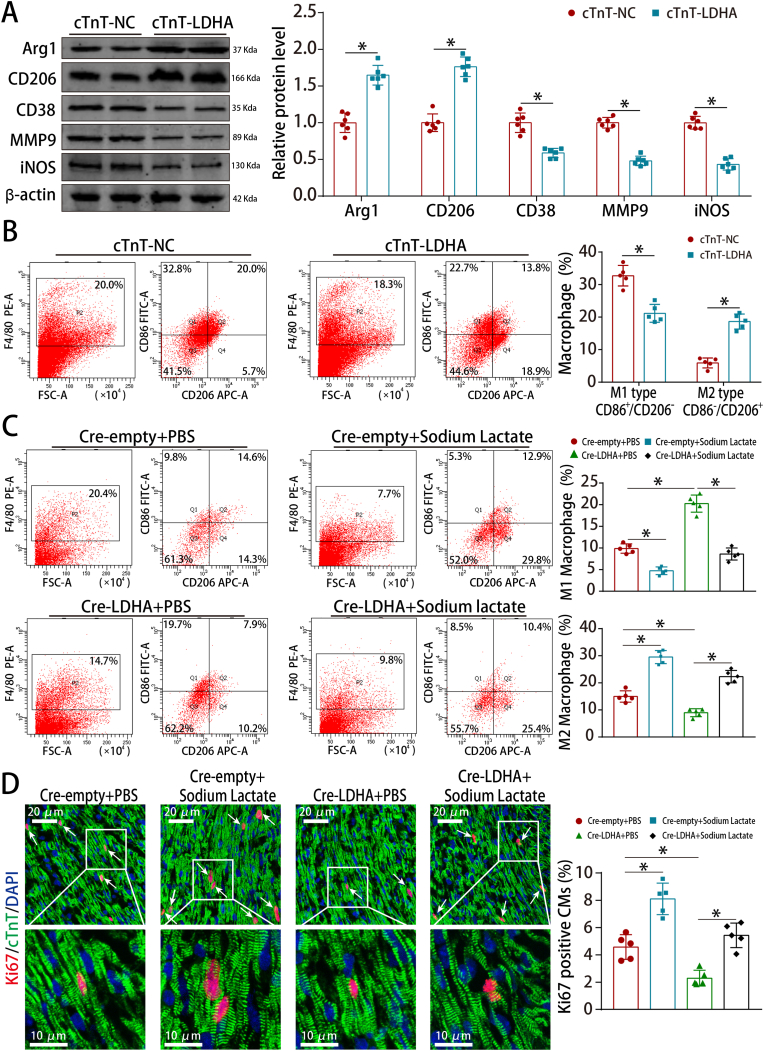
Methods and results: LDHA expression was high in P1 hearts and significantly decreased during postnatal heart development. CM-specific LDHA knockout mice were generated using CRISPR/Cas9 technology. CM-specific LDHA knockout inhibited CM proliferation, leading to worse cardiac function and a lower survival rate in the neonatal apical resection model. In contrast, CM-specific overexpression of LDHA promoted CM proliferation and cardiac repair post-MI. The α-MHC-H2B-mCh/CAG-eGFP-anillin system was used to confirm the proliferative effect triggered by LDHA on P7 CMs and adult hearts. Metabolomics, proteomics and Co-IP experiments indicated that LDHA-mediated succinyl coenzyme A reduction inhibited succinylation-dependent ubiquitination of thioredoxin reductase 1 (Txnrd1), which alleviated ROS and thereby promoted CM proliferation. In addition, flow cytometry and western blotting showed that LDHA-driven lactate production created a beneficial cardiac regenerative microenvironment by inducing M2 macrophage polarization.

Conclusions: LDHA-mediated metabolic reprogramming promoted CM proliferation by alleviating ROS and inducing M2 macrophage polarization, indicating that LDHA might be an effective target for promoting cardiac repair post-MI.

Keywords: Cardiomyocyte proliferation; LDHA; Macrophage polarization; Metabolic reprogramming; ROS.


Conflict of interest statement

Declaration of competing interest The authors have no conflicts of interest to declare.

Figures

Image 1
Graphical abstract
Fig. 1
Fig. 1
LDHA was involved in neonatal cardiac regeneration after injury. (AD) LDHA protein levels in mouse hearts at different ages and neonatal hearts harvested at 2 and 7 dpar. n = 6 mice in A and C; n = 5 mice in B and D. (E) Scheme depicting the cross-breeding of the α-MHC-Cre mice with the Cas9-tdTomato mice to obtain mice myocardially expressing Cas9, followed by the delivery of Adv-expressing sgRNA. (F) Masson staining of neonatal hearts harvested at 14 dpar. n = 13 mice in Cre-empty and n = 10 mice in Cre-LDHA groups. (GH) Analysis of cardiac function and survival rate after LDHA deficiency. n = 8 mice in G; n = 30 mice in H. Bars = 20 μm in B and D, and 500 μm (upper) and 100 μm (lower) in F. Statistical significance was calculated using an unpaired t-test in F, one-way ANOVA in A-D and the log-rank (Mantel-Cox) test in H; *P < 0.05.
Fig. 2
Fig. 2
LDHA overexpression promoted P7 CM proliferation in vitro. (A) Ki67 staining in P7 CMs (539 CMs from 12 images of 6 mice in Adv-NC and 866 CMs from 12 images of 6 mice in Adv-LDHA groups). (B) pH3 staining in P7 CMs (1297 CMs from 24 images of 6 mice in Adv-NC and 1486 CMs from 24 images of 6 mice in Adv-LDHA groups). (C) Aurora B staining in P7 CMs (3342 CMs from 6 mice in Adv-NC and 3797 CMs from 6 mice in Adv-LDHA groups). (D) Time-lapse images of P7 CM cytokinesis (4479 CMs from 5 mice in Adv-NC and 4357 CMs from 5 mice in Adv-LDHA groups). (E) Analysis of CM cell nucleation in isolated P7 CMs (1963 CMs from 6 mice in Adv-NC and 2190 CMs from 6 mice in Adv-LDHA groups). (F) Scheme depicting the cross-breeding of α-MHC-H2B-mCh mice with the CAG-eGFP-anillin proliferation indicator mice. (GI) Example of a P7 double transgenic CM expressing eGFP-anillin (green) and aurora B (white) after LDHA overexpression and the frequency of regular and irregular midbodies identified by anillin or aurora B staining (5103 CMs from 5 mice in Adv-NC and 2240 CMs from 5 mice in Adv-LDHA groups). Bars = 50 μm (left) and 20 μm (right) in A and B, 20 μm in C, E and G, and 50 μm in D. Statistical significance was calculated using an unpaired t-test in A-D and two-way ANOVA in E and H–I; *P < 0.05. (For interpretation of the references to colour in this figure legend, the reader is referred to the Web version of this article.)
Fig. 3
Fig. 3
LDHA overexpression promoted adult CM proliferation in vivo. (A) Ki67 staining in normal adult hearts (730 CMs from 12 images of 6 mice in cTnT-NC and 945 CMs from 12 images of 6 mice in cTnT-LDHA groups). (B) pH3 staining in normal adult hearts (3544 CMs from 30 images of 6 mice in cTnT-NC and 2632 CMs from 30 images of 6 mice in cTnT-LDHA groups). (C) Aurora B staining in normal adult hearts (8814 CMs from 6 mice in cTnT-NC and 5486 CMs from 6 mice in cTnT-LDHA groups). (D) Example of a CAG-eGFP-anillin transgenic adult CM expressing eGFP-anillin (green) in an asymmetrical or symmetrical midbody (arrow) and aurora B staining (white) after treatment and the frequencies of regular and irregular midbodies in normal adult hearts (7726 CMs from 5 mice in cTnT-NC and 5058 CMs from 5 mice in cTnT-LDHA groups). (E) Analysis of nucleation in adult CMs isolated from the cTnT-NC and cTnT-LDHA groups at 21 days after AAV9 infection (789 CMs from 4 mice in cTnT-NC and 544 CMs from 4 mice in cTnT-LDHA groups). (F) Ratios of heart weight to body weight in normal adult hearts after LDHA overexpression. n = 10 mice. (G) WGA staining of left ventricle heart sections of mice after LDHA overexpression (216 CMs from 15 images of 5 mice in cTnT-NC and 198 CMs from 15 images of 5 mice in cTnT-LDHA groups). (H) Stereological analysis of the CM numbers in normal adult hearts after LDHA overexpression. n = 6 mice. (I) Approximately 2-3 × 106 CMs per sample were counted using an automated cell counter. n = 6 mice. (J) Whole mounts of CMs isolated from adult heart after LDHA overexpression. Bars = 20 μm in A-B, E and G-H, 5 μm (upper) and 20 μm (lower) in C, 20 μm (left) and 5 μm (right) in D, 1 mm in F, and 100 μm in I. Statistical significance was calculated using an unpaired t-test in A-C, F, H–I, two-way ANOVA in D-E and nonparametric Mann-Whitney U test in G; *P < 0.05. (For interpretation of the references to colour in this figure legend, the reader is referred to the Web version of this article.)
Fig. 4
Fig. 4
LDHA overexpression improved cardiac function after MI in adult mice. (A) Schematic of the MI experiments in adult mouse hearts injected with AAV9. Echo, echocardiography. (B) Ki67 staining in adult mouse MI model hearts at 21 days post-MI (866 CMs from 12 images of 6 mice in cTnT-NC and 1003 CMs from 12 images of 6 mice in cTnT-LDHA groups). (C) pH3 staining in adult mouse MI model hearts at 21 days post-MI (1459 CMs from 24 images of 6 mice in cTnT-NC and 1825 CMs from 24 images of 6 mice in cTnT-LDHA groups). (D) Aurora B staining in adult mouse MI model hearts at 21 days post-MI (4239 CMs from 6 mice in cTnT-NC and 3504 CMs from 6 mice in cTnT-LDHA groups). (E) WGA staining of left ventricle heart sections from adult MI model hearts at 21 days post-MI (219 CMs from 15 images of 5 mice in cTnT-NC and 212 CMs from 15 images of 5 mice in cTnT-LDHA groups). (F) Masson straining of heart sections in adult mice at 49 days post-MI. n = 8 mice. (I) Cardiac function was analyzed using echocardiography at pre-MI and 7, 21 and 49 days post-MI. n = 10 mice. Bars = 20 μm in B-E and 1 mm in F. Statistical significance was calculated using an unpaired t-test in B-D, nonparametric Mann-Whitney U test in E, one-way ANOVA in F and two-way ANOVA in H; *P < 0.05.
Fig. 5
Fig. 5
LDHA overexpression induced metabolic reprogramming in CMs. (A) Schematic diagram of glycolysis and the TCA cycle. (B) Heatmap showing 30 metabolites concentration in P7 CMs after LDHA overexpression. The metabolites marked in red are significantly changed. (CD) The levels of β-F6P, DHAP, pyruvate, lactate, suc-CoA and succinate detected in P7 CMs after LDHA overexpression. n = 6 cell samples. (E) Volcano plot displaying the differentially expressed proteins in P7 CMs after LDHA overexpression. (FG) GO and KEGG pathway enrichment analyzed the differentially expressed proteins after LDHA overexpression. (H) GSEA was performed to analyze clusters of genes that regulate the cell cycle. (I–K) Heatmap showing the differentially expressed proteins related to the cell cycle, glucose metabolic process and oxidative phosphorylation. Statistical significance was calculated using an unpaired t-test in C-D; *P < 0.05. FC indicated fold change. (For interpretation of the references to colour in this figure legend, the reader is referred to the Web version of this article.)
Fig. 6
Fig. 6
LDHA regulated ROS levels and oxidative stress in CMs. (A) ROS staining in P7 CMs after LDHA overexpression. 18 images of 6 mice per group. (B) p-ATM staining in P7 CMs after LDHA overexpression (173 CMs from 18 images of 6 mice in Adv-NC and 178 CMs from 18 images of 6 mice in Adv-LDHA groups). (C) ROS staining in adult hearts after LDHA overexpression. 18 images of 6 mice per group. (D) 8-OHG staining in adult hearts (137 CMs from 18 images of 6 mice in cTnT-NC and 164 CMs from 18 images of 6 mice in cTnT-LDHA groups). (E) ROS staining in adult MI hearts at 21 days after LDHA overexpression. 12 images of 6 mice per group. (F) 8-OHG staining in adult MI hearts at 21 days after LDHA overexpression (212 CMs from 18 images of 6 mice in cTnT-NC and 204 CMs from 18 images of 6 mice in cTnT-LDHA groups). (G) ROS staining in neonatal AR models after LDHA and MitoQ interference. 15 images of 5 mice per group. (H) pH3 staining in neonatal AR models after LDHA interference and MitoQ treatment (886 CMs from 15 images of 5 mice in Cre-empty + PBS, 1272 CMs from 15 images of 5 mice in Cre-empty + MitoQ, 1526 CMs from 15 images of 5 mice in Cre-LDHA + PBS and 1294 CMs from 15 images of 5 mice in Cre-LDHA + MitoQ groups). Bars = 20 μm in A, C, E and G-H, 2 μm (upper) and 20 μm (lower) in B, and 20 μm (left) and 5 μm (right) in D and F. Statistical significance was calculated using an unpaired t-test in A-F and one-way ANOVA in G-H; *P < 0.05.
Fig. 7
Fig. 7
Txnrd1 was the downstream protein of LDHA that reduced ROS and promoted CM proliferation. (A) Heatmap showing the differentially expressed proteins related to ROS metabolic process. (B) G6pdx, Txnrd1, Mfn2, Coq7, Ndufs4, Ndufs3 and Hbb-b2 protein levels in P7 CMs after LDHA overexpression. n = 4 cell samples. (C) G6pdx, Txnrd1, Coq7, Ndufs4 and Hbb-b2 protein levels in mouse hearts at different ages. n = 4 mice. (D) ROS staining in P7 CMs after Txnrd1 overexpression. 10 images of 5 mice per group. (E) 8-OHG staining in P7 CMs after Txnrd1 overexpression (108 CMs from 10 images of 5 mice in Adv-NC and 111 CMs from 10 images of 5 mice in Adv-Txnrd1 groups). (F) Aurora B staining in P7 CMs after Txnrd1 overexpression (2247 CMs from 5 mice in Adv-NC and 1927 CMs from 5 mice in Adv-Txnrd1 groups). (G) ROS staining in adult hearts after Txnrd1 overexpression. 8 images of 4 mice per group. (H) 8-OHG staining in adult hearts after Txnrd1 overexpression (78 CMs from 8 images of 4 mice in Adv-NC and 79 CMs from 8 images of 4 mice in Adv-Txnrd1 groups). (I) Ki67 staining in adult hearts after Txnrd1 overexpression (649 CMs from 8 images of 4 mice in Adv-NC and 727 CMs from 8 images of 4 mice in Adv-Txnrd1 groups). Bars = 50 μm (left) and 10 μm (right) in D, 50 μm (left) and 5 μm (right) in E, and 20 μm in F–I. Statistical significance was calculated using an unpaired t-test in B, D-I and one-way ANOVA in C; *P < 0.05.
Fig. 8
Fig. 8
LDHA increased Txnrd1 protein levels by inhibiting the succinylation-dependent ubiquitination of Txnrd1. (A) Txnrd1 mRNA levels in P7 CMs after LDHA overexpression. n = 5 cell samples. (B) Txnrd1 protein levels in P7 CMs at different time points after LDHA overexpression. CHX was used to block protein synthesis. n = 3 cell samples. (C) P7 CM cell lysates were immunoprecipitated with an antibody against Txnrd1 and analyzed by immunoblotting with a ubiquitin (Ub)-specific antibody or an anti-Txnrd1 antibody. Bottom, input from cell lysates. (DG) The levels of lactate, acetyl-CoA, ATP and suc-CoA in P7 CMs after LDHA overexpression. n = 6 cell samples. (H) P7 CMs were treated with the indicated concentrations of suc-CoA, and cell lysates were then immunoprecipitated with an antibody against Txnrd1, followed by immunoblotting with an anti-pansuccinylated lysine antibody (suc-K). (I) P7 CM cell lysates were immunoprecipitated with an antibody against Txnrd1 and analyzed by immunoblotting with an anti-suc-K antibody after LDHA interference and Suc-CoA treatment. Bottom, input from cell lysates. (J) HA-tagged mouse Txnrd1 and its mutant variants were individually transduced into CMs for Txnrd1 succinylation assays. (K) Sequence alignment of the region surrounding the K534 residue of Txnrd1. (L) P7 CM cell lysates were immunoprecipitated with an anti-HA antibody and analyzed by immunoblotting with an anti-suc-K antibody or anti-Ub antibody after transduced with Txnrd1 WT or K534R mutant vectors and Suc-CoA supplementation. Bottom, input from cell lysates. (M) Exogenous Txnrd1 protein levels in P7 CMs at different time points after transduced with Txnrd1 WT or K534R mutant vectors. n = 3 cell samples. Statistical significance was calculated using an unpaired t-test in A, D-G and two-way ANOVA in B and M; *P < 0.05.
Fig. 9
Fig. 9
LDHA-driven lactate production induced M2 macrophage polarization. (A) Arg1, CD206, CD38, MMP9 and iNOS protein levels in adult MI model after LDHA overexpression. n = 6 mice. (B) Flow cytometry analysis of macrophage polarization in adult MI model after LDHA overexpression. n = 5 mice. (C) Flow cytometry analysis of macrophage polarization in neonatal AR models after LDHA and sodium lactate interference. n = 5 mice. (D) Ki67 staining in neonatal AR models after LDHA interference and sodium lactate treatment (568 CMs from 15 images of 5 mice in Cre-empty + PBS, 590 CMs from 15 images of 5 mice in Cre-empty + Sodium lactate, 609 CMs from 15 images of 5 mice in Cre-LDHA + PBS and 592 CMs from 15 images of 5 mice in Cre-LDHA + Sodium lactate groups), bar = 20 μm (upper) and 10 μm (lower). Statistical significance was calculated using an unpaired t-test in A, two-way ANOVA in B and one-way ANOVA in C-D; *P < 0.05.

References

    1. Yuan X., Braun T. Multimodal regulation of cardiac myocyte proliferation. Circ. Res. 2017;121(3):293–309. - PubMed
    1. Ahmed M.S., Sadek H.A. Hypoxia induces cardiomyocyte proliferation in humans. JACC Basic Translat. Sci. 2020;5(5):461–462. - PMC - PubMed
    1. Cardoso A.C., Lam N.T., Savla J.J., et al. Mitochondrial substrate utilization regulates cardiomyocyte cell cycle progression. Nature metabolism. 2020;2(2):167–178. - PMC - PubMed
    1. Puente B.N., Kimura W., Muralidhar S.A., et al. The oxygen-rich postnatal environment induces cardiomyocyte cell-cycle arrest through DNA damage response. Cell. 2014;157(3):565–579. - PMC - PubMed
    1. Fajardo V.M., Feng I., Chen B.Y., et al. GLUT1 overexpression enhances glucose metabolism and promotes neonatal heart regeneration. Sci. Rep. 2021;11(1):8669. - PMC - PubMed