. 2022 Sep 3;13(1):5195.
doi: 10.1038/s41467-022-32929-2.

The genus Serratia revisited by genomics

Affiliations

The genus Serratia revisited by genomics

David J Williams et al. Nat Commun. .

Abstract

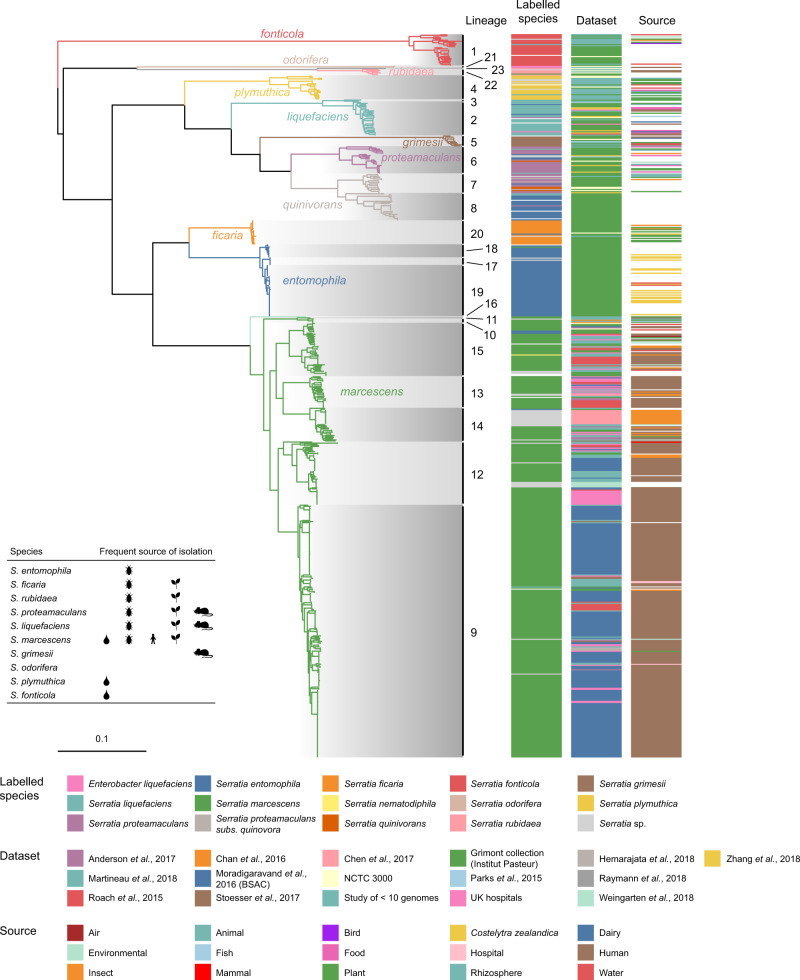
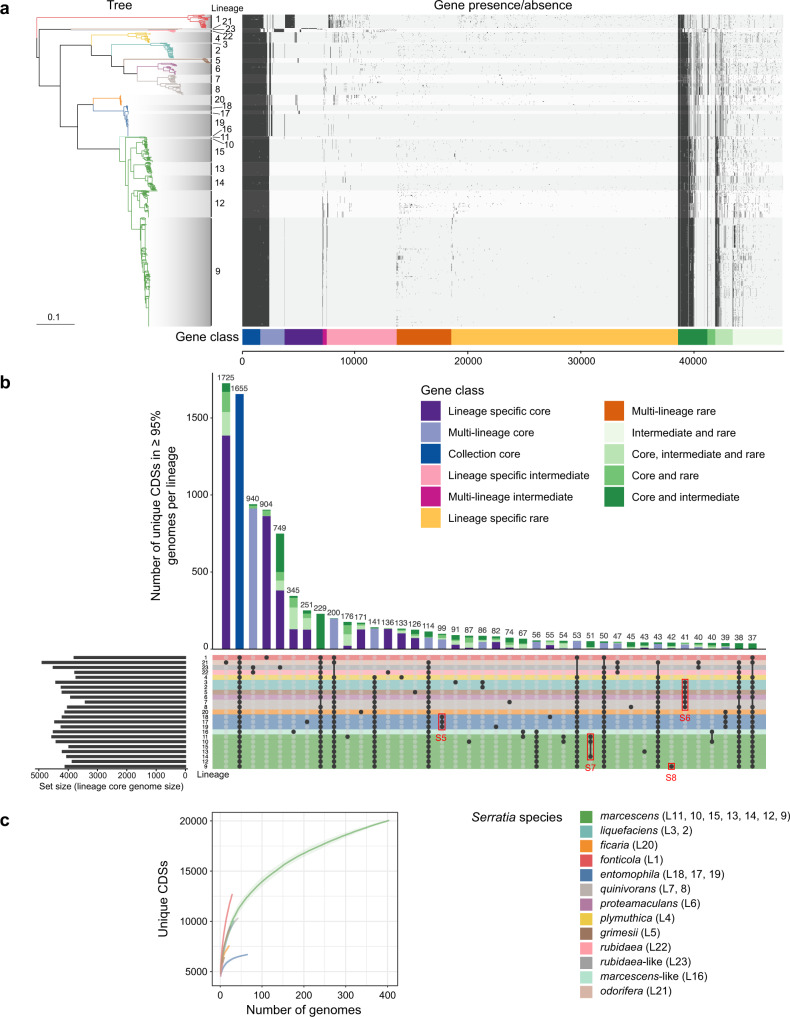
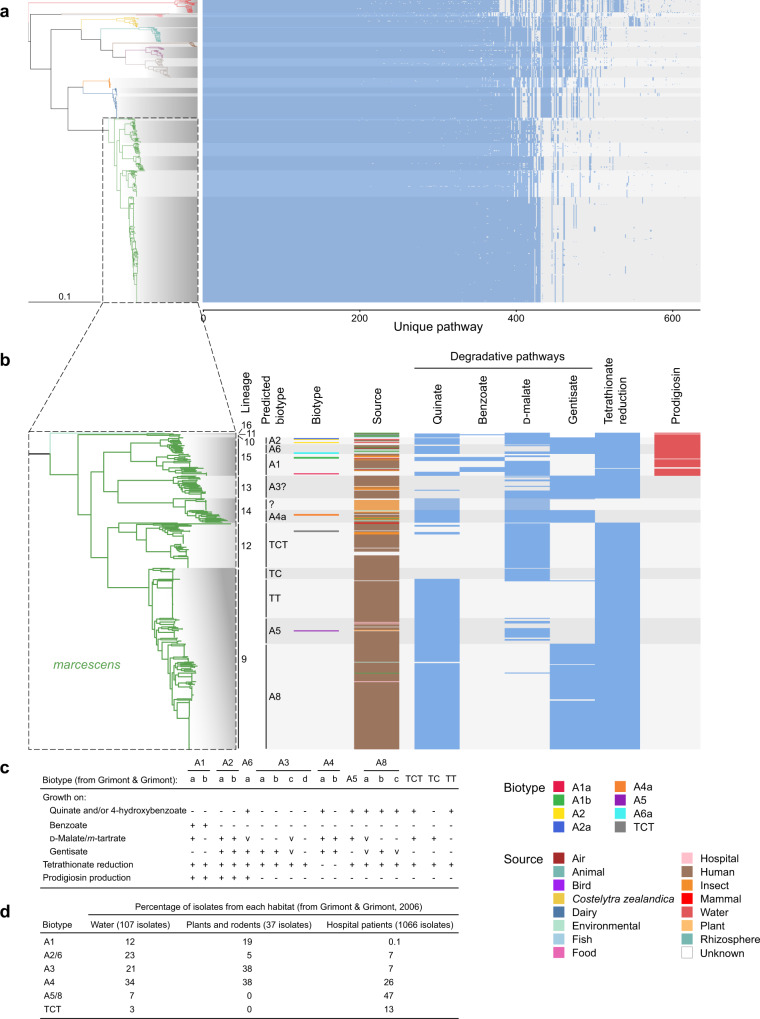
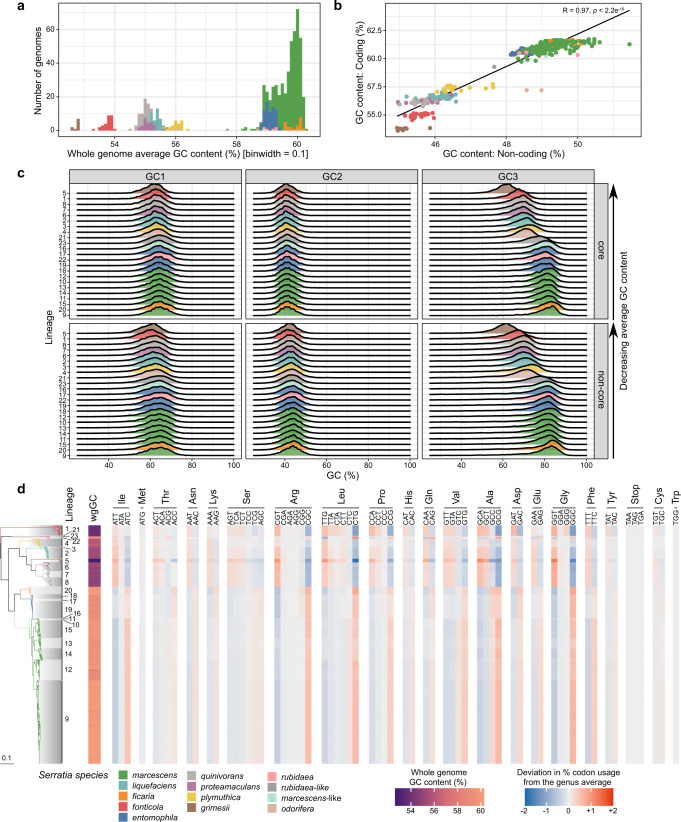
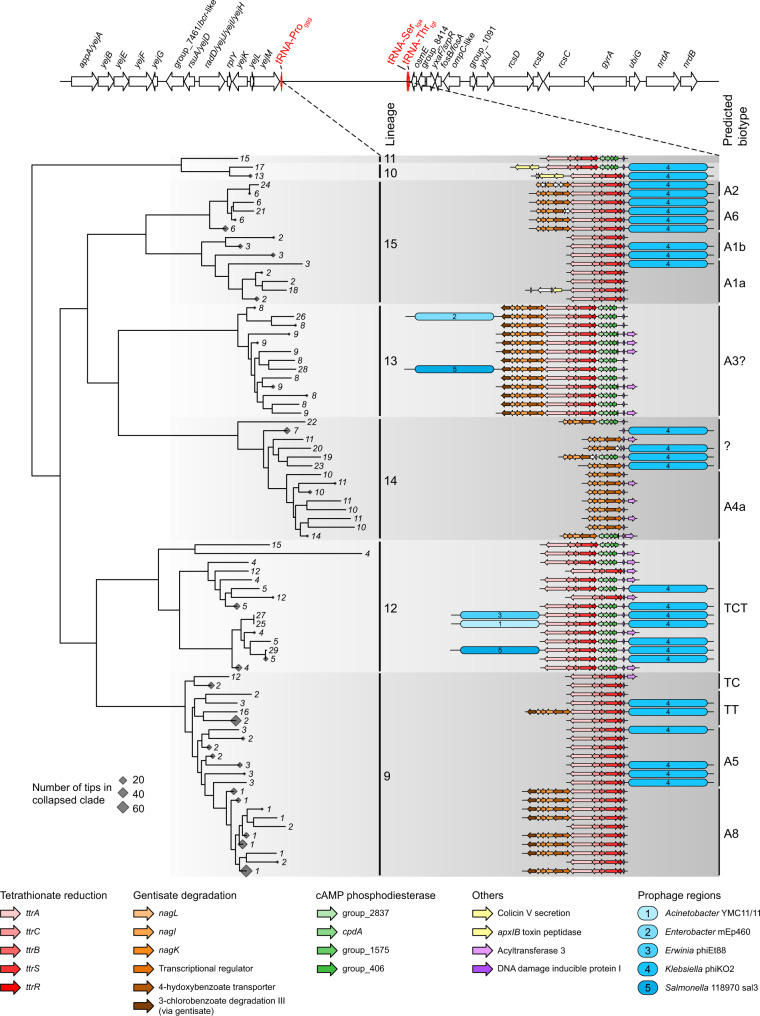
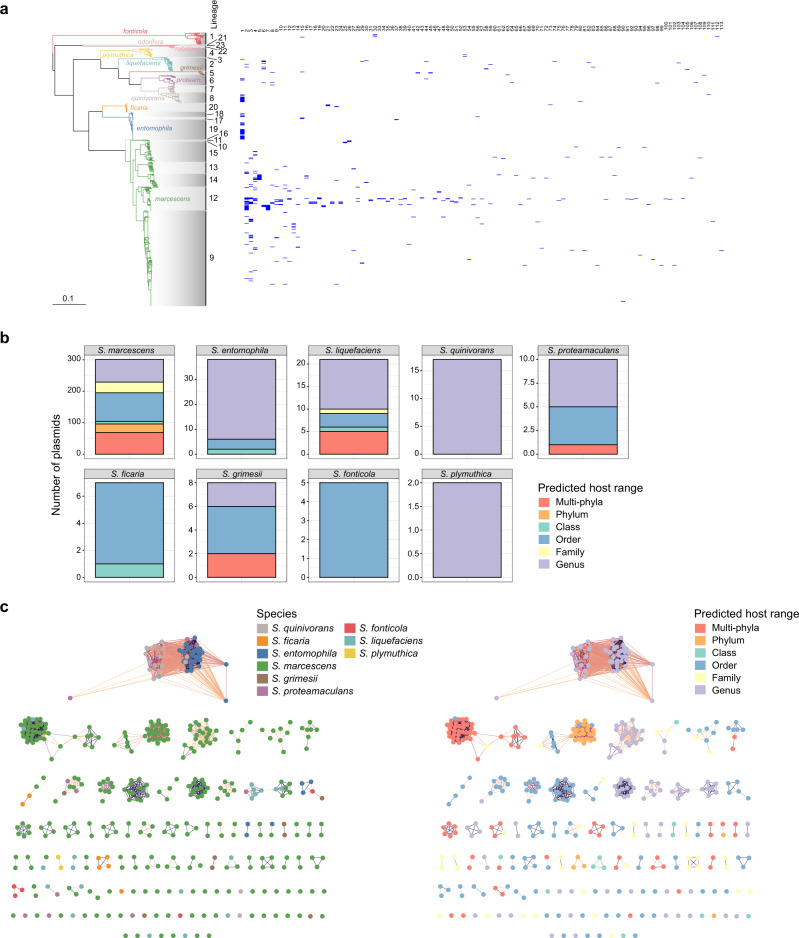
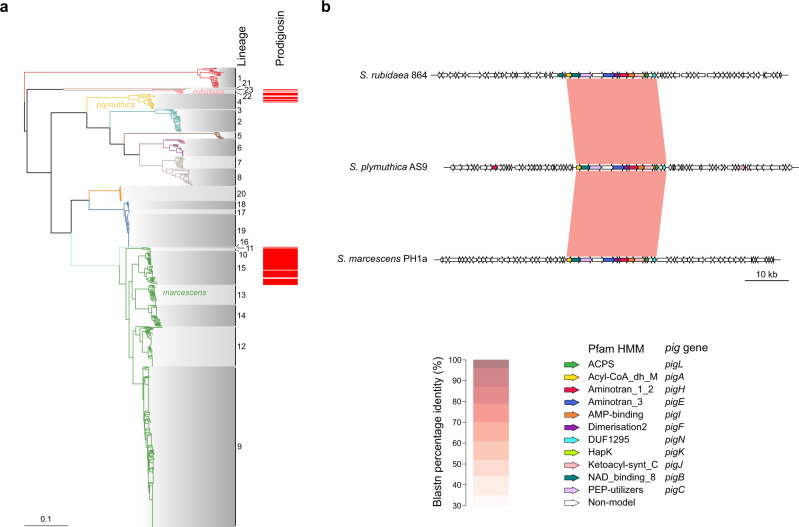
The genus Serratia has been studied for over a century and includes clinically-important and diverse environmental members. Despite this, there is a paucity of genomic information across the genus and a robust whole genome-based phylogenetic framework is lacking. Here, we have assembled and analysed a representative set of 664 genomes from across the genus, including 215 historic isolates originally used in defining the genus. Phylogenomic analysis of the genus reveals a clearly-defined population structure which displays deep divisions and aligns with ecological niche, as well as striking congruence between historical biochemical phenotyping data and contemporary genomics data. We highlight the genomic, phenotypic and plasmid diversity of Serratia, and provide evidence of different patterns of gene flow across the genus. Our work provides a framework for understanding the emergence of clinical and other lineages of Serratia.


Conflict of interest statement

The authors declare no competing interests.

Figures

Fig. 1
Fig. 1. Phylogeny of the genus Serratia.
Maximum-likelihood phylogenetic tree constructed from polymorphic sites of a core-gene alignment comprised of 2252 genes from 664 Serratia genomes, comprising 408 genomes from publicly available databases and 256 sequenced in this study. Tree constructed with 1000 ultrafast bootstraps. The core-gene alignment was produced from a Panaroo pan-genome analysis run with ‘–clean_mode moderate’ and the protein family threshold set to 70% shared sequence identity. Branches are coloured according to phylogroups defined by clustering assemblies at 95% ANI. Clades are shaded according to lineage, calculated through hierarchical bayesian clustering to three levels using FastBaps. ‘Labelled species’ refers to the labelled name of species on the provided Serratia strain sample, or species name associated with published Serratia genome sequences in the NCBI GenBank database. The inset illustrates the frequent sources of isolation of each species, with symbols representing water, insects, human, plants and small mammals. The phylogenetic tree is reproduced in Supplementary Fig. 1 with the addition of the outgroup root, the country of isolation for each strain, and bootstrap values.
Fig. 2
Fig. 2. The pan-genome of Serratia.
a Presence/absence matrix of the 47,743 genes in the Serratia pan-genome, generated using Panaroo and overlaid with shading according to lineage, alongside the maximum-likelihood tree in Fig. 1. The presence/absence matrix is ordered by gene class as defined by Twilight. Gene class is first defined within each lineage by calculating whether genes are core (in ≥95% of strains in each lineage), intermediate (in >15% and ≤95% of strains), or rare (in ≤15% of strains). Classification of each gene group per lineage is then compared between lineages. Gene groups core to all lineages are collection core, gene groups core to only certain lineages are multi-lineage core, and genes core to only a single lineage are lineage-specific core. Individual genes found at intermediate or rare occurrence in all, multiple, or single lineages are classified similarly, as intermediate or rare genes. These three classes are indicated by colour: core, blue shades; intermediate, pink shades; and rare, orange shades. Genes which are in one classification (core, intermediate, rare) in a particular lineage but in another classification in a separate lineage are termed hybrid classes (green shades). b UpSetR plot showing the 40 largest intersections of lineage-specific core genomes (genes present in ≥95% of strains in each lineage). Lineages with membership to each intersection are shown by the presence of a black dot in the presence/absence matrix underneath the stacked bar plot. Stacked bar plots representing the number of genes in each intersection are coloured according to the gene classes assigned by Twilight, where singleton lineages (here L22 and L23) have been included. Rows in the presence/absence matrix correspond to each lineage and are coloured according to Serratia species defined by fastANI. Red boxes indicate intersections of genes represented in Supplementary Figs. 5–8. c Estimated pan-genome accumulation curves for each Serratia phylogroup. Shaded region represents standard deviation. Throughout, species are coloured according to the key in c. Source data are provided as a Source Data file.
Fig. 3
Fig. 3. Predicted metabolic pathways in Serratia and correspondence with historical biotyping.
a Predicted metabolic pathways across Serratia, predicted using Pathway Tools following re-annotation of assemblies using Interproscan/EggNOG-based functional annotation of representative sequences of protein groups defined by Panaroo. Shown alongside the maximum-likelihood tree in Fig. 1. b Presence/absence of selected complete metabolic pathways across Serratia marcescens. Presence of degradative pathways and that of tetrathionate reduction are coloured in blue, whilst presence of the pig gene cluster containing genes required for the biosynthesis of prodigiosin is coloured in red to reflect the red colour of this pigmented molecule. Pathways were selected according to a subset of the biochemical tests originally used to group Serratia isolates into Biotypes c (v, variable). d Habitat source for different S. marcescens biotypes. Tables in c and d are adapted from Grimont and Grimont (ref. 21).
Fig. 4
Fig. 4. Serratia is split by GC content.
a Histogram of GC content (average over whole genome) across Serratia. b Plot of GC content of coding regions against that of intergenic (non-coding) regions for each genome; a Pearson correlation test (two-sided) was performed, giving correlation coefficient R 0.97 and p value < 2.2e−16 (n = 664). c Distribution of GC content in codon positions 1, 2, and 3 in all genus-core (core) and non-genus-core (non-core) genes across each lineage. Data is normalised according to gene length. Ridgeplots are coloured according to Serratia species/phylogroup. Lineages are ordered from top to bottom according to average GC content across the whole genome. d Codon usage (CU) within the genus-core genome. Blue to red colour represents deviation from the average CU across the entire genus for each codon, with this genus-average CU calculated from a per-lineage mean CU value to account for the different numbers of sequences in each lineage. The whole genome GC (wgGC) content is also shown in the left-most column. Source data are provided as a Source Data file.
Fig. 5
Fig. 5. A tRNA-associated hypervariable region (‘plasticity zone’) encodes gene cassettes for metabolic pathways used for biotyping within S. marcescens.
The gene arrangement between the conserved tRNA-Proggg and tRNA-Sertga in S. marcescens is plotted against a maximum-likelihood sub-phylogeny from the tree in Fig. 1. Clades for which all descending tips represent strains that have an identical set of genes in the locus depicted are collapsed and denoted by a diamond shape within the tree. The size of the diamond represents the number of tips in each collapsed clade. Tips lacking a completely assembled gene locus between tRNA-Proggg and tRNA-Sertga have been pruned from the tree. Each tip number represents a unique combination of genes in the locus. Genes are coloured according to their role, or in the absence of any predicted function, named according to the group number assigned by Panaroo in the pan-genome (Fig. 2). Prophage regions and the closest related prophage sequence determined by PHASTER are indicated.
Fig. 6
Fig. 6. Predicted plasmids across Serratia.
a Distribution of the 131 plasmid clusters identified against the maximum-likelihood phylogeny of Serratia shown in Fig. 1. b Number and predicted host range of plasmids identified in Serratia genomes. c Diversity of Serratia plasmids according to species (left) and predicted host range (right). Within each panel, the order of clusters (from left-right in descending rows) is the same order as presented in the heatmap in panel a (left-right). Source data are provided as a Source Data file.
Fig. 7
Fig. 7. The prodigiosin gene cluster is present variably across Serratia and in different genomic loci.
a Prodigiosin (pig) gene clusters identified using Hamburger are plotted against the maximum-likelihood phylogeny of Serratia shown in Fig. 1. b Pairwise blastn comparison of pig loci (core pig cluster +/−20 kb) from representative members of the three species containing pig genes, extracted using Hamburger.

References

    1. Merlino, C. P. Bartolomeo Bizio’s letter to the most eminent priest, Angelo Bellani, concerning the phenomenon of the red-colored polenta [translated from the Italian]. J. Bacteriol.9, 527–543 (1924). - PMC - PubMed
    1. Grimont PAD, Dulong de Rosnay HLC. Numerical study of 60 strains of Serratia. J. Gen. Microbiol. 1972;72:259–268. doi: 10.1099/00221287-72-2-259. - DOI - PubMed
    1. Grimont PAD, Grimont F, Dulong de Rosnay HLC. Taxonomy of the genus Serratia. J. Gen. Microbiol. 1977;98:39–66. doi: 10.1099/00221287-98-1-39. - DOI - PubMed
    1. Grimont F, Grimont PAD, Dulong de Rosnay HLC. Characterization of Serratia marcescens, S. liquefaciens, S. plymuthica and S. marinorubra by electrophoresis of their proteinases. J. Gen. Microbiol. 1977;99:301–310. doi: 10.1099/00221287-99-2-301. - DOI
    1. Grimont PAD, et al. Deoxyribonucleic acid relatedness between Serratia plymuthica and other Serratia species, with a description of Serratia odorifera sp. nov. (Type strain: ICPB 3995) Int. J. System. Bacteriol. 1978;28:453–463. doi: 10.1099/00207713-28-4-453. - DOI

Publication types