. 2022 Sep 3;13(1):5187.
doi: 10.1038/s41467-022-32970-1.

Taz protects hematopoietic stem cells from an aging-dependent decrease in PU.1 activity

Affiliations

Taz protects hematopoietic stem cells from an aging-dependent decrease in PU.1 activity

Kyung Mok Kim et al. Nat Commun. .

Abstract

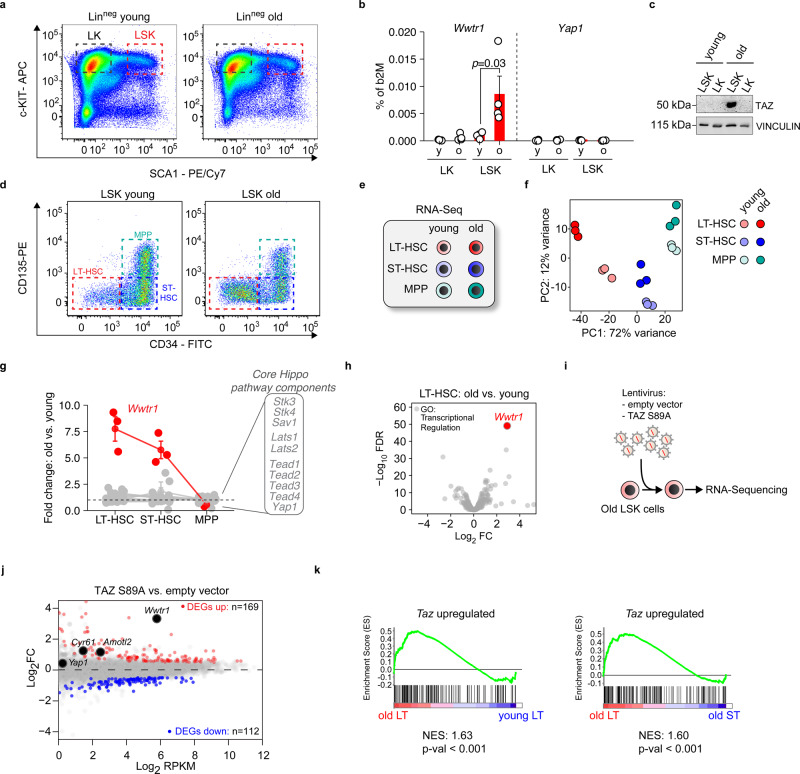
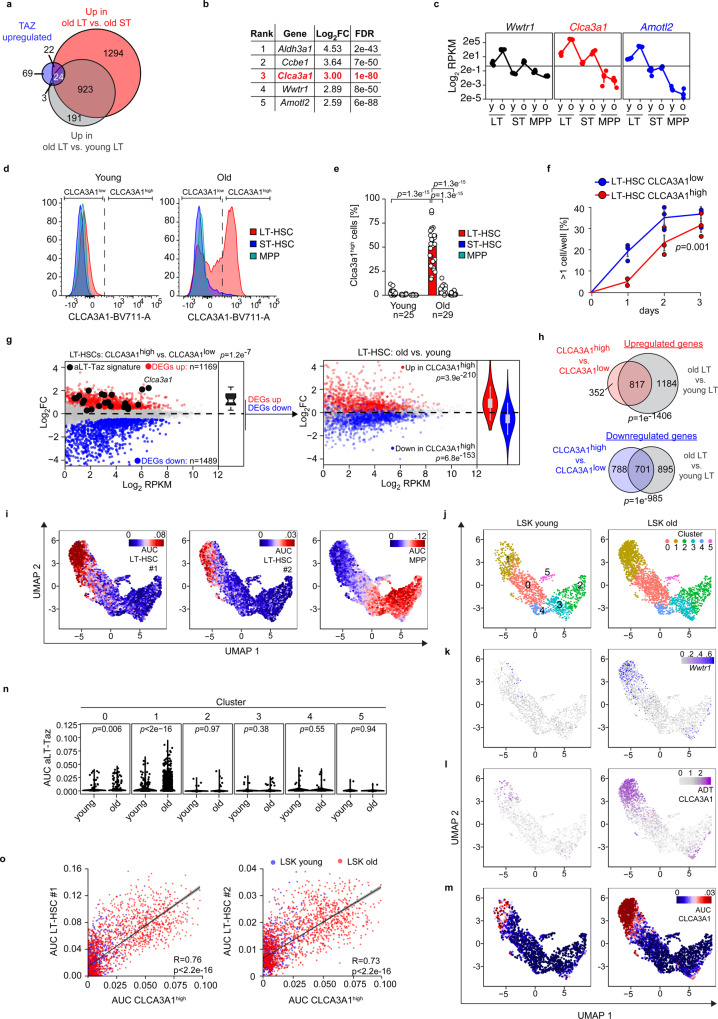
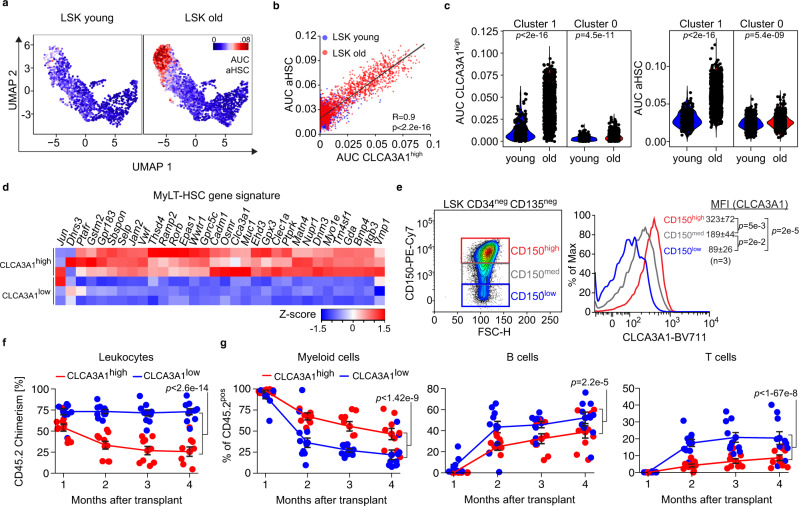
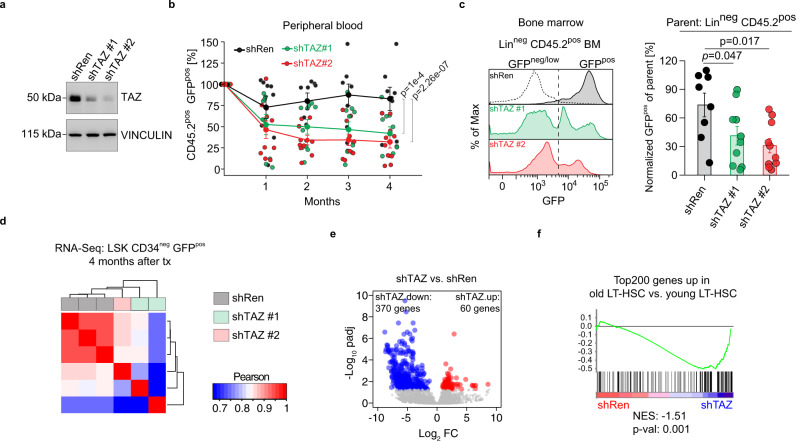
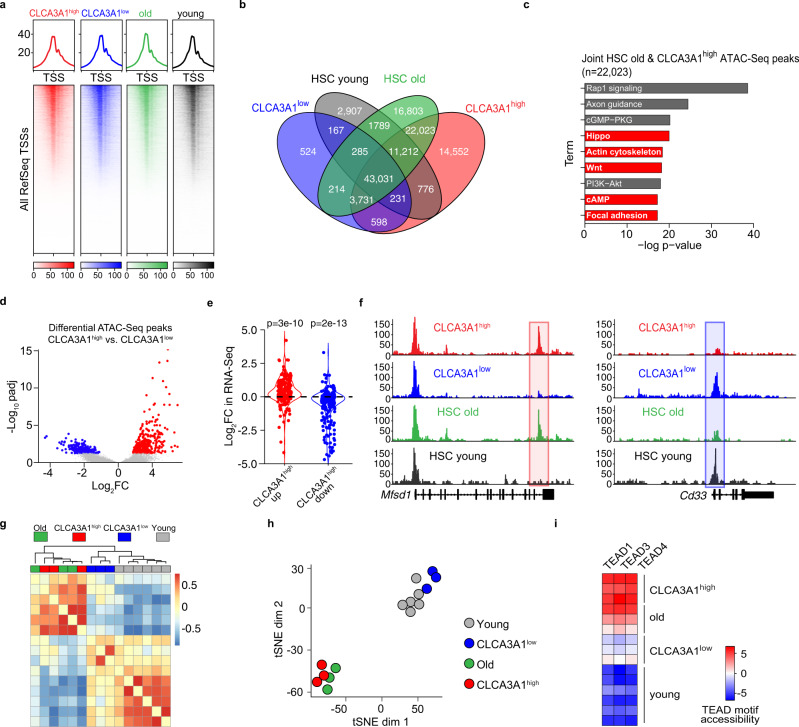
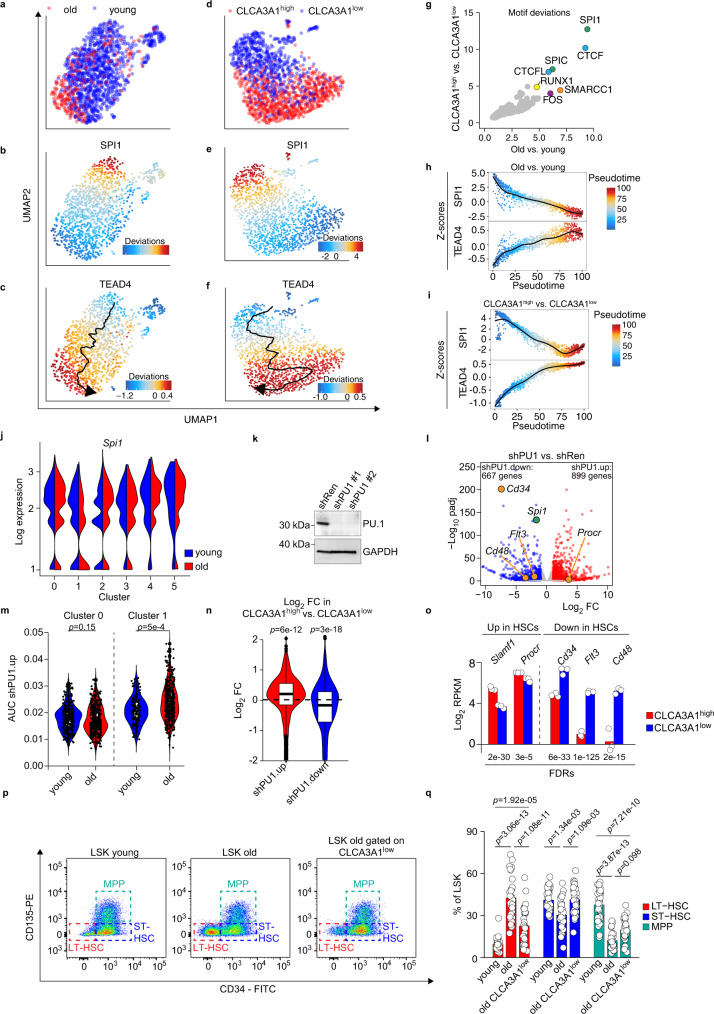
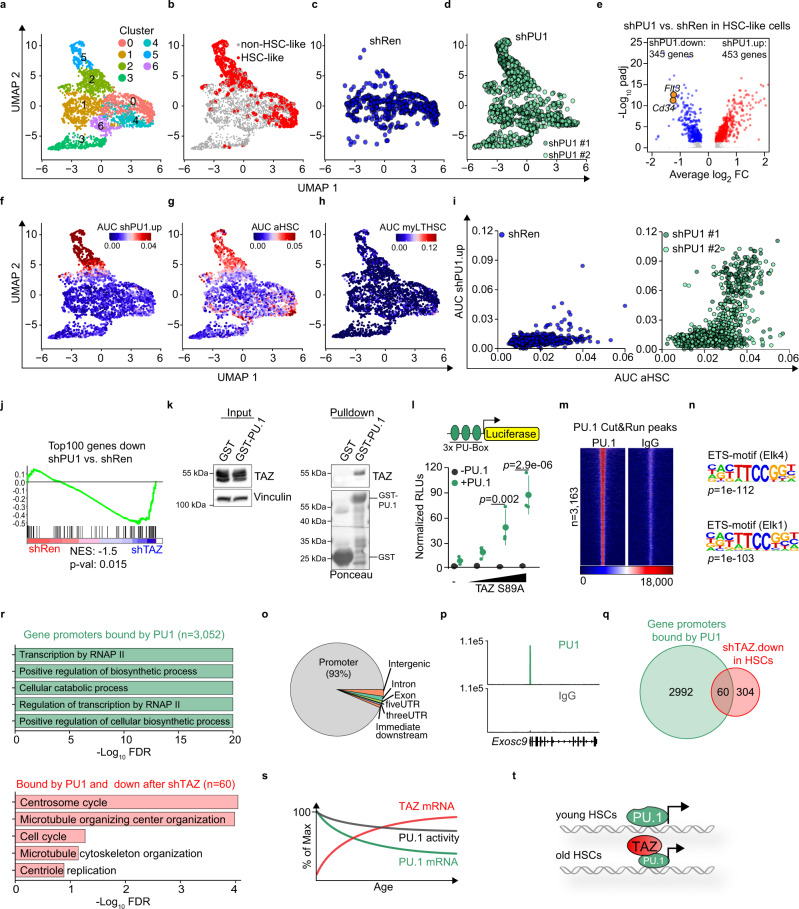
Specific functions of the immune system are essential to protect us from infections caused by pathogens such as viruses and bacteria. However, as we age, the immune system shows a functional decline that can be attributed in large part to age-associated defects in hematopoietic stem cells (HSCs)-the cells at the apex of the immune cell hierarchy. Here, we find that the Hippo pathway coactivator TAZ is potently induced in old HSCs and protects these cells from functional decline. We identify Clca3a1 as a TAZ-induced gene that allows us to trace TAZ activity in vivo. Using CLCA3A1 as a marker, we can isolate "young-like" HSCs from old mice. Mechanistically, Taz acts as coactivator of PU.1 and to some extent counteracts the gradual loss of PU.1 expression during HSC aging. Our work thus uncovers an essential role for Taz in a previously undescribed fail-safe mechanism in aging HSCs.


Conflict of interest statement

The authors declare no competing interests.

Figures

Fig. 1
Fig. 1. TAZ (Wwtr1) is strongly induced in oLT-HSCs.
a Representative flow cytometry plots of LK (Lineageneg, Sca-1neg, c-Kitpos) and LSK (Lineageneg, Sca-1pos, c-Kitpos) cells of young and old mice. b qRT-PCRs of Wwtr1 and Yap1 expression in LK and LSK isolated from young and old mice (n = 4 per age group, one-way ANOVA with Tukey HSD post hoc test). c Immunoblot analysis of TAZ in LK and LSK of young and old mice. d Representative flow cytometry plots of LT-HSCs, ST-HSCs, and MPP in the LSK compartment of young and old mice. e Overview of the samples that were analyzed by RNA-Seq (n = 3 per group). f Principal component analysis of the RNA-Seq of the indicated populations (n = 3 per group). g Summary of gene expression changes (old vs. young) of Hippo pathway core components. h Volcano plot encompassing all transcriptional regulators (KEGG database) that were analyzed in the LT-HSC dataset old vs. young. FDR = false discovery rate; FC = fold change. I Experimental strategy to identify TAZ-induced genes in oLSK. j MA plot of the TAZ S89A overexpression RNA-Seq (n = 3 per condition). Significantly up- and downregulated genes (FDR < 0.01) are colored in red and blue, respectively. DEG = differentially expressed genes. k Gene set enrichment analysis for the given comparisons applying a TAZ-induced set of 169 genes. NES = normalized enrichment score. Data in b, g are presented as mean values +/− SEM. Source data are provided as a Source data file.
Fig. 2
Fig. 2. Clca3a1 is induced by TAZ and marks oLT-HSCs.
a Overlap among upregulated genes of the indicated RNA-Seq datasets (Log2FC > 0.5, FDR < 0.01). b Top TAZ-induced LT-HSC-specific genes sorted according to their regulation in old vs. young LT-HSCs. c RPKM values (Log2 scale) of Wwtr1, the TAZ target gene Amotl2 and Clca3a1 determined by RNA-Seq (n = 3 per age group and population). d Representative flow cytometry plots for CLCA31 expression in the given populations from young and old mice. e Quantification of samples analyzed in d (n = 25 for young, n = 29 for old mice). f Single cell colony-forming assay of isolated CLCA3A1low and CLCA3A1high LT-HSCs. Single cells were seeded and the time to completion of the first cell division was measured (n = 3 per group, one-way ANOVA with Tukey HSD post hoc test). g Left panel: MA plot of an RNA-Seq comparing CLCA3A1high vs. CLCA3A1low LT-HSCs (n = 3 per group, LSK CD34neg CD135neg). Significantly up- and downregulated genes (FDR < 0.01) are colored in red and blue, respectively. Right panel: Significantly regulated genes of the CLCA3A1high vs. CLCA3A1low RNA-Seq were colored in the RNA-Seq comparing old vs. young LT-HSCs. Boxplot: bottom/top of box: 25th/75th percentile; upper whisker: min(max(x), Q_3 + 1.5 * IQR), lower whisker: max(min(x), Q_1−1.5 * IQR), center: median. h Venn diagram of significantly regulated genes in the given RNA-Seq datasets. The p-values for a significant overlap were determined by a hypergeometric test. i UMAP dimensionality reduction plots for CITE-Seq data of young and old LSKs. The activity of the indicated gene sets (LT-HSC#1, LT-HSC#2, and MPP) is color-coded based on their AUC. AUC = area under the curve. jm UMAP plots for CITE-Seq data of young (left) and old (right) LSKs, respectively. Graph-based clusters (j), Wwtr1 mRNA expression (k), CLCA3A1 protein based on ADTs (l), and CLCA3A1high gene set activity based on AUCs (m) are depicted. n Violin plots of TAZ gene set activity (AUC scores) in the different clusters of young and old LSKs, respectively. Cluster 1 contains HSC-like cells, see also (i) (two-sided Wilcox test). o Scatter plots of CLCA3A1high gene set activity plotted against the activity of two different LT-HSC gene sets #1 and #2, respectively (R = Pearson correlation coefficient, linear regression t-test). Data in c, f are presented as mean values +/− SEM. Source data are provided as a Source data file.
Fig. 3
Fig. 3. CLCA3A1high HSCs demonstrate features of aged HSCs.
a UMAP plots for CITE-Seq data of young and old LSKs. The activity of the aged HSC (aHSC) signature is colored based on the gene set activity. b Scatter plots of CLCA3A1high gene set activity plotted against the activity of an HSC aging signature from the CITE-Seq dataset (R = Pearson correlation coefficient, linear regression t-test). c Violin plots of CLCA3A1high (left) and aHSC (right) gene set activity in clusters 0 and 1 from the CITE-Seq (two-sided Wilcox test). d Heatmap of Z-score normalized expression values for a gene set for myeloid-biased LT-HSCs (MyLT-HSCs) (n = 3 per group). e Representative flow cytometry plots for CD150 and CLCA3A1 of oHSCs. The CD150 signal was divided into three different windows (left) and the CLCA3A1 signal was plotted for each window (right). The numbers give the mean fluorescence intensity (MFI) ± 95% confidence interval (one-way ANOVA with Tukey HSD post hoc test). f Leukocyte chimerism in the PB over time after competitive transplantation of CLCA3A1high or CLCA3A1low LT-HSCs (n = 10 for CLCA3A1low, n = 9 for CLCA3A1high, two independent transplantations, two-way ANOVA with Tukey HSD post hoc test). g Percentage of myeloid (CD11bpos), B (B220pos) and T cells (CD4pos or CD8pos) from the donor (CD45.2pos) after competitive transplantation of CLCA3A1high or CLCA3A1low LT-HSCs (n = 10 for CLCA3A1low, n = 9 for CLCA3A1high, two independent transplantations, two-way ANOVA with Tukey HSD post hoc test). Data in f, g are presented as mean values +/− SEM. Source data are provided as a Source data file.
Fig. 4
Fig. 4. CLCA3A1high HSCs depend on high TAZ expression.
a Immunoblot of NIH3T3 cells infected with the indicated shRNAs. An shRNA targeting Renilla (shRen) serves as control. The experiment was independently repeated three times. b PB analysis after transplantation of CLCA3A1high HSCs transduced with the indicated shRNAs. The GFPpos population in the donor CD45.2pos compartment was analyzed for 4 months post-transplantation (shRen: n = 8, shTAZ#1: n = 10, shTAZ#2: n = 10, three independent transplantations, two-way ANOVA with Tukey HSD post hoc test). c Representative GFP flow cytometry plots of Linneg CD45.2pos BM cells 4 months after transplantation (left). The dotted line indicates the negative control for GFP (gated on CD45.1/2pos supporting cells). Right panel: percentage of GFPpos cells in Linneg BM cells. The cells were gated on Linneg CD45.2pos donor cells (shRen: n = 8, shTAZ#1: n = 10, shTAZ#2: n = 10, three independent transplantations, one-way ANOVA with post hoc paired Wilcox test and Benjamini-Hochberg correction). d Correlation analysis of RNA-Seq data from LSK CD34neg cells. Old CLCA3A1high HSCs were transduced with the indicated constructs and transplanted. RNA-Seq was performed 4 months after transplantation. e Volcano plot of LSK CD34neg cells from (d). padj = adjusted p-value, FC = fold change. f GSEA analysis of shTAZ vs. shRen transduced HSCs using a gene set consisting of the Top200 upregulated genes in old vs. young LT-HSCs. Data in b, c are presented as mean values +/− SEM. Source data are provided as a Source data file.
Fig. 5
Fig. 5. CLCA3A1low HSCs resemble yHSCs on chromatin level.
a Heatmaps for FAST-ATAC data of CLCA3A1high, CLCA3A1low LT-HSCs, oHSCs and yHSCs (n = 3 for CLCA3A1low, CLCA3A1high and HSC old; n = 6 for HSC young). All transcriptional start sites (TSSs) were included and sorted according to the strongest signal. b Venn diagram of FAST-ATAC peaks. c Gene ontology analysis of FAST-ATAC peaks and their associated genes that are unique to oHSCs and CLCA3A1high. The top 10 pathways are depicted. d Volcano plot for differential FAST-ATAC peaks comparing Clca3a1high vs. Clca3a1low LT-HSCs. padj = adjusted p-value, FC = fold change. e Violin plots for the regulation in the RNA-seq dataset of genes that are associated with a differentially accessible FAST-ATAC peak (<25 kb distance from the TSS). Either peaks were used that are significantly more (CLCA3A1high up, red) or less (CLCA3A1high down, blue) accessible in CLCA3A1high vs. CLCA3A1low LT-HSCs (two-sided Wilcox test). f Representative genome tracks of the FAST-ATAC experiments of a CLCA3A1high up peak (red box) and a CLCA3A1high down peak (blue box). g Clustering of TF motif. accessibility for all motifs in the different samples (n = 3 per group). h tSNE plot of TF motif accessibility for all motifs in the different samples. i TEAD motif accessibility in all peaks of the given samples. Source data are provided as a Source data file.
Fig. 6
Fig. 6. Aging leads to decreased PU.1 activity in CLCA3A1high HSCs.
af UMAP plots for scATAC experiments from old vs. young HSCs (ac) and Clca3a1high vs. Clca3a1low HSCs (d, e). Motif accessibility of SPI1 and TEAD4 is color-coded. The pseudotime trajectory is included in c, f, respectively. g Scatter plot that shows the most variable motifs in the given comparisons. h, i Scatter plot showing the SPI1 and TEAD4 motif accessibility (as Z-score) of individual cells within the pseudotime trajectory for the indicated comparisons. j Expression of Spi1 in the different clusters of the CITE-Seq dataset. k Immunoblot for PU.1 in BM-HPC#5 after infection with the indicated shRNAs. Gapdh serves as loading control (experiment repeated once with similar results). The experiment was independently repeated three times. l Volcano plot for gene expression changes after PU.1 depletion (shPU1#1 and shPU1#2) in BM-HPC#5 cells. DEGs (padj < 0.05, log2FC > 1 or log2FC < (−1), respectively) are colored in blue and red. padj = adjusted p-value. m Violin plots for the shPU1.up gene set activity in the indicated clusters from the scRNA-Seq dataset of young and old LSK cells (two-sided Wilcox test). n Violin plots for the shPU1.up gene set (n = 899 genes) and the shPU1.down gene set (n = 667 genes) comparing the expression in CLCA3A1high vs. CLCA3A1low LT-HSCs (two-sided Wilcox test). o Log2 RPKM values of the indicated genes coding for HSC surface markers in CLCA3A1high and CLCA3A1low LT-HSCs, respectively. Data from RNA-Seq comparing CLCA3A1high vs. CLCA3A1low LT-HSCs (n = 3 per group, LSK CD34neg CD135neg). p Representative flow cytometry plots from young and old LSK cells, respectively. In the right panel (LSK old gated on CLCA3A1low), the oLSK cells were additionally gated on low CLCA3A1 staining intensity. q Barplots summarizing the analysis outlined in p (n = 33 for young, n = 30 for old mice, one-way ANOVA with Tukey HSD post hoc test). Boxplots in m, n: bottom/top of box: 25th/75th percentile; upper whisker: min(max(x), Q_3 + 1.5 * IQR), lower whisker: max(min(x), Q_1−1.5 * IQR), center: median. Source data are provided as a Source data file.
Fig. 7
Fig. 7. PU.1 depletion in yHSCs leads to “old-like” HSCs.
ad UMAP plots for CD45.2pos GFPpos LSK cells, isolated 2 months post-transplantation with yHSCs infected with shRen, shPU#1 or shPU#2 lentiviruses. Six clusters (0–6) were identified by graph-based clustering (a). HSC-like cells (red) were annotated based on AUC gene set activity for an LT-HSC-specific gene set (b) and the corresponding shRNAs are color-coded (c, d). e Volcano plot of differential gene expression in the HSC-like population comparing shRen vs. shPU1 LT-HSCs. fh UMAP plots showing the activity of indicated gene sets (color-coded based on the AUC values). i Scatter plots showing the aHSC and shPU1.up AUC values of shRen (left) or shPU#1/#2 cells (right) plotted against each other. j GSEA analysis of shPU1 vs. shRen transduced HSCs using a gene set consisting of the Top100 genes downregulated by shPU1 in BM-HPC#5 cells. k GST pulldowns with cell extracts from 293T cells incubated with either GST or GST-PU-1. Bound TAZ was detected by immunoblot. The experiment was independently repeated three times. l Luciferase assay with a reporter construct containing three PU-Boxes. Cells were transfected with increasing amounts of a TAZ S89A construct, either in the absence (−PU.1) or presence (+PU.1) of a PU.1 construct (n = 3 independent experiments, one-way ANOVA with Tukey HSD post hoc test). RLUs = relative light units. m Heatmap of PU.1 binding at all (n = 3163) PU.1 peaks in Cut&Run. IgG serves as negative control. n Homer motif analysis, of the most significantly enriched motifs in all PU.1 peaks. o Distribution of PU.1 peaks in the genome. p Exemplary browser track of PU.1 and IgG Cut&Run signals in the promoter region of Exosc9. q Venn diagram of gene promoters bound by PU.1 (green) and genes that are downregulated after shTAZ in HSCs (red). r Top5 gene ontology terms overrepresented in all PU.1 peaks (n = 3523, green) or TAZ-dependent regulated PU.1 peaks (n = 60, red). FDR = false discovery rate. s Schematic illustrating the changes in TAZ and PU.1 expression and their effect on PU.1 transcriptional activity. t Proposed model of how increased TAZ expression in oHSCs maintains PU.1 activity despite reduced PU.1 expression. Data in k, l are presented as mean values +/− SEM. Source data are provided as a Source data file.

References

    1. Pang WW, et al. Human bone marrow hematopoietic stem cells are increased in frequency and myeloid-biased with age. Proc. Natl Acad. Sci. USA. 2011;108:20012–20017. doi: 10.1073/pnas.1116110108. - DOI - PMC - PubMed
    1. Morrison SJ, Wandycz AM, Akashi K, Globerson A, Weissman IL. The aging of hematopoietic stem cells. Nat. Med. 1996;2:1011–1016. doi: 10.1038/nm0996-1011. - DOI - PubMed
    1. Rossi DJ, et al. Cell intrinsic alterations underlie hematopoietic stem cell aging. Proc. Natl Acad. Sci. USA. 2005;102:9194–9199. doi: 10.1073/pnas.0503280102. - DOI - PMC - PubMed
    1. Leins H, et al. Aged murine hematopoietic stem cells drive aging-associated immune remodeling. Blood. 2018;132:565–576. doi: 10.1182/blood-2018-02-831065. - DOI - PMC - PubMed
    1. Florian MC, et al. A canonical to non-canonical Wnt signalling switch in haematopoietic stem-cell ageing. Nature. 2013;503:392–396. doi: 10.1038/nature12631. - DOI - PMC - PubMed

Publication types