Understanding entrance-air-kerma as a quality-control metric for dual-energy x-ray absorptiometry
- PMID: 36057962
- PMCID: PMC9588270
- DOI: 10.1002/acm2.13779
Understanding entrance-air-kerma as a quality-control metric for dual-energy x-ray absorptiometry
Abstract
Purpose: The low exposures, unique x-ray beam geometry, and scanning design in dual-energy x-ray absorptiometry (DXA) make measurement and quality-control strategies different from traditional x-ray equipment. This study examines the dependence of measured entrance-air-kerma (EAK) on both dose sensor type and scan length. The feasibility of using EAK to compare scanner output between different scan modes, individual scanners, and scanner platforms was also established. Finally, the congruence between measured and vendor-reported EAK was analyzed.
Methods: Four Hologic DXA scanners at two institutions and all four available scan modes were tested. EAK was measured directly by three types of Radcal dose sensors: 60-cc pancake ion-chamber (IC), 180-cc pancake IC, and solid-state detector. The coefficient of variation (COV) was used to assess the dependence of EAK on scan length. Variations in EAK between the types of dose sensors as well as measured versus vendor-reported values were evaluated using Bland-Altman analysis: mean ±95% prediction interval (PI): 1.96σ.
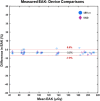
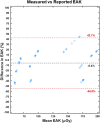
Results: Dose sensor variations in EAK were minimal, with a -3.5 ± 3.5% (mean ±95% PI) percent difference between the two sizes of IC's. The solid-state detector produced highly similar measurements to the 180-cc IC. These small differences were consistent across all scanners and all scan modes tested. Neither measured nor vendor-reported EAK values were found to show relevant dependence on scan length, with all COV values ≤4%. Differences between measured and reported EAK were higher at -6 ± 48%. Likely errors in vendor-reported EAK calculations were also identified.
Conclusion: It is feasible to quantify DXA scanner stability using EAK as a quality-control metric with a variety of solid-state and IC dose sensors, and the scan length used is not critical. Although vendor-reported EAK was consistent among scanners of the same platform, measured EAK varied significantly from scanner to scanner. As a result, measured and reported EAK may not always be comparable.
Keywords: bone mineral density; dual-energy x-ray absorptiometry; entrance-air-kerma; x-ray absorptiometry.
© 2022 The Authors. Journal of Applied Clinical Medical Physics published by Wiley Periodicals, LLC on behalf of The American Association of Physicists in Medicine.
Conflict of interest statement
The authors declare no conflict of interest.
Figures


References
-
- Lewiecki EM, Binkley N, Morgan SL, et al. Best practices for dual‐energy X‐ray absorptiometry measurement and reporting: international society for clinical densitometry guidance. J Clin Densitom. 2016;19(2):127‐140. - PubMed
-
- Jain RK, Vokes T. Dual‐energy X‐ray absorptiometry. J Clin Densitom. 2017;20(3):291‐303. - PubMed
-
- Carey JJ, Delaney MF. Utility of DXA for monitoring, technical aspects of DXA BMD measurement and precision testing. Bone. 2017;104:44‐53. - PubMed
-
- Faulkner KG, Mcclung MR. Quality‐control of DXA instruments in multicenter trials. Osteoporosis Int. 1995;5(4):218‐227. - PubMed
-
- Blake GM, Fogelman I. Technical principles of dual energy x‐ray absorptiometry. Semin Nucl Med. 1997;27(3):210‐228. - PubMed
MeSH terms
LinkOut - more resources
Full Text Sources
Research Materials
Miscellaneous

