. 2022 Nov;9(31):e2204097.
doi: 10.1002/advs.202204097. Epub 2022 Sep 4.

Patient-Derived Organoids from Colorectal Cancer with Paired Liver Metastasis Reveal Tumor Heterogeneity and Predict Response to Chemotherapy

Affiliations

Patient-Derived Organoids from Colorectal Cancer with Paired Liver Metastasis Reveal Tumor Heterogeneity and Predict Response to Chemotherapy

Shaobo Mo et al. Adv Sci (Weinh). 2022 Nov.

Abstract

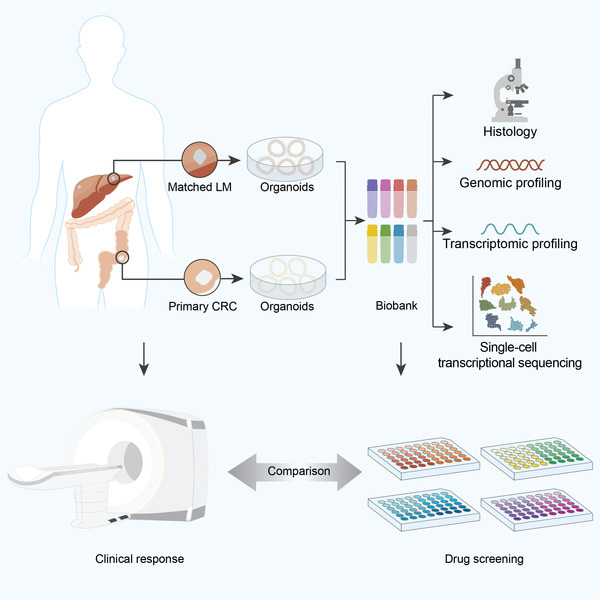
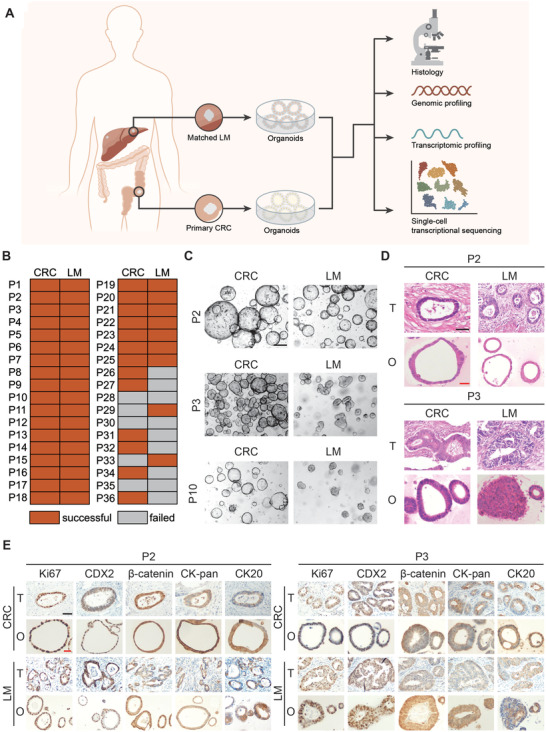
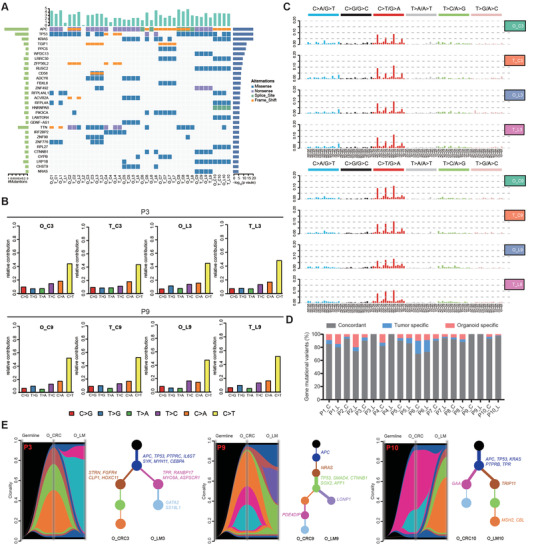
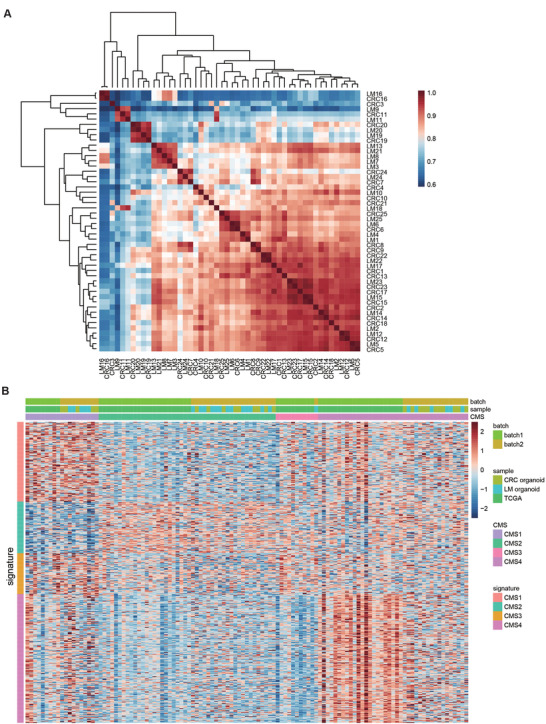
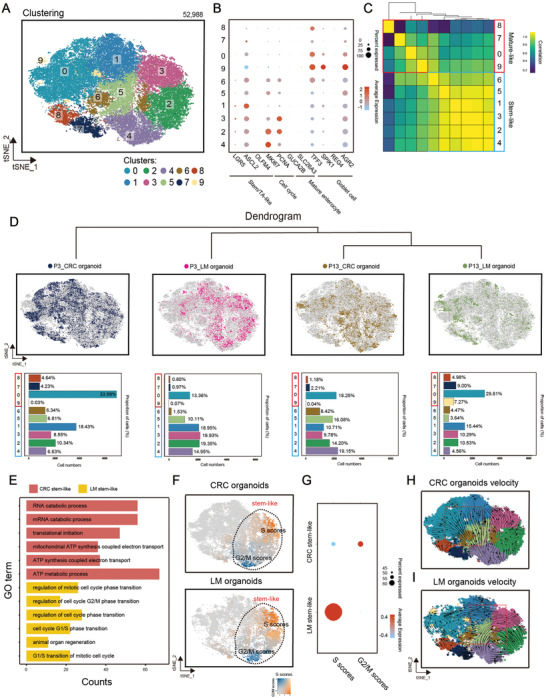
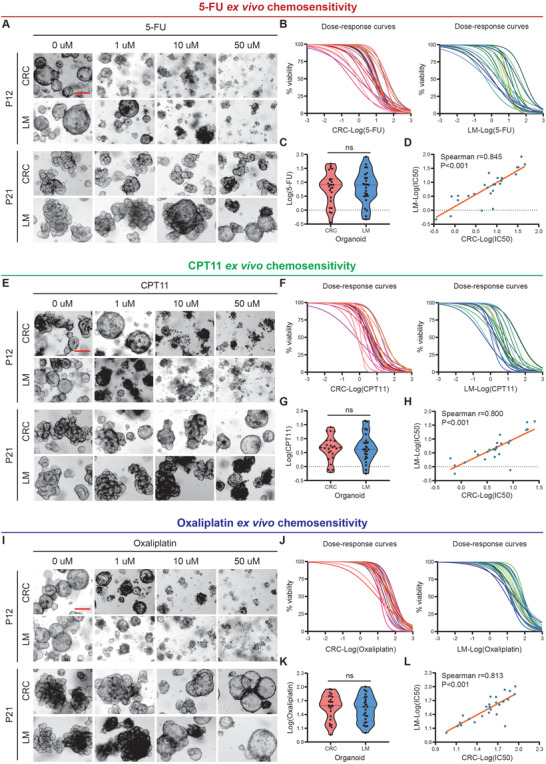
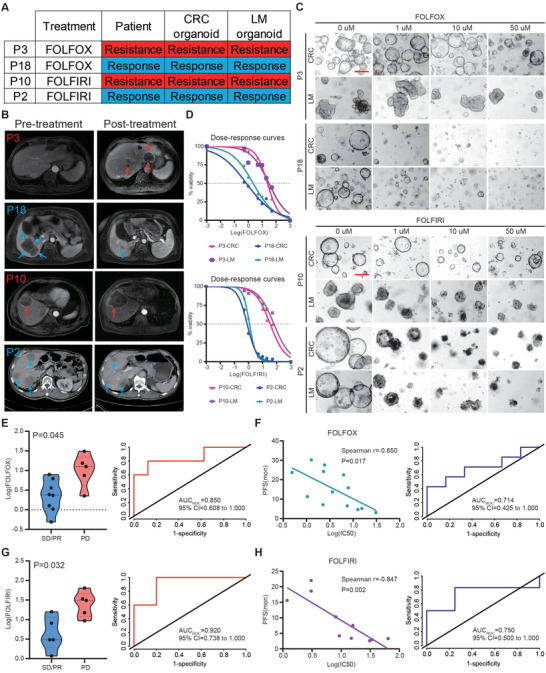
There is no effective method to predict chemotherapy response and postoperative prognosis of colorectal cancer liver metastasis (CRLM) patients. Patient-derived organoid (PDO) has become an important preclinical model. Herein, a living biobank with 50 CRLM organoids derived from primary tumors and paired liver metastatic lesions is successfully constructed. CRLM PDOs from the multiomics levels (histopathology, genome, transcriptome and single-cell sequencing) are comprehensively analyzed and confirmed that this organoid platform for CRLM could capture intra- and interpatient heterogeneity. The chemosensitivity data in vitro reveal the potential value of clinical application for PDOs to predict chemotherapy response (FOLFOX or FOLFIRI) and clinical prognosis of CRLM patients. Taken together, CRLM PDOs can be utilized to deliver a potential application for personalized medicine.

Keywords: chemotherapy response; colorectal cancer liver metastasis; patient-derived organoid; prognosis prediction; tumor heterogeneity.


Conflict of interest statement

H.G.Q. and H.C. are scientific founders of D1 Medical Technology. H.C. is an inventor on several patents related to organoid technology. The remaining authors declare no competing interests with relevance to this study.

Figures

Scheme 1
Scheme 1
Graphical summary of the study concept. A living biobank with 50 CRLM organoids derived from primary tumors and paired liver metastatic lesions was constructed and comprehensively analyzed from the multi omics levels (histopathology, genome, transcriptome, and single‐cell sequencing). Moreover, PDOs manifest potential to predict chemotherapy response and clinical prognosis of CRLM patients.
Figure 1
Figure 1
Study design and histopathological characterization of PDOs from CRLM patients. A) Establishment of CRLM patient derived organoid library and multiomics analysis of CRLM organoids (histopathology, genomic profiling, transcriptomic profiling and single‐cell transcriptional sequencing). B) PDOs growth success rate derived from CRC and LM tissue in different CRLM patients. C) The morphology of CRLM organoids with three typical characteristics in bright field. Both CRC and LM organoids from P2 CRLM patient showed thin‐walled cystic structures (top); The CRC organoids from P3 CRLM patient showed thick‐walled cystic structures, while LM organoids showed irregular solid/compact structures (middle); The CRC organoids from P10 CRLM patient presented thin‐walled cystic structures, while LM organoids presented solid spherical structures (bottom). Black scale bar, 200 µm. D) H&E staining comparing CRLM organoids with corresponding primary tumors. (T, primary tumors; O, CRLM organoids). Black scale bar, 200 µm. Red scale bar, 100 µm. E) Immunohistochemistry staining of ki‐67, CDX2, β‐catenin, CK‐pan, and CK20 on CRLM organoids and corresponding primary tumors. (T, primary tumors; O, CRLM organoids). Black scale bar, 200 µm. Red scale bar, 100 µm. See also Table S1 and Figures S1–S4 (Supporting Information).
Figure 2
Figure 2
Genomic profiling in CRLM organoids and corresponding primary tumors. A) Overview of somatic mutations found in CRLM organoids and corresponding primary tumors. B,C) Different contributions of point mutation types and mutation characteristics in organoids and corresponding primary tumors from two CRLM patients (P3 and P9 patients) were displayed in bar graphs. D) Bar plots indicate the concordance (%) between the gene mutational variants identified in CRLM organoids and corresponding primary tumors. E) Riverplots generated by SuperFreq analysis showed the clonal evolution of CRLM organoids derived from CRC and paired LM tumor tissues. The y‐axis represents the proportion of tumor cells in each subclone. The black area represents germline mutation. The blue region represents somatic mutations detected in all cells of CRC and LM organoids. The remaining color regions represent different subclones present in CRC and/or LM organoids. Next, the situation in the riverplots was visualized as an evolutionary tree (right). Each node represents a subclone (corresponding to different color regions). The thickness of the branch corresponds to the number of mutations obtained in the population. The representative cancer driving genes of each subclone have been displayed and marked corresponding to different color regions. T, tissue; O, organoid; C, CRC; L, LM. See also Figures S5 and S6 (Supporting Information).
Figure 3
Figure 3
Transcriptomic profiling in CRLM organoids. A) Heat map of Spearman correlation values of CRLM organoids based on RNA‐seq expression data using 15 000 most variable genes and samples were clustered using hierarchical clustering with complete linkage on the correlation matrix. Cells are color‐coded by the Spearman correlation value. B) CRLM organoid RNA‐seq data (50 samples) was normalized and combined with TCGA RNA‐seq data (65 stage IV CRC samples). All CRLM organoids and TCGA samples were redefined by CMS. Within each CMS subtype, all samples are sorted by their mean gene expression for the CMS signature genes associated with that specific subtype. See also Tables S2 and S3 (Supporting Information).
Figure 4
Figure 4
Single cell RNA sequencing profiling in CRLM organoids. A) t‐SNE visualization of 52988 cells from four CRLM organoids (P3_CRC organoid, P3_LM organoid, P13_CRC organoid, and P13_LM organoid). Cells are colored according to clusters. B) Dot plot for the expression of marker genes in each cluster. Color represents the mean expression in each cell cluster, and size indicates the fraction of cells expressing marker genes. C) Correlation between the stem‐like clusters and the mature‐like clusters. D) t‐SNE visualization of 52988 cells from different organoid samples (top). Bar plot showing the proportion of cell clusters (bottom). E) Bar plots showing results of gene ontology enrichment analysis for upregulated genes of stem‐like cells in CRC and LM organoids, respectively. F,G) t‐SNE visualization colored by cell cycle gene scores. Dot plot for the expression of marker genes in each cluster. Color represents the mean expression in each cell cluster, and size indicates the fraction of cells expressing marker genes. H,I) RNA velocities of single cells in CRC and LM organoids. See also Tables S4 and S5 and Figures S7–S9 (Supporting Information).
Figure 5
Figure 5
Response of CRLM Organoids to 5‐fluorouracil, irinotecan, and oxaliplatin. A) CRLM organoids dose‐response to 5‐FU (top, representative bright‐field images of organoids sensitive to 5‐FU; bottom, representative bright‐field images of organoids resistant to 5‐FU). B) Ex vivo chemosensitivity of 25 CRC (left) and 25 LM (right) organoids to 5‐FU in the form of dose–response curves are displayed for each CRLM organoid (3 independent experiments for each). C) The standardized IC50 values of CRC and LM organoids were analyzed by paired t‐test to compare 5‐FU sensitivity between them. D) Correlation between the standardized IC50 values of CRC and LM organoids are displayed (two‐tailed Spearman correlation: Spearman r = 0.845, p ˂ 0.001 for 5‐FU). The linear regression line is plotted. E) CRLM organoids dose‐response to CPT11 (top, representative bright‐field images of organoids sensitive to CPT11; bottom, representative bright‐field images of organoids resistant to CPT11). F) Ex vivo chemosensitivity of 25 CRC (left) and 25 LM (right) organoids to CPT11 in the form of dose–response curves are displayed for each CRLM organoid (three independent experiments for each). G) The standardized IC50 values of CRC and LM organoids were analyzed by paired t‐test to compare CPT11 sensitivity between them. H) Correlation between the standardized IC50 values of CRC and LM organoids are displayed (two‐tailed Spearman correlation: Spearman r = 0.800, p ˂ 0.001 for CPT11). The linear regression line is plotted. I) CRLM organoids dose‐response to oxaliplatin (top, representative bright‐field images of organoids sensitive to oxaliplatin; bottom, representative bright‐field images of organoids resistant to oxaliplatin). J) Ex vivo chemosensitivity of 25 CRC (left) and 25 LM (right) organoids to oxaliplatin in the form of dose–response curves are displayed for each CRLM organoid (three independent experiments for each). K) The standardized IC50 values of CRC and LM organoids were analyzed by paired t‐test to compare oxaliplatin sensitivity between them. L) Correlation between the standardized IC50 values of CRC and LM organoids is displayed (two‐tailed Spearman correlation: Spearman r = 0.813, p ˂ 0.001 for oxaliplatin). The linear regression line is plotted. ns, no significance; Red scale bar, 100 µm. See also Table S6 and Figures S10–S12 (Supporting Information).
Figure 6
Figure 6
PDOs predict chemotherapy response and clinical prognosis of CRLM patients. A) The table summarizes the results for the selected CRLM organoids and corresponding patients’ drug responses. B) The imaging manifestations of target lesions in 4 CRLM patients before and after treatment, including the progression of lesions in P3 and P10 patients and the regression of lesions in P18 and P2 patients. C) CRLM organoids dose‐response to FOLFOX (top, representative bright‐field images of organoids resistant to FOLFOX (P3 patient); bottom, representative bright‐field images of organoids sensitive to FOLFOX (P18 patient)) and FOLFIRI (top, representative bright‐field images of organoids resistant to FOLFIRI (P10 patient); bottom, representative bright‐field images of organoids sensitive to FOLFIRI (P2 patient)). Red scale bar, 100 µm. D) Ex vivo chemosensitivity of P3 and P18 patient organoids to FOLFOX (top) and P10 and P2 patient organoids to FOLFIRI (bottom) in the form of dose–response curves are displayed (three independent experiments for each). E) The standardized IC50 values of organoids for FOLFOX chemosensitivity from SD/PR patients (n = 8) and PD patients (n = 5) were compared using a two‐tailed Mann‐Whitney test (left). An ROC curve was plotted to indicate the predictive efficacy of organoids for FOLFOX treatment response (right). F) Correlation between the standardized IC50 values of organoids and progression‐free survival (PFS) for CRLM patients (n = 13) are displayed (Two‐tailed Spearman correlation: Spearman r = 0.650, p = 0.017 for FOLFOX). The linear regression line is plotted (left). An ROC curve was plotted to indicate the predictive efficacy of organoids for CRLM patients’ clinical prognosis receiving FOLFOX treatment (right). G) The standardized IC50 values of organoids for FOLFIRI chemosensitivity from SD/PR patients (n = 5) and PD patients (n = 5) were compared using a two‐tailed Mann‐Whitney test (left). An ROC curve was plotted to indicate the predictive efficacy of organoids for FOLFIRI treatment response (right). H) Correlation between the standardized IC50 values of organoids and progression‐free survival (PFS) for CRLM patients (n = 10) are displayed (two‐tailed Spearman correlation: Spearman r = 0.847, p = 0.002 for FOLFIRI). The linear regression line is plotted (left). An ROC curve was plotted to indicate the predictive efficacy of organoids for CRLM patients’ clinical prognosis receiving FOLFIRI treatment (right). See also Table S7 and Figures S13 and S14 (Supporting Information).

References

    1. Siegel R. L., Miller K. D., Fuchs H. E., Jemal A., Ca‐Cancer J. Clin. 2021, 71, 7. - PubMed
    1. Ren L., Zhu D., A. B. Benson, 3rd , Nordlinger B., Koehne C. H., Delaney C. P., Kerr D., Lenz H. J., Fan J., Wang J., Gu J., Li J., Shen L., Tsarkov P., Tejpar S., Zheng S., Zhang S., Gruenberger T., Qin X., Wang X., Zhang Z., Poston G. J., Xu J., Eur. J. Surg. Oncol. 2020, 46, 955. - PubMed
    1. Akgül Ö., Çetinkaya E., Ersöz Ş., Tez M., World J. Gastroenterol. 2014, 20, 6113. - PMC - PubMed
    1. Power D. G., Kemeny N. E., J. Clin. Oncol. 2010, 28, 2300. - PubMed
    1. Al Bandar M. H., Kim N. K., Oncol. Rep. 2017, 37, 2553. - PubMed

Publication types

MeSH terms

Substances

LinkOut - more resources