. 2022 Nov;9(32):e2203505.
doi: 10.1002/advs.202203505. Epub 2022 Sep 4.

Decoy Exosomes Offer Protection Against Chemotherapy-Induced Toxicity

Affiliations

Decoy Exosomes Offer Protection Against Chemotherapy-Induced Toxicity

Miao Fan et al. Adv Sci (Weinh). 2022 Nov.

Abstract

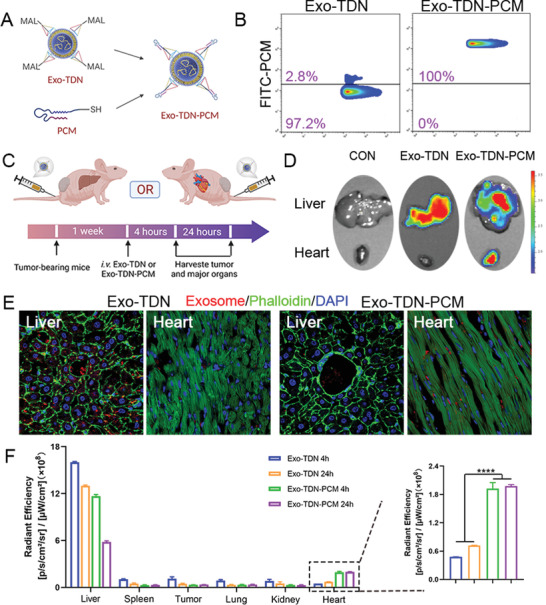
Cancer patients often face severe organ toxicity caused by chemotherapy. Among these, chemotherapy-induced hepatotoxicity and cardiotoxicity are the main causes of death of cancer patients. Chemotherapy-induced cardiotoxicity even creates a new discipline termed "cardio-oncology". Therefore, relieving toxicities induced by chemotherapy has become a key issue for improving the survival and quality of life in cancer patients. In this work, mesenchymal stem cell exosomes with the "G-C" abundant tetrahedral DNA nanostructure (TDN) are modified to form a decoy exosome (Exo-TDN). Exo-TDN reduces DOX-induced hepatotoxicity as the "G-C" base pairs scavenge DOX. Furthermore, Exo-TDN with cardiomyopathic peptide (Exo-TDN-PCM) is engineered for specific targeting to cardiomyocytes. Injection of Exo-TDN-PCM significantly reduces DOX-induced cardiotoxicity. Interestingly, Exo-TDN-PCM can also promote macrophage polarization into the M2 type for tissue repair. In addition, those decoy exosomes do not affect the anticancer effects of DOX. This decoy exosome strategy serves as a promising therapy to reduce chemo-induced toxicity.

Keywords: cardio-oncology; cardiotoxicity; chemotherapy; exosome; tetrahedral DNA nanostructure.


Conflict of interest statement

The authors declare no conflict of interest.

Figures

Scheme 1
Scheme 1
Schematic showing the synthesis of tetrahedral DNA with/without myocardial targeted peptides engineered exosomes (Exo‐TDN/Exo‐TDN‐PCM) and their detoxifying ability to DOX‐induced hepatotoxicity and cardiotoxicity.
Figure 1
Figure 1
Characterization of Exo‐TDN. A) TEM picture of exosomes. Scale bar, 100 nm. B) Western blot analysis of exosomes. CD81, CD63, and TSG101 were exosome markers. C) Agarose electrophoresis of TDN (T1: S1; T2: S1+S2; T3: T2+S3; T4: T3+S4). D) AFM image of TDN and height distribution histograms. E) Agarose electrophoresis analysis of the synthesis of Exo‐TDN. F) TEM image of Exo‐TDN with immunogold labeling of TDN. Scale bar, 100 nm. G,H) NTA (G) and Zeta potential (H) analysis of TDN, Exo, and Exo‐TDN. I) The grafting efficiency of TDN on the exosome (n = 3). J) The fluorescence sp of 1 µmol L−1 DOX solution after adding different amounts of Exo‐TDN. K) The capture efficiency of DOX by Exo‐TDN (n = 3). Data are presented as the mean ± SD. *p <  0.05; ** p < 0.01; *** p < 0.001; **** p < 0.0001.
Figure 2
Figure 2
Exo‐TDN inhibited DOX‐induced apoptosis. A) The cell survival rates of BRL‐3A cell when treated with different concentrations of DOX, TDN, Exo, and Exo‐TDN (n = 3). B) LIVE–DEAD cell‐staining of BRL‐3A cell after treating with DOX, Exo+DOX, TDN+DOX, and Exo‐TDN +DOX (Blue: Live, Green: Dead). Scale bars, 100 µm. C) CLSM imaging of BRL‐3A cell uptake Exo‐TDN, and fluorescence quantification of Exo‐TDN in cytoplasm (n = 3). Scale bars, 50 µm. D) CLSM imaging of the inhibition of DOX from entering the nucleus by Exo‐TDN, as well as fluorescence quantification of DOX in the nucleus (n = 3). Scale bars, 50 µm. Data are presented as the mean ± SD. *p < 0.05; ** p < 0.01; *** p < 0.001; **** p < 0.0001.
Figure 3
Figure 3
Exo‐TDN polarized macrophages to the M2 phenotype. A) CLSM imaging and B) FC results of RAW 264.7 cell uptake of Exo‐TDN. Scale bars, 20 µm. C,D) FC results of the expression of CD80 (C) and CD206 (D) in RAW 264.7 cells. E) CLSM imaging and fluorescence quantification of CD80 and CD206 expression in RAW 264.7 cells (n = 3). Scale bars, 20 µm. F) Western blot results of the expression of Arg‐1 and iNOS in RAW 264.7 cells. G) Grayscale statistics for different protein bands (n = 3). Data are presented as the mean ± SD. *p < 0.05; ** p < 0.01; *** p < 0.001; **** p < 0.0001.
Figure 4
Figure 4
The biodistribution of Exo‐TDN or Exo‐TDN‐PCM in tumor‐bearing mice. A) Schematic of the synthesis of Exo‐TDN‐PCM. B) Nano‐flow cytometry results of Exo‐TDN and Exo‐TDN‐PCM. C) Schematic of the in vivo distribution experiment to test targeting capabilities of Exo‐TDN or Exo‐TDN‐PCM. D) Ex vivo fluorescence imaging to detect the biodistribution of DiD‐labeled Exo‐TDN and Exo‐TDN‐PCM after 4 h of in vivo injection. E) CLSM images showing the distribution of DiD‐labeled Exo‐TDN and Exo‐TDN‐PCM. F) Quantitative analysis of fluorescent intensity in the different tissues after injection of Exo‐TDN or Exo‐TDN‐PCM for 4 and 24 h (n = 3). Data are presented as the mean ± SD. *p < 0.05; ** p < 0.01; *** p < 0.001; **** p < 0.0001.
Figure 5
Figure 5
Study of liver protection effect of Exo‐TDN. A) Schematic of the overall design of the animal experiments to test the liver protection of Exo‐TDN. B) Blood biochemical analysis of mice after 21 days of treatment (n = 4). C) TUNEL and apoptosis‐related proteins staining analysis of liver tissue in the treatment of different groups. Scale bars, 100 µm. D–F) Quantitative analysis of TUNEL staining images (D), Casp3 staining images (E), and Bcl‐2 staining images (F) (n = 3). G) Tumor volume changes of mice in different treatment groups (n = 8). H) Quantitative analysis of TUNEL staining images of tumor tissue in the treatment of different groups (n = 3). Data are presented as the mean ± SD. *p < 0.05; ** p < 0.01; *** p < 0.001; **** p < 0.0001.
Figure 6
Figure 6
The study of heart protection of Exo‐TDN‐PCM. A) Schematic of the overall design of the animal experiments to test the heart protection of Exo‐TDN‐PCM. B) The content of BNP and cTnI in serum after 42 days of treatment (n = 3). C) Masson staining images of heart tissue in different treatment groups. Scale bars, 100 µm. D) Quantitative analysis of TUNEL staining images (n = 3). E) Quantitative analysis of immunohistochemical staining images of heart tissue showing, Casp3, Bcl‐2 expression (n = 3). Data are presented as the mean ± SD. *p < 0.05; ** p < 0.01; *** p < 0.001; **** p < 0.0001.
Figure 7
Figure 7
The study of heart protection mechanisms of Exo‐TDN‐PCM. A) CLSM images of Ki67 staining of heart sections 42 days after injection. Scale bars, 100 µm. B) Quantitative data corresponding to Ki67 staining (n = 3). n per HPF is a unit of fluorescence brightness. n refers to the quantified fluorescence intensity. HPF refers to the high power field. C) Histochemistry score of immunohistochemical staining images of CD80 and CD206 (n = 3). D) Left ventricular ejection fraction (LVEF) and fractional shortening (FS) 42 days after treatment (n = 5). E) Schematic of the heart protection mechanism of Exo‐TDN‐PCM. F) Representative photographs of tumor after 22 days of treatment. G) Tumor volume changes of mice in different treatment groups (n = 6). H) Histochemistry score of TUNEL staining images of tumor tissue in the treatment of different groups (n = 3). Data are presented as the mean ± SD. *p < 0.05; ** p < 0.01; *** p < 0.001; **** p < 0.0001.

References

    1. Ward B. W., Schiller J. S., Goodman R. A., Prev. Chronic Dis. 2014, 11, 62. - PMC - PubMed
    1. Sung H., Ferlay J., Siegel R. L., Laversanne M., Soerjomataram I., Jemal A., Bray F., CA Cancer J. Clin. 2021, 71, 209. - PubMed
    1. Zhao R., Liu X., Yang X., Jin B., Shao C., Kang W., Tang R., Adv. Mater. 2018, 30, 1801304. - PubMed
    1. Kleiner D. E., Chalasani N. P., Lee W. M., Fontana R. J., Bonkovsky H. L., Watkins P. B., Hayashi P. H., Davern T. J., Navarro V., Reddy R., Talwalkar J. A., Stolz A., Gu J., Barnhart H., Hoofnagle J. H., Hepatology 2014, 59, 661. - PMC - PubMed
    1. Li L., Takemura G., Li Y., Miyata S., Esaki M., Okada H., Kanamori H., Khai N. C., Maruyama R., Ogino A., Minatoguchi S., Fujiwara T., Fujiwara H., Circulation 2006, 113, 535. - PubMed

Publication types

MeSH terms

Substances