. 2022 Oct 24;377(1862):20210280.
doi: 10.1098/rstb.2021.0280. Epub 2022 Sep 5.

Exploiting colour space geometry for visual stimulus design across animals

Affiliations

Exploiting colour space geometry for visual stimulus design across animals

Matthias P Christenson et al. Philos Trans R Soc Lond B Biol Sci. .

Abstract

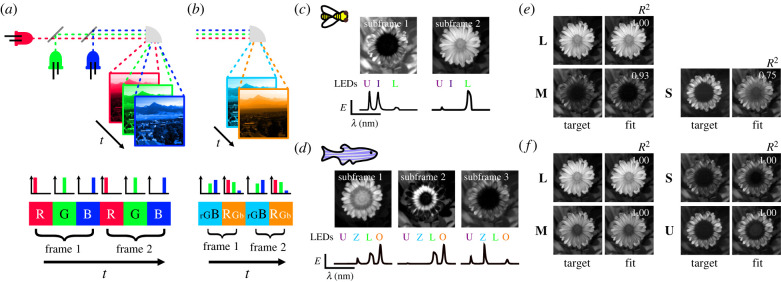
Colour vision represents a vital aspect of perception that ultimately enables a wide variety of species to thrive in the natural world. However, unified methods for constructing chromatic visual stimuli in a laboratory setting are lacking. Here, we present stimulus design methods and an accompanying programming package to efficiently probe the colour space of any species in which the photoreceptor spectral sensitivities are known. Our hardware-agnostic approach incorporates photoreceptor models within the framework of the principle of univariance. This enables experimenters to identify the most effective way to combine multiple light sources to create desired distributions of light, and thus easily construct relevant stimuli for mapping the colour space of an organism. We include methodology to handle uncertainty of photoreceptor spectral sensitivity as well as to optimally reconstruct hyperspectral images given recent hardware advances. Our methods support broad applications in colour vision science and provide a framework for uniform stimulus designs across experimental systems. This article is part of the theme issue 'Understanding colour vision: molecular, physiological, neuronal and behavioural studies in arthropods'.

Keywords: Python; colour management; colour space; colour vision; nonlinear optimization; univariance.


Figures

Figure 1.
Figure 1.
Colour and chromatic spaces of di-, tri- and tetrachromatic animals. (ac) Spectral sensitivity functions for the different opsins expressed in the photoreceptors of the mouse, the honeybee and the zebrafish, respectively. Photoreceptors are assigned the labels long (L), medium (M), short (S), ultrashort (U) from the longest to shortest wavelength-sensitive photoreceptors. (df) Schematic of receptor-based colour spaces of di-, tri- and tetrachromatic animals, respectively. Q denotes capture. (gi) Chromatic diagrams for the mouse, the honeybee and the zebrafish, respectively. The coloured line indicates the loci of single wavelengths in the chromatic diagram. The dotted lines indicate hypothetical non-spectral colour lines that connect the points along the single wavelength colour line that maximally excite non-consecutive photoreceptors.
Figure 2.
Figure 2.
Schematic of the photoreceptor model. (a) Two example spectral distributions of light constructed artificially. Red: exp(sin (2π(λ − 300 nm)/400 nm)); blue: exp(cos (2π(λ − 300 nm)/400 nm)). (b) Artificial spectral sensitivities constructed using a Gaussian distribution with mean 440 and 520 nm and standard deviation 50 and 80 nm for the shorter (S) and longer (L) wavelength-sensitive photoreceptor, respectively. (c) To calculate capture, the lights in (a) hitting the photoreceptors in (b) are each multiplied by the spectral sensitivities of each photoreceptor and integrated across wavelengths. A small baseline capture value ε can be added to the light-induced capture value. (d) To calculate the relative capture, the absolute capture calculated in (c) is divided by the background capture according to von Kries adaptation. (e) A nonlinear transformation is applied to the relative capture values to obtain photoreceptor excitations. (f) Photoreceptor signals are further processed in downstream circuits to give rise to colour percepts. (g) Example stimulation system consisting of a set of three LED light sources at their maximum intensity (violet, green and orange). (hj) Capture space, relative capture space and excitation space of photoreceptors in (b). The coloured vectors represent the integration of the LED spectra in (g) with the spectral sensitivities in (b). The colours match the colours of the LEDs in (g). These vectors can be combined arbitrarily up to their maximum LED intensities and define the gamut of the stimulation system (black lines). The red and blue circles are the calculated captures, relative captures and excitation values for the spectra in (a). The red-coloured spectrum is out-of-gamut for the stimulation system defined in (g). Projection of this out-of-gamut spectrum onto the gamut of the stimulation system gives different solutions when done in capture, relative capture, or excitation space (red line). The red X drawn at the edge of the stimulation system’s gamut corresponds to the projection of the red-coloured spectrum onto the gamut in excitation space (i.e. the fit in excitation space).
Figure 3.
Figure 3.
Fitting targeted stimuli to different model organisms. (a) Example target spectra to be reconstructed: a set of natural spectral distributions (blue) and a set of Gaussian spectral distributions (red). (b–d) Absolute relative error of fitting the 400 nm spectrum to the mouse, honeybee and zebrafish, respectively. For the mouse, two LEDs are sufficient to recreate the spectrum, but for the zebrafish, a perfect recreation is not even possible with six LEDs. (e–g) Absolute relative error of fitting a natural spectrum to the mouse, honeybee and zebrafish, respectively. For the mouse, two LEDs, for the honeybee, three LEDs and for the zebrafish, four LEDs are sufficient to perfectly simulate the spectrum. (h–j) Goodness-of-fit (R2) values for the best LED sets (top 10%) across different number of LED combinations for the mouse, honeybee and zebrafish, respectively. The bars for each point correspond to the range of R2 values achieved for the top 10% of LED combinations. The y-axis is plotted on an exponential scale to highlight differences in the goodness-of-fit close to 1.
Figure 4.
Figure 4.
Minimizing the variance in excitation values due to uncertainty improves the average fit. (a) Variance in the spectral sensitivity for the short and long photoreceptors from the example in figure 2b by varying the mean between 420 and 460 nm and between 500 and 540 nm for each photoreceptor in steps of 10 nm and varying the standard deviation between 30 and 70 nm and between 60 and 100 nm in steps of 10 nm for each photoreceptor, respectively. (b) Relative capture space of the photoreceptors in (a) adapted to a flat background spectrum. Gamut of the LED set in figure 2g (thick line) and the resulting variance of the gamut due to the variance in the spectral sensitivities (thin lines). X symbols correspond to example capture values that are within the gamut given the expected sensitivities in (a) (thick lines). (c) Possible LED proportions that result in the same calculated capture for the four examples in (b) using the expected sensitivities and the stimulation system from figure 2g. Each coloured line corresponds to the set of proportions that result in the same capture. The colour indicates the overall intensities of the set of LEDs. Xs indicate the fitted LED intensities using the fitting procedure defined by equation (3.7). The open squares indicate the fitted intensities after minimizing the variance according to equation (5.3) given the uncertainty in the spectral sensitivities as shown in (a). (d) Randomly drawn captures that are in- and out-of-gamut (grey squares). (e) Average improvement in the R2 score for all possible samples of the spectral sensitivities in (a) when fitting the points in (d) with the additional variance optimization step. The black bars correspond to within-gamut samples and open bars correspond to out-of-gamut samples.
Figure 5.
Figure 5.
Reconstructing hyperspectral images with fewer subframes and number of photoreceptor types in the honeybee and zebrafish. (a) Schematic of the subframe structure in traditional RGB projectors. (b) Schematic of a subframe structure with fewer subframes than LEDs. (c,d) Reconstruction of a hyperspectral flower [40] in the honeybee and zebrafish with two or three subframes and three or four LEDs, respectively. The top images are the 8-bit mask for each subframe and the bottom are the normalized LED intensities used for each subframe. (e,f) Comparison of target photoreceptor captures and fitted captures for each photoreceptor type for the honeybee and zebrafish, respectively. The R2 value for each photoreceptor type is indicated in the image of fitted values.

Similar articles

  • High diversity of arthropod colour vision: from genes to ecology.
    Yilmaz A, Hempel de Ibarra N, Kelber A. Yilmaz A, et al. Philos Trans R Soc Lond B Biol Sci. 2022 Oct 24;377(1862):20210273. doi: 10.1098/rstb.2021.0273. Epub 2022 Sep 5. Philos Trans R Soc Lond B Biol Sci. 2022. PMID: 36058249 Free PMC article.
  • Understanding insect colour constancy.
    Werner A. Werner A. Philos Trans R Soc Lond B Biol Sci. 2022 Oct 24;377(1862):20210286. doi: 10.1098/rstb.2021.0286. Epub 2022 Sep 5. Philos Trans R Soc Lond B Biol Sci. 2022. PMID: 36058239 Free PMC article. Review.
  • Colour vision in nocturnal insects.
    Warrant E, Somanathan H. Warrant E, et al. Philos Trans R Soc Lond B Biol Sci. 2022 Oct 24;377(1862):20210285. doi: 10.1098/rstb.2021.0285. Epub 2022 Sep 5. Philos Trans R Soc Lond B Biol Sci. 2022. PMID: 36058247 Free PMC article. Review.
  • Colour vision in ants (Formicidae, Hymenoptera).
    Yilmaz A, Spaethe J. Yilmaz A, et al. Philos Trans R Soc Lond B Biol Sci. 2022 Oct 24;377(1862):20210291. doi: 10.1098/rstb.2021.0291. Epub 2022 Sep 5. Philos Trans R Soc Lond B Biol Sci. 2022. PMID: 36058251 Free PMC article. Review.
  • Adaptive plasticity during the development of colour vision.
    Wagner HJ, Kröger RH. Wagner HJ, et al. Prog Retin Eye Res. 2005 Jul;24(4):521-36. doi: 10.1016/j.preteyeres.2005.01.002. Prog Retin Eye Res. 2005. PMID: 15845347 Review.

Cited by

References

    1. Rushton WAH. 1972. Review lecture. Pigments and signals in colour vision. J. Physiol. 220, 1-31. (10.1113/jphysiol.1972.sp009719) - DOI - PMC - PubMed
    1. Stockman A, Brainard DH. 2010. Color vision mechanisms. In The OSA handbook of optics, 3rd edn (ed. M. Bass), pp. 11.1-11.104. New York, NY: McGraw-Hill.
    1. Fleishman LJ, McClintock WJ, D’Eath RB, Brainard DH, Endler JA. 1998. Colour perception and the use of video playback experiments in animal behaviour. Anim. Behav. 56, 1035-1040. (10.1006/anbe.1998.0894) - DOI - PubMed
    1. Tedore C, Johnsen S. 2017. Using RGB displays to portray color realistic imagery to animal eyes. Cur. Zool. 63, 27-34. (10.1093/cz/zow076) - DOI - PMC - PubMed
    1. Kelber A, Osorio D. 2010. From spectral information to animal colour vision: experiments and concepts. Proc. R. Soc. B 277, 1617-1625. (10.1098/rspb.2009.2118) - DOI - PMC - PubMed

Publication types

LinkOut - more resources