

Supermarket Proximity and Risk of Hypertension, Diabetes, and CKD: A Retrospective Cohort Study
- PMID: 36058428
- PMCID: PMC10286129
- DOI: 10.1053/j.ajkd.2022.07.008
Supermarket Proximity and Risk of Hypertension, Diabetes, and CKD: A Retrospective Cohort Study
Abstract
Rationale & objective: Living in environments with low access to food may increase the risk of chronic diseases. We investigated the association of household distance to the nearest supermarket (as a measure of food access) with the incidence of hypertension, diabetes, and chronic kidney disease (CKD) in a metropolitan area of the United States.
Study design: Retrospective cohort study.
Setting & participants: 777,994 individuals without hypertension, diabetes, or CKD at baseline within the HealthLNK Data Repository, which contains electronic health records from 7 health care institutions in Chicago, Illinois.
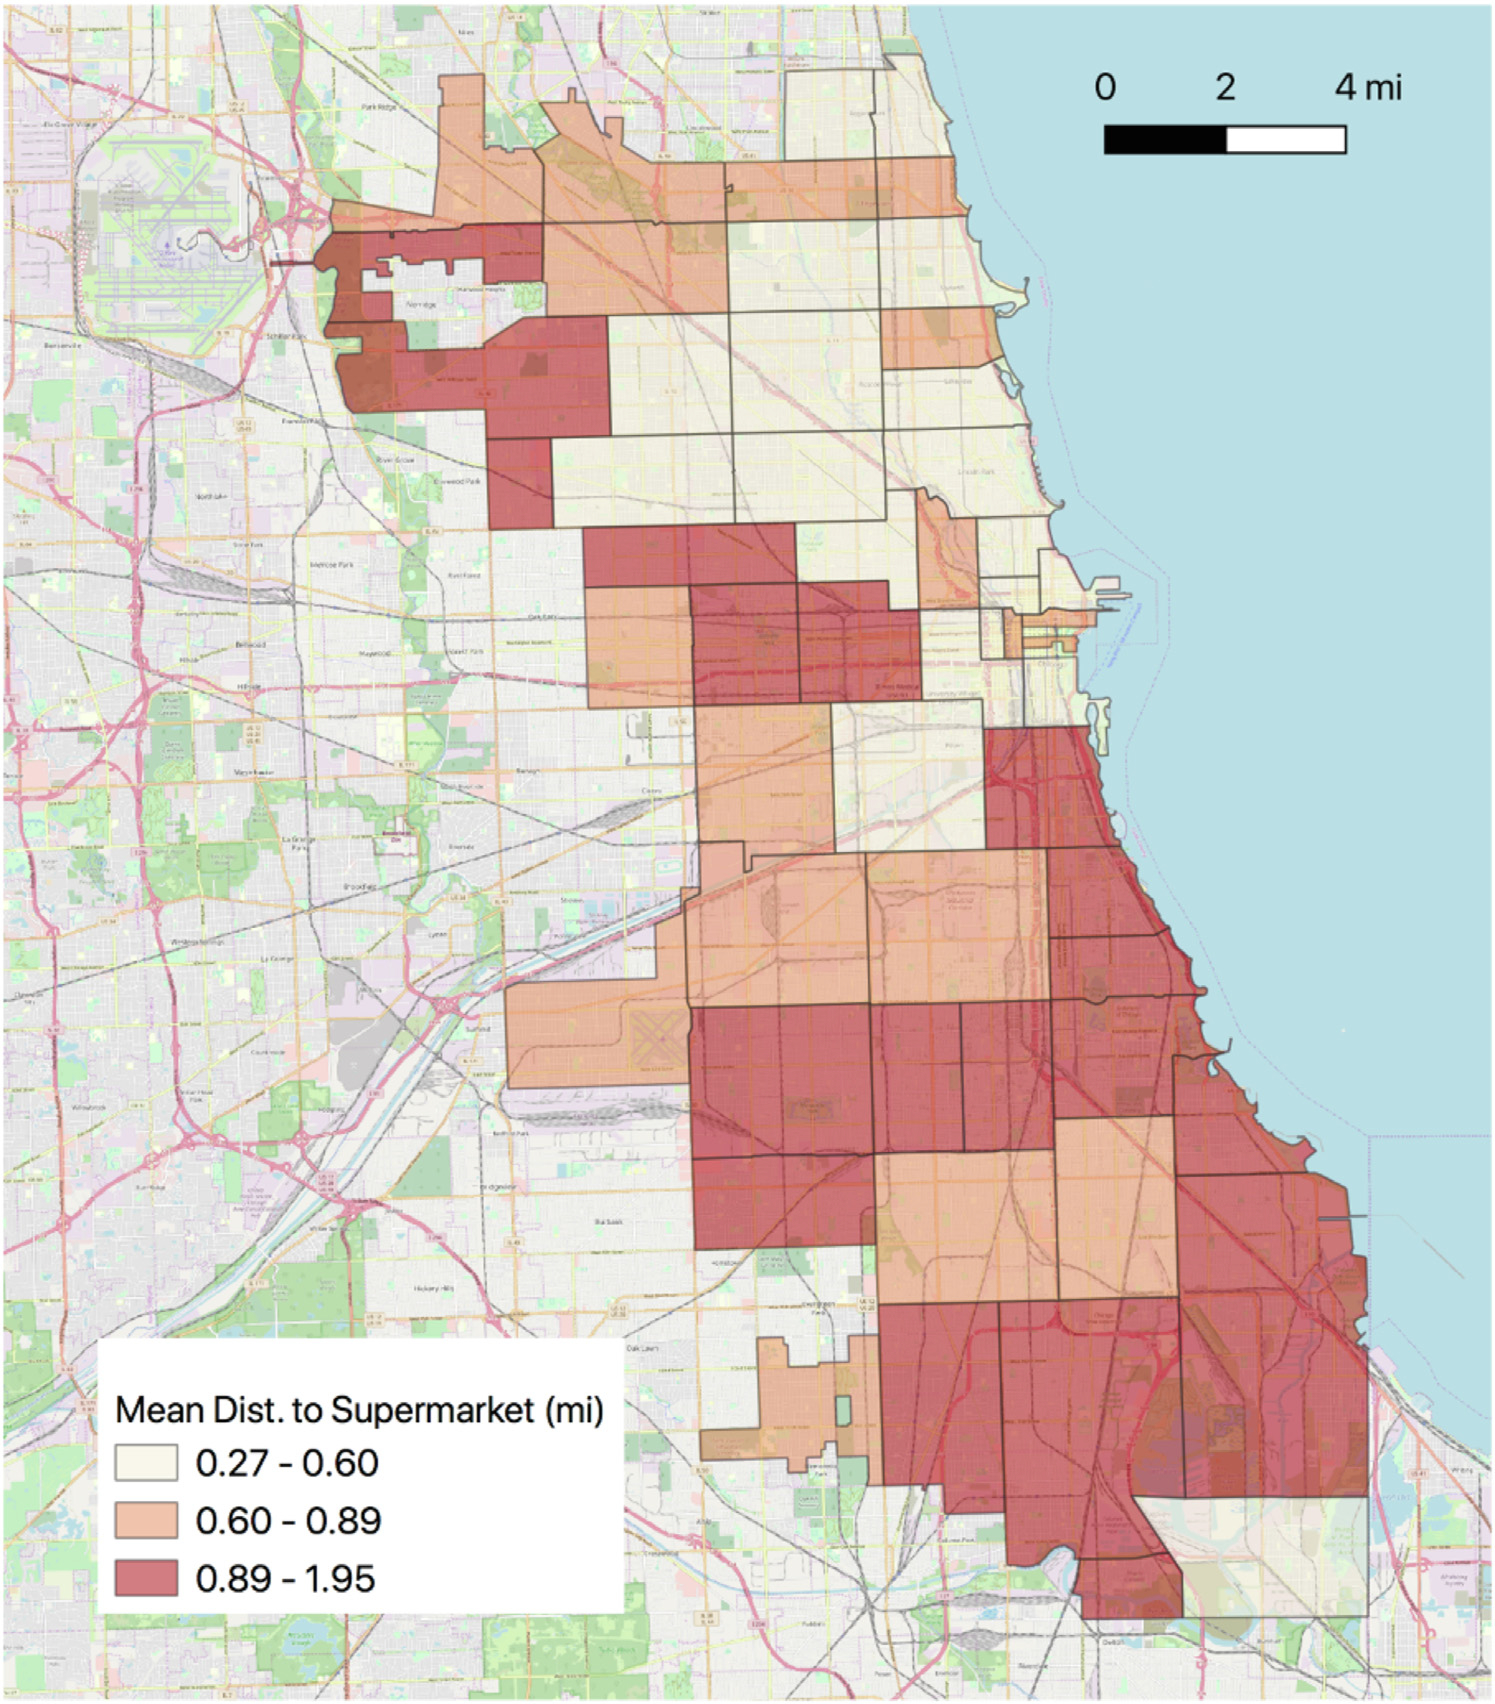
Exposure: Zip code-level average distance between households and nearest supermarket.
Outcome: Incidence of hypertension, diabetes, and CKD based on presence of ICD-9 code and/or blood pressure≥140/90mm Hg, hemoglobin A1c≥6.5%, and eGFR<60mL/min/1.73m2, respectively.
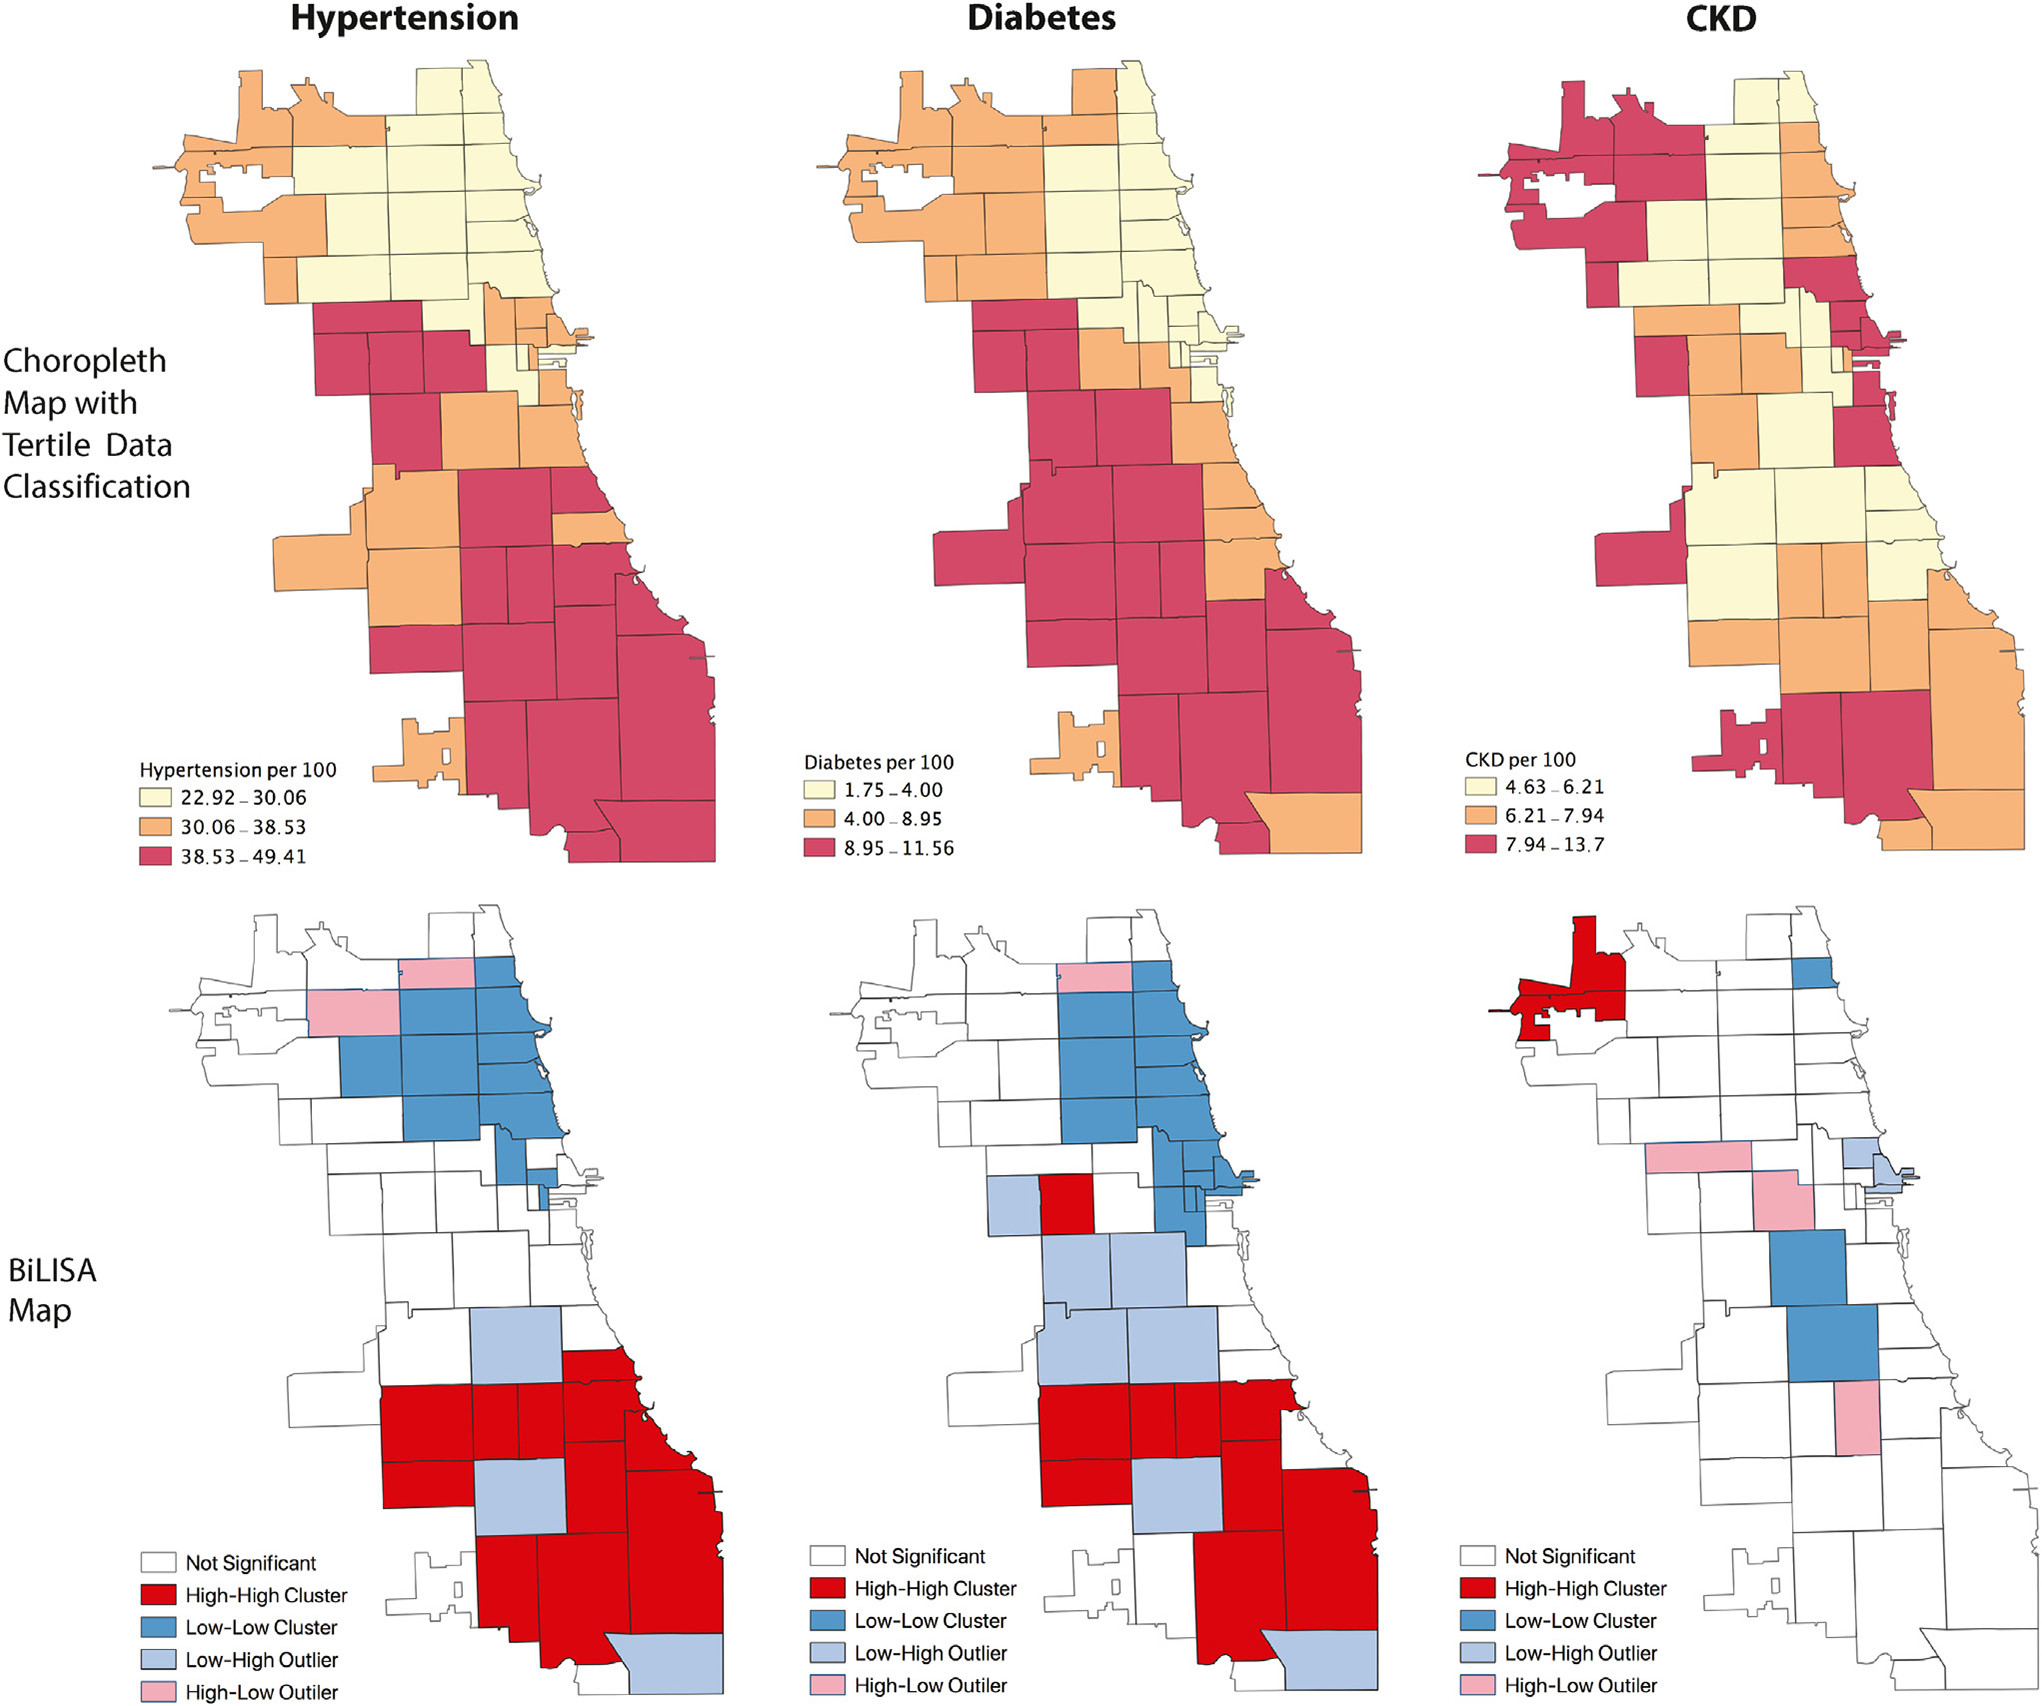
Analytical approach: Average distance to nearest supermarket was aggregated from street-level metrics for 56 Chicagoland zip codes. The cumulative incidence of hypertension, diabetes, and CKD from 2007-2012 was calculated for each zip code in patients free of these diseases in 2006. Spatial analysis of food access and disease incidence was performed using bivariate local indicator of spatial association (BiLISA) maps and bivariate local Moran I statistics. The relationship between supermarket access and outcomes was analyzed using logistic regression.
Results: Of 777,994 participants, 408,608 developed hypertension, 51,380 developed diabetes, and 56,365 developed CKD. There was significant spatial overlap between average distance to supermarket and incidence of hypertension and diabetes but not CKD. Zip codes with large average supermarket distances and high incidence of hypertension and diabetes were clustered in southern and western neighborhoods. Models adjusted only for neighborhood factors (zip code-level racial composition, access to vehicles, median income) revealed significant associations between zip code-level average distance to supermarket and chronic disease incidence. Relative to tertile 1 (shortest distance), ORs in tertiles 2 and 3, respectively, were 1.27 (95% CI, 1.23-1.30) and 1.38 (95% CI, 1.33-1.43) for diabetes, 1.03 (95% CI, 1.02-1.05) and 1.04 (95% CI, 1.02-1.06) for hypertension, and 1.18 (95% CI, 1.15-1.21) and 1.33 (95% CI, 1.29-1.37) for CKD. Models adjusted for demographic factors and health insurance showed significant and positive association with greater odds of incident diabetes (tertile 2: 1.29 [95% CI, 1.26-1.33]; tertile 3: 1.35 [95% CI, 1.31-1.39]) but lesser odds of hypertension (tertile 2: 0.95 [95% CI, 0.94-0.97]; tertile 3: 0.91 [95% CI, 0.89-0.92]) and CKD (tertile 2: 0.80 [95% CI, 0.78-0.82]; tertile 3: 0.73 [95% CI, 0.72-0.76]). After adjusting for both neighborhood and individual covariates, supermarket distance remained significantly associated with greater odds of diabetes and lesser odds of hypertension, but there was no significant association with CKD.
Limitations: Unmeasured neighborhood and social confounding variables, zip code-level analysis, and limited individual-level information.
Conclusions: There are significant disparities in supermarket proximity and incidence of hypertension, diabetes, and CKD in Chicago, Illinois. The relationship between supermarket access and chronic disease is largely explained by individual- and neighborhood-level factors.
Keywords: Chronic disease; chronic kidney disease (CKD); diabetes; dietary pattern; electronic health record (EHR); food access; food desert; health disparities; hypertension; kidney function; modifiable risk factor; neighborhood; neighborhood deprivation; nutrition.
Copyright © 2022 National Kidney Foundation, Inc. Published by Elsevier Inc. All rights reserved.
Conflict of interest statement
Figures
Similar articles
-
Ultraprocessed Foods and Kidney Disease Progression, Mortality, and Cardiovascular Disease Risk in the CRIC Study.Am J Kidney Dis. 2023 Aug;82(2):202-212. doi: 10.1053/j.ajkd.2023.01.452. Epub 2023 Apr 6. Am J Kidney Dis. 2023. PMID: 37028638 Free PMC article.
-
A Diet Rich in Vegetables and Fruit and Incident CKD: A Community-Based Prospective Cohort Study.Am J Kidney Dis. 2019 Oct;74(4):491-500. doi: 10.1053/j.ajkd.2019.02.023. Epub 2019 Apr 27. Am J Kidney Dis. 2019. PMID: 31040089
-
Food Access, Chronic Kidney Disease, and Hypertension in the U.S.Am J Prev Med. 2015 Dec;49(6):912-20. doi: 10.1016/j.amepre.2015.07.017. Am J Prev Med. 2015. PMID: 26590940 Free PMC article.
-
Hypertension and chronic kidney disease in Asian populations.J Clin Hypertens (Greenwich). 2021 Mar;23(3):475-480. doi: 10.1111/jch.14188. Epub 2021 Feb 4. J Clin Hypertens (Greenwich). 2021. PMID: 33538081 Free PMC article. Review.
-
Linking Sepsis with chronic arterial hypertension, diabetes mellitus, and socioeconomic factors in the United States: A scoping review.J Crit Care. 2023 Oct;77:154324. doi: 10.1016/j.jcrc.2023.154324. Epub 2023 May 7. J Crit Care. 2023. PMID: 37159971
Cited by
-
The application of neighborhood area deprivation index to improve health equity across the spectrum of heart failure: a review.Heart Fail Rev. 2025 May;30(3):589-604. doi: 10.1007/s10741-025-10492-4. Epub 2025 Mar 29. Heart Fail Rev. 2025. PMID: 40158031 Review.
-
Geospatial Analysis of the Social Determinants of Health of Participants of a Diabetes Management Program to Evaluate Enrollment of Vulnerable Populations.Prev Chronic Dis. 2024 Aug 22;21:E62. doi: 10.5888/pcd21.240068. Prev Chronic Dis. 2024. PMID: 39173185 Free PMC article. No abstract available.
-
Built environment and chronic kidney disease: current state and future directions.Curr Opin Nephrol Hypertens. 2025 Mar 1;34(2):143-150. doi: 10.1097/MNH.0000000000001048. Epub 2024 Nov 21. Curr Opin Nephrol Hypertens. 2025. PMID: 39569647 Review.
-
Neighborhood physical environments and change in cardiometabolic risk factors over 14 years in the study of Women's health across the nation.Health Place. 2024 May;87:103257. doi: 10.1016/j.healthplace.2024.103257. Epub 2024 May 1. Health Place. 2024. PMID: 38696876 Free PMC article.
-
The Exposome and the Kidney: A Silent Dialogue Shaping Chronic Kidney Disease.J Xenobiot. 2025 May 14;15(3):73. doi: 10.3390/jox15030073. J Xenobiot. 2025. PMID: 40407537 Free PMC article. Review.
References
MeSH terms
Grants and funding
LinkOut - more resources
Full Text Sources
Medical
Research Materials
Miscellaneous
