

The OTUD6B-LIN28B-MYC axis determines the proliferative state in multiple myeloma
- PMID: 36059274
- PMCID: PMC9574752
- DOI: 10.15252/embj.2022110871
The OTUD6B-LIN28B-MYC axis determines the proliferative state in multiple myeloma
Abstract
Deubiquitylases (DUBs) are therapeutically amenable components of the ubiquitin machinery that stabilize substrate proteins. Their inhibition can destabilize oncoproteins that may otherwise be undruggable. Here, we screened for DUB vulnerabilities in multiple myeloma, an incurable malignancy with dependency on the ubiquitin proteasome system and identified OTUD6B as an oncogene that drives the G1/S-transition. LIN28B, a suppressor of microRNA biogenesis, is specified as a bona fide cell cycle-specific substrate of OTUD6B. Stabilization of LIN28B drives MYC expression at G1/S, which in turn allows for rapid S-phase entry. Silencing OTUD6B or LIN28B inhibits multiple myeloma outgrowth in vivo and high OTUD6B expression evolves in patients that progress to symptomatic multiple myeloma and results in an adverse outcome of the disease. Thus, we link proteolytic ubiquitylation with post-transcriptional regulation and nominate OTUD6B as a potential mediator of the MGUS-multiple myeloma transition, a central regulator of MYC, and an actionable vulnerability in multiple myeloma and other tumors with an activated OTUD6B-LIN28B axis.
Keywords: RNA binding proteins; cell cycle; deubiquitylases; multiple myloma; ubiquitin.
© 2022 The Authors. Published under the terms of the CC BY 4.0 license.
Figures
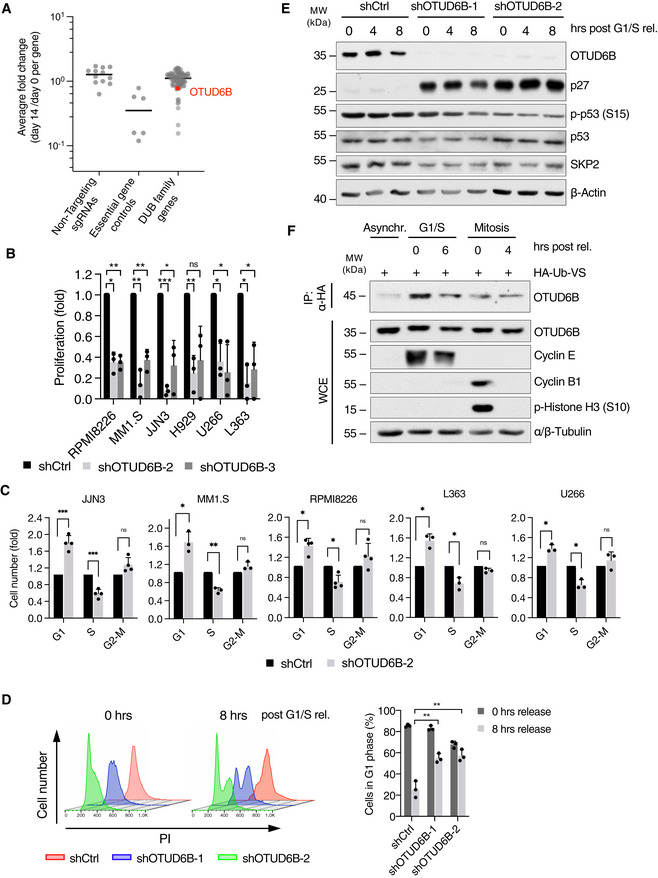
- A
Averaged sgRNA representation of a DUB CRISPR drop out screen in MM1.S cells clustered per gene. The ratio of normalized sgRNA read‐counts on day 14 versus day 0 was determined for each sgRNA and the average fold change blotted per gene (except for non‐targeting controls). Lines represent the median. Essential genes included as controls are: POLR2, PRPF8, RPL32, RPA3, RPL8, RPS19. OTUD6B is marked in red.
- B
Cell proliferation analysis of different MM cell lines, expressing shRNAs targeting OTUD6B as counted by trypan blue exclusion method. Numbers are depicted as fold of shCtrl on day 8 after infection (n = 3 independent experiments).
- C
Cell cycle analyses of JJN3, MM1.S, RPMI8226, L363 and U266 cells expressing the indicated shRNAs by BrdU/PI flow cytometry (n = 3 independent experiments).
- D
Flow cytometric analysis of PI stained MM1.S cells transduced with the indicated shRNAs before and after release from G1/S block. Left: Exemplary FACS‐plots. Right: Quantification of three independent experiments showing the percentage of cells in G1 phase.
- E
Immunoblot analysis of cells described in (D), harvested at the indicated time points after G1/S release. Exemplary blot from three independent experiments.
- F
DUB activity assay for OTUD6B in asynchronous, G1/S‐ or mitotically synchronized and released A549 cells using HA‐ubiquitin vinyl‐sulfone to isolate active forms of DUBs. Analysis was performed by immunoblotting using the indicated antibodies.

- A
Schematic depiction of the DUB‐CRISPR drop out screen workflow.
- B
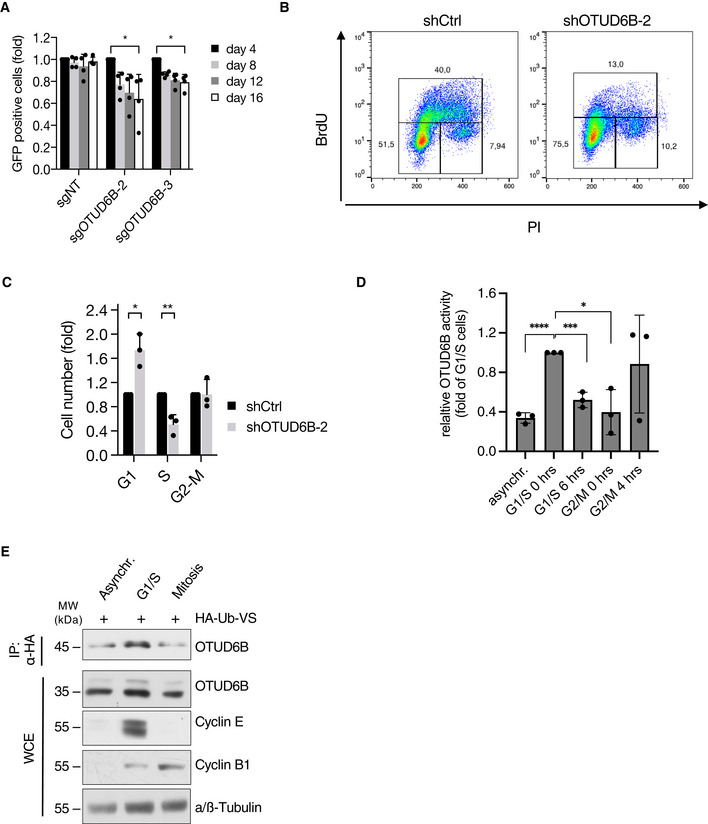
Proliferation analysis of MM1.S‐Cas9 cells infected with indicated sgRNAs. The ratio of sgRNA expressing (GFP+) cells to uninfected cells was measured by flow cytometry at the indicated time points after infection. Results are normalized to GFP+ cells at day 4 (n = 3 independent experiments, mean ± s.d.).
- C
Immunoblot analysis verifying OTUD6B knockout in Cas9 expressing MM1.S cells infected with the indicated sgRNAs. GFP+ cells were sorted by FACS and harvested 5 days after infection. Whole cell extracts (WCE) were probed with the indicated antibodies. CUL1 served as a loading control.
- D
Proliferation analysis of three additional Cas9 expressing MM cell lines lentivirally transduced with the indicated sgRNAs. The ratio of sgRNA expressing (GFP+) to uninfected cells was measured by flow cytometry at the indicated time points after infection. Results are normalized to day 4 after infection (n = 4 independent experiments, mean ± s.d.).
- E
Immunoblot analysis verifying OTUD6B knockout in Cas9 expressing MM cell lines, which were transduced with indicated sgRNAs. GFP+ cells were sorted by FACS 11 days after infection and WCE probed with indicated antibodies.
- F
Proliferation analysis of RPMI8226 cells stably expressing OTUD6B isoform 1 from a doxycycline inducible promotor and the indicated shRNAs with or without doxycycline mediated transgene induction. Cells were transduced with pTRIPZ‐OTUD6B‐IF1 and selected for vector expression using puromycin. Next, cells were infected as indicated with shCtrl or shOTUD6B‐3, which binds in the 3'UTR of the gene, and either left untreated (DMSO) or OTUD6B‐transgene expression induced by doxycycline addition (DOX, 1 μg/ml) the day after infection. Cell numbers were assessed by trypan‐blue exclusion method 4 days after infection. Cell numbers are depicted as fold of DMSO with mean ± s.d from three independent experiments.
- G
Representative immunoblot analysis of WCE from cells collected at the time of proliferation analysis described in (F) using the indicated antibodies.
- A
Proliferation analysis of A549‐Cas9 cells infected with indicated sgRNAs. The ratio of sgRNA expressing (GFP+) to uninfected cells was measured by flow cytometry at the indicated time points after infection. Results are normalized to GFP+ cells at day 4 (n = 3 independent experiments).
- B
Two‐dimensional cell cycle analysis of A549 lung adenocarcinoma cells expressing the indicated shRNAs analysed by BrdU/PI staining. Data from one representative experiment are depicted as graphs of BrdU positive cells versus PI/DNA staining.
- C
Quantitative cell cycle analysis of A549 cells expressing the indicated shRNAs for 5 days by BrdU/PI flow cytometry as depicted in (B) (n = 3 independent experiments).
- D
Quantification of OTUD6B activity from three independent experiments as depicted in Fig 1F. Optical densities were measured using the LICOR image studio lite software. Values are depicted as fold of OTUD6B‐signal in G1/S arrested cells from three independent experiments.
- E
DUB activity assay for OTUD6B in asynchronous, G1/S‐ or mitotically synchronized RPMI8226 cells using HA‐ubiquitin vinyl‐sulfone to isolate active forms of DUBs followed by HA‐IP. Analysis was performed by immunoblotting using the indicated antibodies.

- A
Silver‐stain analysis of FLAG‐purified OTUD6B. HEK293T were transfected with either FLAG‐EV or FLAG‐OTUD6B isoform 1 (IF1). FLAG‐OTUD6B was immunoprecipitated from WCE using FLAG M2 beads and subsequently eluted by 3x FLAG peptide. 1% of the purification was separated by SDS‐PAGE and proteins visualized by silver staining. The arrowhead points to the band at the expected size of OTUD6B.
- B
Silver‐stained gel of BioID2 purified proteins. HEK293T cells were transfected with MYC‐tagged‐BioID2 alone or BioID2‐OTUD6B‐isoform‐1 (IF1) or ‐2 (IF2) fusion proteins, incubated with 50 μM biotin for 16 h and biotinylated proteins purified for MS‐analysis. Non‐transfected cells served as a control. The arrowheads point to the bands at the expected sizes of BioID2 alone, BioID2‐OTUD6B‐IF1 and ‐IF2.
- C
Results of mass spectrometric (MS) based screening for OTUD6B substrates correlating the results from the FLAG‐ and the Bio‐ID‐purification (A, B) as shown in Fig 2A. Intensities (LFQs) of co‐immunoprecipitated proteins identified by MS were log2 transformed and the differences between OTUD6B and EV analyzed in both purifications. Proteins identified in both FLAG‐IP‐samples and enriched more than two‐fold in both independent screens are listed. OTUD6B (bait) is marked in red and LIN28B in orange.
- D
Co‐Immunoprecipitation (IP) of FLAG‐tagged DUBs and endogenous LIN28B from HEK293T cells. IPs and WCE were analyzed by immunoblotting with the indicated antibodies.
- E
Co‐IP of endogenous OTUD6B with FLAG‐LIN28B.
- F
Co‐IP of endogenous LIN28B with FLAG‐OTUD6B‐IF1 and FLAG‐OTUD6B‐IF2.

- A
Results of mass spectrometric (MS) based screening for OTUD6B substrates correlating the results from a FLAG‐ and a Bio‐ID‐purification. Intensities (LFQ) of co‐immunoprecipitated proteins identified by MS were log2 transformed and the differences between OTUD6B and EV plotted against LFQ intensities of proteins identified in the OTUD6B sample. The red dotted line represents the cut off for two‐fold enrichment in the OTUD6B sample compared with control. Proteins enriched more than two‐fold in the BioID‐proximity screen are highlighted in green. OTUD6B (bait) and LIN28B are depicted in red.
- B
In vivo ubiquitylation analyses of LIN28B in HEK293T cells in which OTUD6B was silenced by siRNA. Cells were transfected with the indicated siRNAs and overexpression constructs, then treated with MG132 for 3 h. Lysis and IP was done under denaturing conditions followed by WB analysis.
- C
In vivo ubiquitylation assay of LIN28B in OTUD6B and a catalytically inactive variant of OTUD6B (OTUD6B‐C158A) overexpressing cells. HEK293T cells were transfected with indicated combinations of FLAG‐LIN28B, HA‐Ubiquitin, OTUD6B, OTUD6B‐C158A and EV control and treated with MG132 for 3 h 24 h later. Denatured WCE were subjected to FLAG‐IP. WCE and IP were analyzed by immunoblotting including a K48‐specific ubiquitin antibody. Exemplary blots from three independent experiments are shown.
- D
Pull‐down of endogenous LIN28B from HEK293T WCE using bacterially purified GST‐OTUD6B. Pulldowns and WCE were analyzed by immunoblot using the indicated antibodies.
- E
Immunoblot analysis of an in vitro deubiquitylation assay using GST‐purified OTUD6B from bacteria and FLAG‐purified ubiquitylated LIN28B from HEK293T. FLAG‐IP was performed under denaturing conditions from HEK293T WCEs expressing FLAG‐LIN28B and HA‐Ubiquitin. Purified FLAG‐LIN28B was eluted from the beads and incubated with GST or GST‐OTUD6B proteins followed by immunoblot analysis.

- A
In vivo ubiquitylation assay of LIN28B in OTUD6B overexpressing cells. HEK293T cells were transfected with indicated combinations of FLAG‐LIN28B, HA‐Ubiquitin, OTUD6B and EV control and treated with MG132 for 3 h 24 h later. Denatured WCE were subjected to FLAG‐IP. WCE and IP were analysed by immunoblotting.
- B
In‐vivo ubiquitylation analyses of LIN28B in HEK293T cells in which OTUD6B was silenced by siRNA using a K48‐only‐ubiquitin‐mutant. Cells were transfected with the indicated siRNAs and overexpression constructs, then treated with MG132 for 3 h. Lysis and IP was done under denaturing conditions followed by WB analysis.

- A
Co‐IP of FLAG‐OTUD6B with endogenous LIN28B from MM1.S cells synchronized in G1/S and 12 h post release. MM1.S cells stably expressing FLAG‐OTUD6B or FLAG‐EV were synchronized at G1/S and harvested at the indicated time points after release. IPs were performed and analyzed together with WCE by immunoblotting.
- B, C
Immunoblot analysis of LIN28B and OTUD6B protein levels throughout the cell cycle. RPMI (B) and A549 (C) cells were synchronized at the G1/S transition by a double thymidine block or in mitosis by a sequential thymidine/nocodazole block. Synchronized cells were released, harvested at the indicated time points and analyzed by immunoblot using the indicated antibodies.
- D
Immunoblot analysis of LIN28B protein half‐life in G1/S‐synchronized (upper panel) and asynchronous (lower panel) A549 cells upon OTUD6B depletion. Cells transfected with the respective siRNAs were synchronized at the G1/S transition or not and treated with cycloheximide (CHX) as indicated.

- A, B
Cell cycle analysis of MM1.S cells expressing the indicated shRNAs before and after G1‐release. Cells were synchronized in late G1‐phase using palbociclib and subsequently released for 12 hrs. DNA was stained with PI and analyzed by flow cytometry. (A) Exemplary FACS‐plots at 0 and 12 h post G1 release. (B) Quantification of three biologically independent experiments showing the percentage of cells that remained in G1‐phase after release (n = 3).
- C
Rescue experiment using MM1.S cells expressing the indicated shRNAs and doxycycline‐inducible constructs of either RFP (EV) or LIN28B in which cell cycle analysis was performed before and after G1/S‐release. MM1.S cells stably expressing doxycycline inducible RFP or LIN28B were transduced with either shCtrl or shOTUD6B. Cells were then synchronized at G1/S and transgene expression induced by doxycycline. DNA‐content was analyzed before and 8 h after G1/S‐release by PI staining and flow cytometry. Values are normalized to cells at G1/S before release. (n = 3 independent experiments).
- D
Immunoblot analysis of WCE obtained from a representative experiment depicted in (C).
- E
18F‐FDG‐PET/CT analysis of NOD.CB17/AlhnRj‐Prkdc scid /Rj mice subcutaneously transplanted with human RPMI8226 cells expressing the indicated shRNAs (left two panels) and exemplary images of explanted tumors (right panel). At week 3–4 after transplantation, 5–10 MBq 18F‐FDG was administered intravenously and a 15‐min static image was acquired 45 min after injection for each mouse.
- F
Metric tumor weight (left) and tumor volume (right) of the tumors derived from mice described in (E) after necropsy (n = 8 tumors shCtrl, n = 4 tumors shOTUD6B, n = 4 tumors shLIN28B).
- G
Immunohistopathology of representative tumors derived from sacrificed mice in (E) to visualize morphology (H&E), and expression of the indicated proteins. Scale bars, 100 μm.

- A
GSEAs showing an enrichment of MYC V1 target genes in RPMI8226 MM cells depleted of OTUD6B and LIN28B when compared with control cells. RPMI8226 cells expressing the indicated shRNAs from three independent experiments were subjected to RNA‐seq analysis followed by GSEA.
- B
Heat map of MYC‐regulated genes which were commonly downregulated (P < 0.05) in OTUD6B and LIN28B knockdown cells compared with control cells in the RNA‐Seq experiment shown in (A) (n = 3).
- C
Immunoblot analysis of RPMI8226, KMS12BM and MM1.S cells expressing the indicated shRNAs. Depicted are examples of three independent experiments per cell line. Specification of MYC rearrangements: RPMI8226 (der(17)t(?8;17)(q21.2;q25)), KMS12BM (der(1;8)(q10;q10)x2), MM1.S (der3t(3;8)).
- D
Real‐time qPCR of RPMI8226 cells in which OTUD6B expression was silenced by the indicated shRNAs.
- E, F
Real‐time qPCR (E) and proliferation (F) analyses of RPMI8226 cells infected with the indicated shRNA constructs.
- A
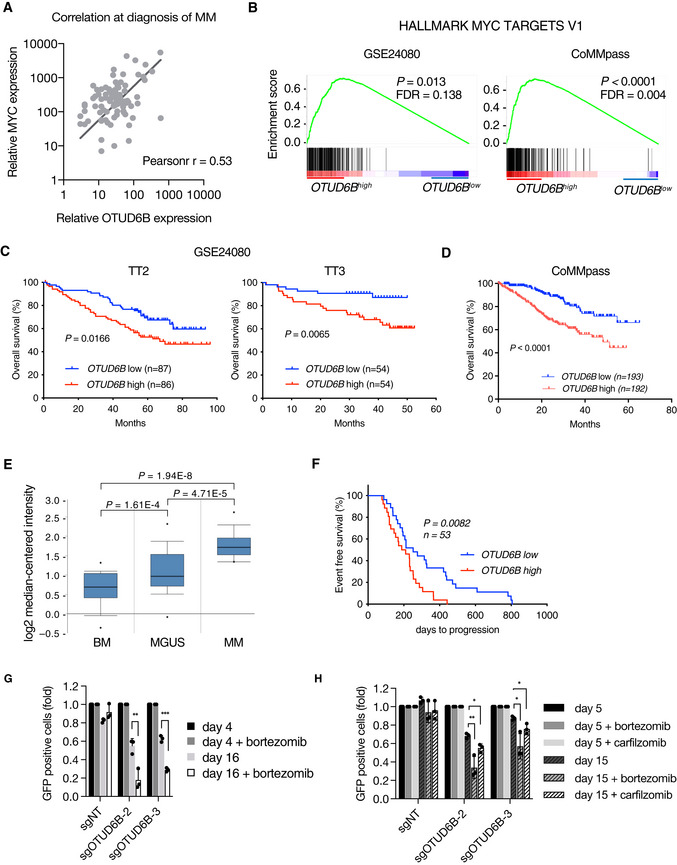
Correlation between MYC and OTUD6B expression in MM patient samples at diagnosis. mRNA expression in primary CD138+ MM cells was quantified by real‐time qPCR (n = 89 patients). Data are fit by linear regression (black line); Pearson r, Pearson correlation coefficient; P < 0.0001; by linear regression and Pearson correlation.
- B
GSEAs showing an enrichment of MYC target genes in MM patients with high OTUD6B expression in two independent data sets (Left: GSE24080; Right CoMMpass‐cohort – dbGaP accession: phs000748.v4.p3).
- C, D
Kaplan–Meier survival curves of MM patients with high or low OTUD6B expression. Patients from the upper and lower quartiles of the two cohorts comprising the GSE24080 dataset (n = 176 for TT2 and n = 108 for TT3) (C) and the CoMMpass cohort (n = 385) (D) described in (B) were taken for analysis. P values calculated by Log‐rank test.
- E
Data from Zhan et al (2007) reanalyzed to show expression levels of OTUD6B in normal bone marrow (BM; n = 22), monoclonal gammopathy of undetermined significance (MGUS; n = 44) and multiple myeloma (MM; n = 12). Box‐and‐whisker plots show the upper and lower quartiles (25–75%) with a line at the median, whiskers extend from the 10th to the n percentile, and dots correspond to minimal and maximal values.
- F
Kaplan–Meier curves for EFS of bortezomib treated MM patients with high or low OTUD6B expression. Patients classified as bortezomib responders (R) in the GSE9782 dataset were grouped according to their OTUD6B expression (highest and lowest 30%; n = 53) and analyzed for event free survival. P values calculated by Log‐rank test.
- G, H
Proliferation analysis of (G) LP‐1‐Cas9 and (H) MM1.S‐Cas9 cells infected with indicated sgRNAs cultured without or with a sub‐lethal dose of bortezomib (LP1: 7 nM; MM1.S: 12.5 nM) or carfilzomib (for MM1.S only. Sub‐lethal dose of 5 nM). The ratio of sgRNA expressing (GFP+) cells to uninfected cells was measured by flow cytometry at the indicated time points after infection. Results are normalized to GFP+ cells at day 4 (n = 3 independent experiments). Values represent mean ± s.d.

References
-
- Baumann U, Fernandez‐Saiz V, Rudelius M, Lemeer S, Rad R, Knorn AM, Slawska J, Engel K, Jeremias I, Li Z et al (2014) Disruption of the PRKCD‐FBXO25‐HAX‐1 axis attenuates the apoptotic response and drives lymphomagenesis. Nat Med 20: 1401–1409 - PubMed
-
- Cheng J, Guo J, North BJ, Wang B, Cui CP, Li H, Tao K, Zhang L, Wei W (2019) Functional analysis of deubiquitylating enzymes in tumorigenesis and development. Biochim Biophys Acta Rev Cancer 1872: 188312 - PubMed
Publication types
MeSH terms
Substances
Associated data
- Actions
- Actions
LinkOut - more resources
Full Text Sources
Medical
Research Materials
