. 2022 Aug 19:13:982973.
doi: 10.3389/fimmu.2022.982973. eCollection 2022.

Integrative analyses of mRNA and microRNA expression profiles reveal the innate immune mechanism for the resistance to Vibrio parahaemolyticus infection in Epinephelus coioides

Affiliations

Integrative analyses of mRNA and microRNA expression profiles reveal the innate immune mechanism for the resistance to Vibrio parahaemolyticus infection in Epinephelus coioides

Xifeng Qiao et al. Front Immunol. .

Abstract

Vibrio parahaemolyticus, as one of the main pathogens of marine vibriosis, has brought huge losses to aquaculture. However, the interaction mechanism between V. parahaemolyticus and Epinephelus coioides remains unclear. Moreover, there is a lack of comprehensive multi-omics analysis of the immune response of grouper spleen to V. parahaemolyticus. Herein, E. coioides was artificially injected with V. parahaemolyticus, and it was found that the mortality was 16.7% in the early stage of infection, and accompanied by obvious histopathological lesions in the spleen. Furthermore, 1586 differentially expressed genes were screened by mRNA-seq. KEGG analysis showed that genes were significantly enriched in immune-related pathways, Acute-phase immune response, Apoptosis, Complement system and Cytokine-cytokine receptor interaction. As for miRNA-seq analysis, a total of 55 significantly different miRNAs were identified. Further functional annotation analysis indicated that the target genes of differentially expressed miRNAs were enriched in three important pathways (Phosphatidylinositol signaling system, Lysosome and Focal adhesions). Through mRNA-miRNA integrated analysis, 1427 significant miRNA-mRNA pairs were obtained and "p53 signaling pathway", "Intestinal immune network for IgA production" were considered as two crucial pathways. Finally, miR-144-y, miR-497-x, novel-m0459-5p, miR-7133-y, miR-378-y, novel-m0440-5p and novel-m0084-3p may be as key miRNAs to regulate immune signaling pathways via the miRNA-mRNA interaction network. The above results suggest that the mRNA-miRNA integrated analysis not only sheds new light on the molecular mechanisms underlying the interaction between host and V. parahaemolyticus but also provides valuable and new insights into resistance to vibrio infection.

Keywords: Epinephelus coioides; Vibrio parahaemolyticus; histopathological lesions; immune response; mRNA-seq; miRNA-seq.


Conflict of interest statement

The authors declare that the research was conducted in the absence of any commercial or financial relationships that could be construed as a potential conflict of interest.

Figures
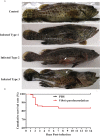
Figure 1
Figure 1
Clinical symptoms and cumulative survival of E. coioides challenged with V. parahaemolyticus. (A) The clinical symptoms of E. coioides challenged with V. parahaemolyticus. Infected Type 1: fish body color turned black; Infected Type 2: the swelling bleeding symptom was found near abdominal cloaca (white arrow notation); Infected Type 3: there was white patches near the dorsal fin (white arrow notation). (B) The cumulative survival of E. coioides infected with V. parahaemolyticus throughout two weeks. n = 60 biologically independent animals per group.
Figure 2
Figure 2
Spleen histopathology analyses of V. Parahaemolyticus artificially infected with E. coioides. (A–F) The spleen slice of E. coioides artificially infected with V. parahaemolyticus for 0 d (Control), 1 d, 2 d, 3 d, 1 w, 2 w. Representative images from at least three biological replicates of each time point of two groups.
Figure 3
Figure 3
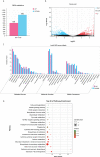
Identification and functional annotation of differentially expressed genes. (A) Histogram shows differentially expressed genes. Blue and red indicate decreased and increased expression, respectively. (B) Volcano map shows differentially expressed genes. The abscissa represents the fold change values of samples in control group/samples infected by V. parahaemolyticus, the vertical coordinate represents statistical test value [-lg (FDR)], the lower represent the more significant differences. Red dots represent up-regulated genes and blue dots represent down-regulated genes (FDR <0.05, |log2FC|>1), and black dots represent no significant difference genes. (C) GO enrichment analysis of DEGs. The abscissa indicates 3 GO categories with 39 GO terms, and the vertical coordinate indicates the number of unigenes. (D) KEGG pathway analysis of DEGs. The abscissa represents the ratio of DEGs to all genes annotated to the pathway and the vertical coordinate represents the pathways. The redder bubble indicates more obvious enrichment, with smaller Q-value. The larger bubble contains more differentially expressed genes. DEGs, differentially expressed genes; GO, Gene Ontology; KEGG, Kyoto Encyclopedia of Genes and Genomes.
Figure 4
Figure 4
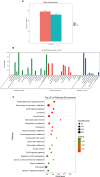
Identification and functional annotation of differentially expressed miRNAs. (A) Histogram shows differentially expressed miRNAs. Blue and pink indicate decreased and increased expression, respectively. (B) GO enrichment analysis of predicted target genes of DEMs. The abscissa indicates 3 ontologies (molecular function, cellular component and biological process) with 48 GO terms, the vertical coordinate indicates the genes count. (C) KEGG pathway analysis of target genes of DEMs. The redder bubble indicates more obvious enrichment, with smaller Q-value. Size of the point refers to the number of genes within each pathway. DEMs, differentially expressed miRNAs; DEGs, differentially expressed genes; GO, Gene Ontology; KEGG, Kyoto Encyclopedia of Genes and Genomes.
Figure 5
Figure 5
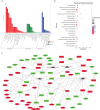
Functional annotation analysis of target DEGs of DEMs and network for miRNA-mRNA-Pathway interaction. (A) GO enrichment analysis of target DEGs of DEMs. The abscissa indicates 3 ontologies (molecular function, cellular component and biological process) with 39 GO terms, the vertical coordinate indicates the genes count. (B) KEGG pathway analysis of target DEGs of DEMs. The abscissa represents the ratio of the number of genes in the DEGs and the vertical coordinate represents the pathways. The redder bubble indicates more obvious enrichment, with smaller P-value. The larger bubble contains more target genes. (C) Network diagram for miRNA-mRNA-Pathway interaction. Ellipse represents miRNA, Round Rectangle represents mRNA, Triangle represents signaling pathway; Red color indicates up-regulated, blue color indicates down-regulated, gray color indicates no difference. DEGs, differentially expressed genes; DEMs, differentially expressed miRNAs; GO, Gene Ontology; KEGG, Kyoto Encyclopedia of Genes and Genomes.
Figure 6
Figure 6
Verification of the sequencing results using qRT-PCR analysis. (A) Relevant pattern recognition receptors, signal molecules and cytokines in mRNA-seq. The abscissa indicates the names of the DEGs, and the vertical coordinate represents the FPKM value. (B) Relevant pattern recognition receptors, signal molecules and cytokines were verified by qRT-PCR verification. The abscissa indicates the names of the DEGs, and the vertical coordinate represents the fold change. (C) Selected differential expressed miRNAs were detected in miRNA-seq. The abscissa indicates the names of the DEMs, and the vertical coordinate represents the TPM value. (D) Selected differential expressed miRNA were verified by qRT-PCR. The abscissa indicates the names of the DEMs, and the vertical coordinate represents the fold change.
Figure 7
Figure 7
Simplified overview of several pathways. (A) Simplified overview of Complement system pathway. (B) Simplified overview of Apoptosis pathway. (C) Simplified overview of Phosphatidylinositol signaling system pathway. The red box represents significantly enriched target genes. (D) Simplified overview of Lysosome pathway. The red box represents significantly enriched target genes. (E) Simplified overview of p53 signaling pathway. (F) Simplified overview of Intestinal immune network for IgA production pathway.

Similar articles

Cited by

References

    1. Yu X, Gao S, Xu J, Zhao Y, Lu Y, Deng N, et al. . The flagellin of vibrio parahaemolyticus induces the inflammatory response of tetraodon nigroviridis through Tlr5m. Fish Shellfish Immunol (2022) 120:102–10. doi: 10.1016/j.fsi.2021.10.024 - DOI - PubMed
    1. Daniels NA, MacKinnon L, Bishop R, Altekruse S, Ray B, Hammond RM, et al. . Vibrio parahaemolyticus infections in the united states, 1973–1998. J Infect Dis (2000) 181(5):1661–6. doi: 10.1086/315459 - DOI - PubMed
    1. Peng W, Lu DQ, Li GF, Zhang X, Yao M, Zhang Y, et al. . Two distinct interferon-gamma genes in tetraodon nigroviridis: Functional analysis during vibrio parahaemolyticus infection. Mol Immunol (2016) 70:34–46. doi: 10.1016/j.molimm.2015.12.004 - DOI - PubMed
    1. Paranjpye RN, Myers MS, Yount EC, Thompson JL. Zebrafish as a model for vibrio parahaemolyticus virulence. Microbiol (Reading) (2013) 159:2605–15. doi: 10.1099/mic.0.067637-0 - DOI - PubMed
    1. Zhang Q, Dong X, Chen B, Zhang Y, Zu Y, Li W. Zebrafish as a useful model for zoonotic vibrio parahaemolyticus pathogenicity in fish and human. Dev Comp Immunol (2016) 55:159–68. doi: 10.1016/j.dci.2015.10.021 - DOI - PubMed

Publication types