. 2022 Aug 9;25(9):104892.
doi: 10.1016/j.isci.2022.104892. eCollection 2022 Sep 16.

Substrate spectrum of PPM1D in the cellular response to DNA double-strand breaks

Affiliations

Substrate spectrum of PPM1D in the cellular response to DNA double-strand breaks

Justus F Gräf et al. iScience. .

Abstract

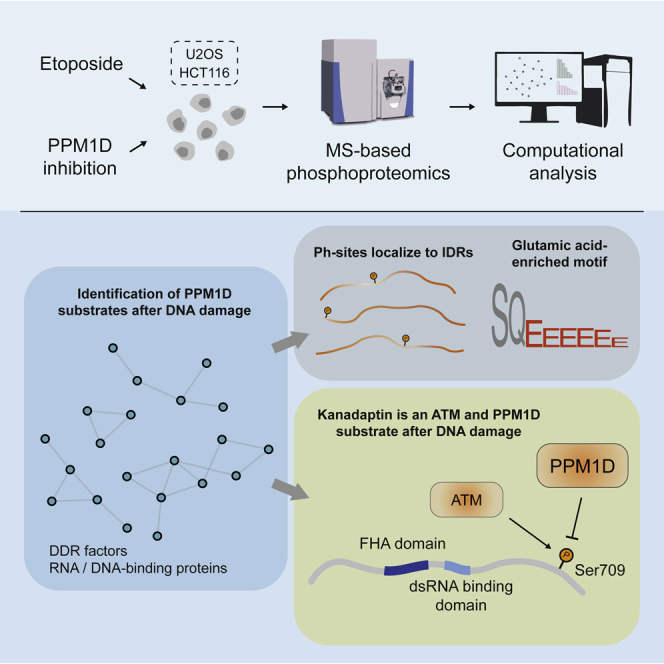
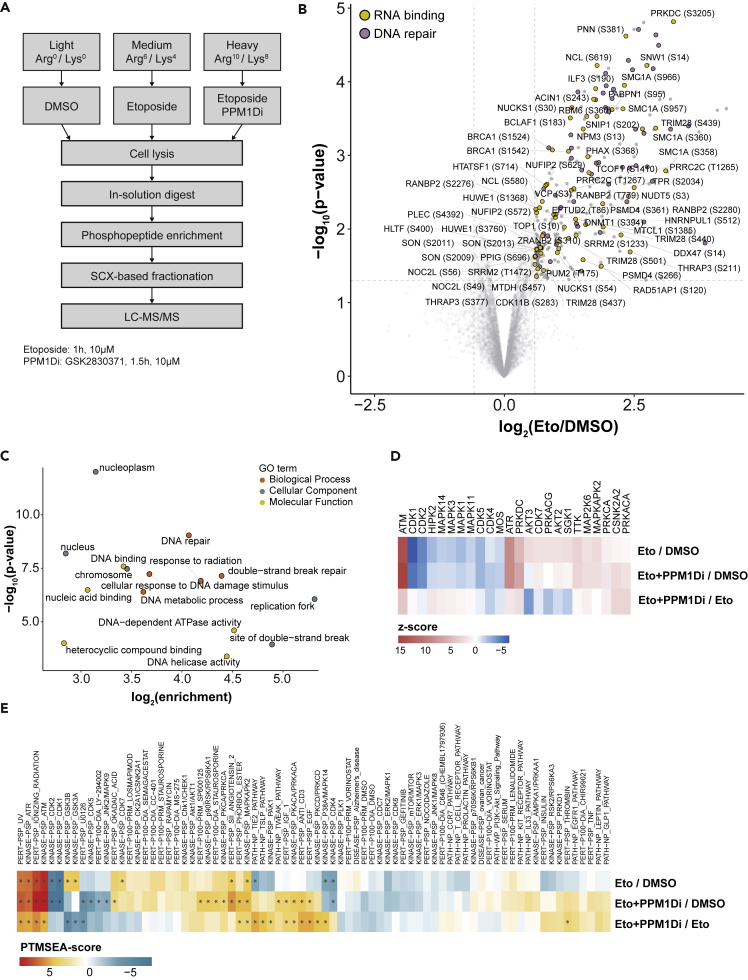
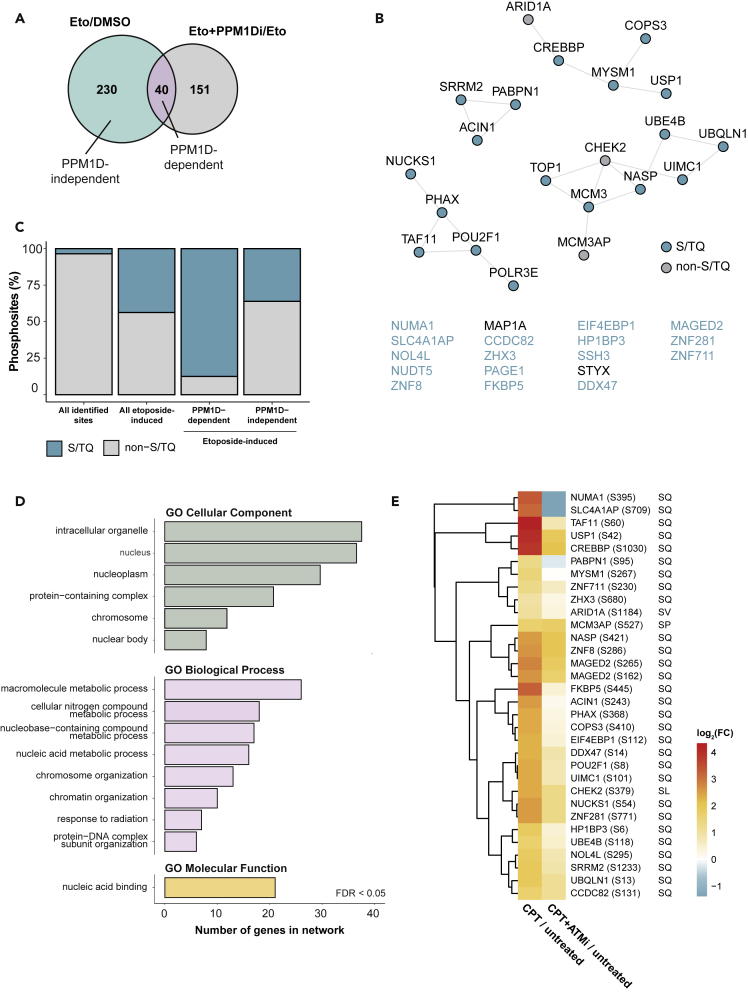
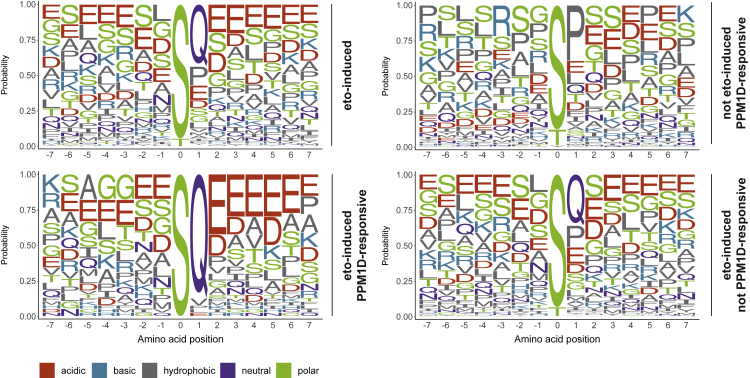
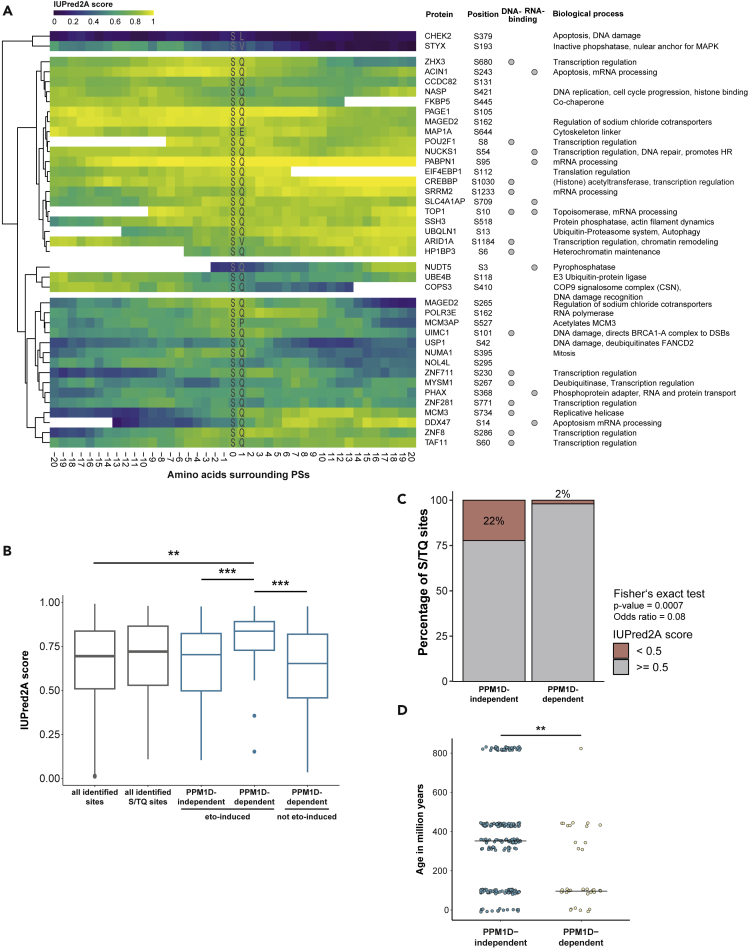
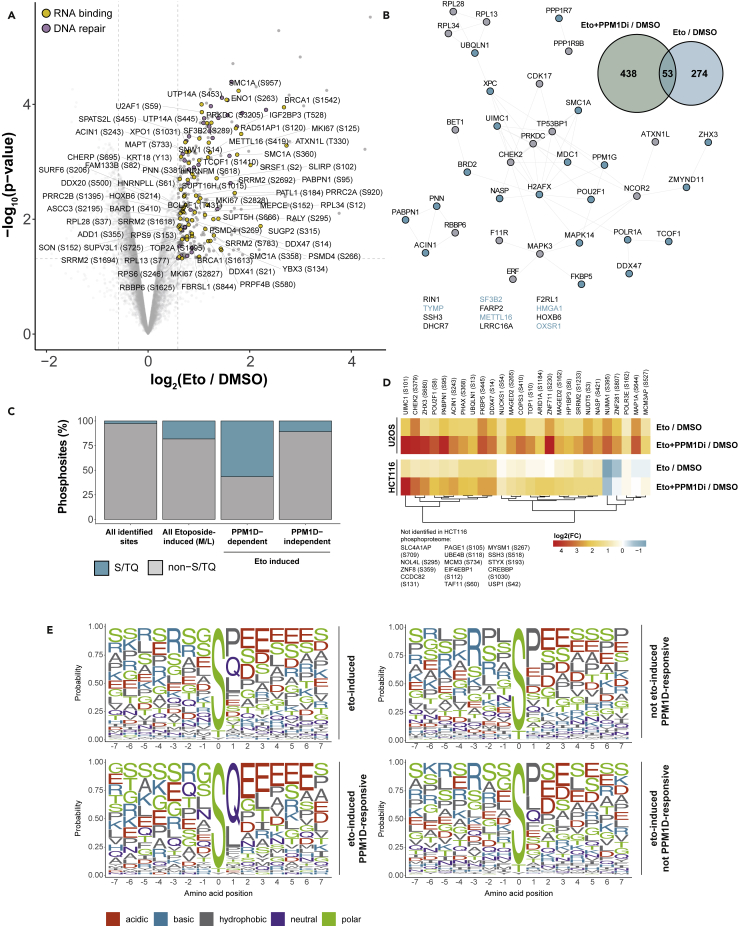
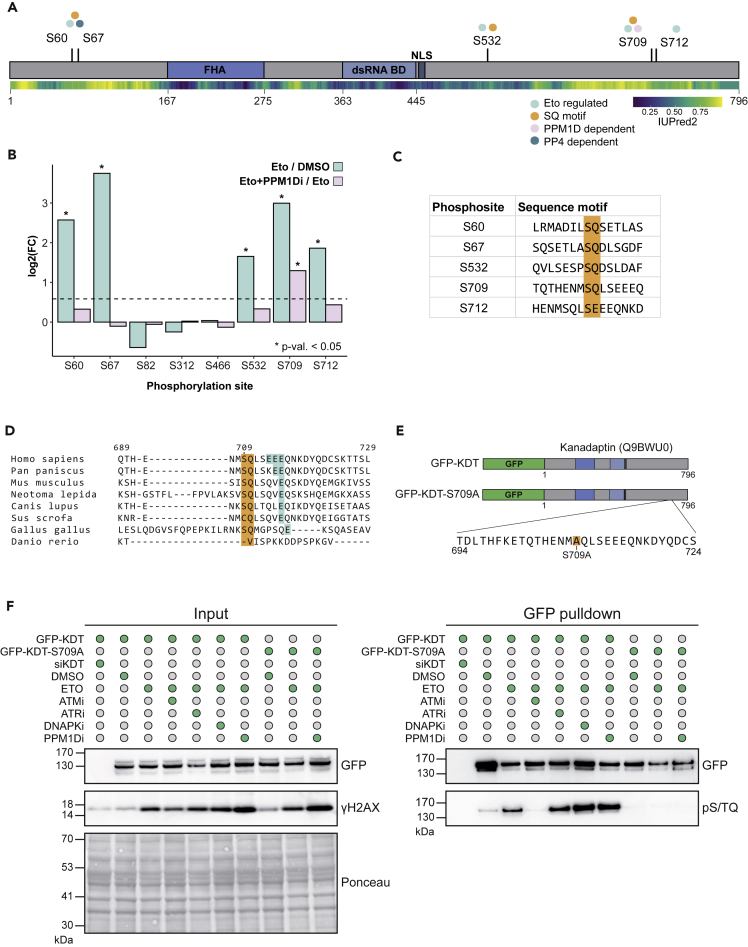
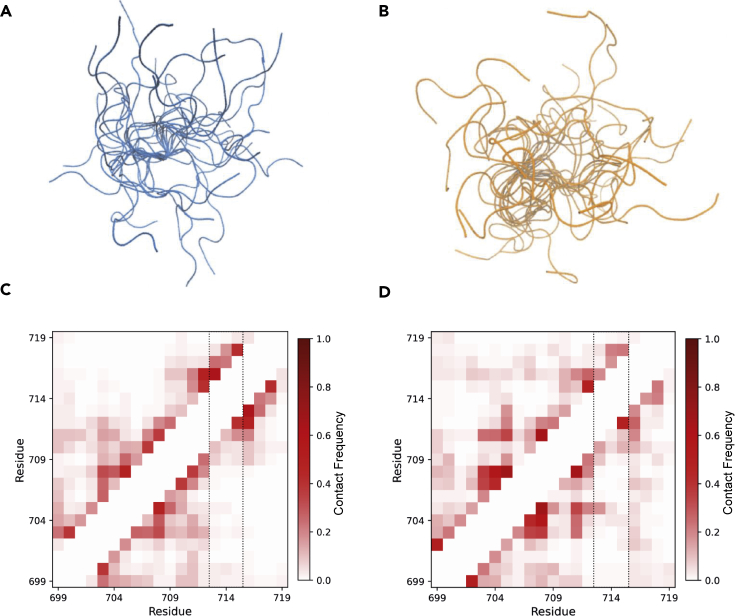
PPM1D is a p53-regulated protein phosphatase that modulates the DNA damage response (DDR) and is frequently altered in cancer. Here, we employed chemical inhibition of PPM1D and quantitative mass spectrometry-based phosphoproteomics to identify the substrates of PPM1D upon induction of DNA double-strand breaks (DSBs) by etoposide. We identified 73 putative PPM1D substrates that are involved in DNA repair, regulation of transcription, and RNA processing. One-third of DSB-induced S/TQ phosphorylation sites are dephosphorylated by PPM1D, demonstrating that PPM1D only partially counteracts ATM/ATR/DNA-PK signaling. PPM1D-targeted phosphorylation sites are found in a specific amino acid sequence motif that is characterized by glutamic acid residues, high intrinsic disorder, and poor evolutionary conservation. We identified a functionally uncharacterized protein Kanadaptin as ATM and PPM1D substrate upon DSB induction. We propose that PPM1D plays a role during the response to DSBs by regulating the phosphorylation of DNA- and RNA-binding proteins in intrinsically disordered regions.

Keywords: Biochemistry; cancer; molecular biology; proteomics.


Conflict of interest statement

The authors declare no competing interests.

Figures

None
Graphical abstract
Figure 1
Figure 1
Phosphoproteomic analysis of the etoposide-induced and PPM1D-dependent DNA damage response (A) Schematic representation of the strategy used for phosphoproteomic analysis. Light-, medium- or heavy-labeled U2OS cells were treated either with DMSO, with 10μM etoposide for 1h or with 10μM PPM1D inhibitor for 1.5h followed by etoposide treatment. Cells were lysed and digested using trypsin followed by TiO2-based phosphopeptide enrichment and LC-MS/MS analysis. The experiment was performed in triplicates. (B) Volcano plot showing upregulated phosphorylation sites after etoposide treatment (fold change (FC) > 1.5, moderated t-test: p value < 0.05). Phosphorylation sites on proteins mapping to the GO terms DNA repair and RNA binding are highlighted and RNA binding proteins are labeled. Phosphorylation sites with an FC below −2.5 are not shown. (C) GO term analysis of upregulated phosphorylation sites after etoposide treatment using ViseaGO R package (Fisher exact test: p value < 0.05). (D) Kinase-substrate enrichment analysis of etoposide-induced and PPM1D-dependent phosphorylation sites. Relative Z score indicates changes in kinase activities after indicated treatments (One-tailed probability test: p value < 0.05). (E) PTM set enrichment analysis showing phosphorylation site-specific pathways, perturbations, and kinase activities (Kolmogorov-Smirnov test: ∗ Benjamini-Hochberg adj. p value < 0.05).
Figure 2
Figure 2
PPM1D-dependent phosphoproteome after DSB induction (A) Etoposide-induced phosphorylation sites were overlapped with sites that show further increase after PPM1Di to determine PPM1D-dependent phosphorylation sites. (B) STRING interaction network (confidence score >0.4) of proteins containing etoposide-induced PPM1D-dependent phosphorylation sites. Sites with an S/TQ motif are annotated in blue. Proteins with no predicted interactions are listed at the bottom. (C) Fractions (%) of S/TQ motif abundance in all identified sites compared to the etoposide-induced, PPM1D-dependent, and PPM1D-independent subset. (D) GO term analysis of etoposide-induced PPM1D-dependent sites curated from the STRING database (FDR (Benjamini-Hochberg method) < 0.05). (E) Heatmap displaying log2-transformed FCs of 32 identified PPM1D substrates in response to CPT treatment and combination of CPT and ATMi. FCs were obtained from Balmus et al. (2019). Phosphorylated amino acids and the +1 residue are annotated for each site.
Figure 3
Figure 3
PPM1D substrate motif after DNA damage Sequence motif analysis (+/−7 amino acids) of etoposide-induced and/or PPM1Di-responsive phosphorylation sites. Amino acid probabilities are plotted using the ggseqlogo R package.
Figure 4
Figure 4
DNA damage-induced PPM1D substrates are located in intrinsically disordered protein regions (A) Intrinsic disorder score (IUPred2A) of surrounding protein regions of etoposide- and PPM1D-dependent phosphorylation sites. IUPred2A score above 0.5 is considered as disorder. Known DNA- and RNA-binding motifs and biological processes of phosphorylated proteins are annotated. (B) Comparison of IUPred2A score of different subsets of etoposide- and PPM1D-targeted sites with S/TQ-motif sites and all identified phosphorylation sites from the phosphoproteome (T-test: ∗∗ p value < 0.001, ∗∗∗ p value < 0.0001). (C) Barplot showing the fraction of S/TQ sites with IUPred2A score <0.5 (not disordered) within PPM1D-dependent sites (upregulated in H/M condition) and PPM1D-independent sites (not upregulated in H/M condition) regardless of their regulation status after etoposide treatment. Fisher's exact test was carried out on the contingency table of S/TQ site counts in each subset. (D) Comparison of estimated phosphorylation site age (+/− 3 amino acids) based on ptmAge prediction of etoposide-induced and PPM1Di-responsive sites with etoposide-induced and PPM1D-independent sites (Cochran-Armitage trend test: ∗∗ p value < 0.001). Datapoints are jittered.
Figure 5
Figure 5
Phosphoproteomic analysis of PPM1D substrates after etoposide treatment in HCT116 cells (A) Volcano plot of phosphorylation sites after etoposide treatment (FC > 1.5, moderated t-test: p value < 0.05). Phosphorylation sites on proteins mapping to the GO terms DNA Repair and RNA binding are highlighted and RNA binding proteins are labeled. (B) Etoposide-induced site was overlapped with upregulated sites after combined etoposide and PPM1Di treatment compared to etoposide treatment. Network showing proteins containing the 53 overlapping phosphorylation sites (STRING conf. score >0.4). Sites containing an SQ motif are colored in blue and proteins without any known interaction partner in the network are shown below. (C) Fractions (%) of S/TQ motif abundance in all identified sites compared to the etoposide-induced, PPM1D-dependent, and PPM1D-independent subset. (D) Log2 fold changes in HCT116 screen of etoposide- and PPM1Di-induced phosphorylation sites from the U2OS screen. Sites that are not identified in the HCT116 screen are annotated aside. (E) Sequence motif analysis of sites belonging to the different subsets from the HCT116 screen. Amino acid probabilities are plotted using the ggseqlogo R package.
Figure 6
Figure 6
Kanadaptin is phosphorylated by ATM and dephosphorylated by PPM1D in response to DSBs (A) Scheme of human Kanadaptin (Q9BWU0) containing an FHA domain, SMART-predicted double-stranded RNA binding domain, and nuclear localization signal (NLS). Regulated phosphorylation sites after etoposide and PPM1Di treatment are annotated with their dependencies and SQ sites are indicated. Regulation by PP4 is predicted based on (Ueki et al., 2019) IUPred2A score is mapped to the protein and represents intrinsic disorder. (B) log2-transformed FCs of all Kanadaptin phosphorylation sites identified by phosphoproteomics (moderated t-test: ∗ p value < 0.05). (C) Amino acid environment of significantly upregulated Kanadaptin phosphorylation sites after DNA damage. (D) Multiple sequence alignment (ClustalW) of pS709/S712 motif. Phosphorylated serine +1 amino acid and downstream glutamic acid residues are highlighted. (E) Scheme of GFP tagged wt-Kanadaptin and phospho-dead (S709A) constructs. (F) GFP-Kanadaptin or GFP-Kanadaptin-S709A were transiently expressed in U2OS cells treated with 10μM etoposide for 1h, or additionally treated with ATMi (10μM), ATRi (2μM), PPM1Di (10μM), or DNAPKi (10μM) for 1.5h, or co-transfected with siRNA against Kanadaptin. GFP-Kanadaptin was pulled down followed by washes in 8M urea.
Figure 7
Figure 7
Conformational flexibility of (un)phosphorylated Kanadaptin SQ motif (A and B) Visualization of conformational ensembles of unphosphorylated and phosphorylated SQ motifs. Simulation structures were aligned on central amino acids M708 and S709. (C and D) Contacts in the simulation of unphosphorylated and phosphorylated SQ motifs. Contact maps show the frequency of contacts between pairs of residues in the MD simulation trajectories. Triple glutamate motif is highlighted with dashed lines.

References

    1. Bah A., Forman-Kay J.D. Modulation of intrinsically disordered protein function by post-translational modifications. J. Biol. Chem. 2016;291:6696–6705. doi: 10.1074/JBC.R115.695056. - DOI - PMC - PubMed
    1. Balmus G., Pilger D., Coates J., Demir M., Sczaniecka-Clift M., Barros A.C., Jackson S.P. ATM orchestrates the DNA-damage response to counter toxic non-homologous end-joining at broken replication forks. Nat. Commun. 2019;10:1–18. doi: 10.1038/s41467-018-07729-2. - DOI - PMC - PubMed
    1. Beli P., Lukashchuk N., Wagner S.A., Weinert B.T., Olsen J.V., Baskcomb L., Choudhary C. Proteomic investigations reveal a role for RNA processing factor THRAP3 in the DNA damage response. Mol. Cell. 2012;46:212–225. doi: 10.1016/j.molcel.2012.01.026. - DOI - PMC - PubMed
    1. Bensimon A., Koch J.P., Francica P., Roth S.M., Riedo R., Glück A.A., Orlando E., Blaukat A., Aebersold D.M., Zimmer Y., et al. Deciphering MET-dependent modulation of global cellular responses to DNA damage by quantitative phosphoproteomics. Mol. Oncol. 2020;14:1185–1206. doi: 10.1002/1878-0261.12696. - DOI - PMC - PubMed
    1. Best R.B., Hummer G. Optimized molecular dynamics force fields applied to the helix-coil transition of polypeptides. J. Phys. Chem. B. 2009;113:9004–9015. doi: 10.1021/JP901540T. - DOI - PMC - PubMed