. 2022 Aug 19:16:100405.
doi: 10.1016/j.mtbio.2022.100405. eCollection 2022 Dec.

A palette of site-specific organelle fluorescent thermometers

Affiliations

A palette of site-specific organelle fluorescent thermometers

Xiao Liu et al. Mater Today Bio. .

Abstract

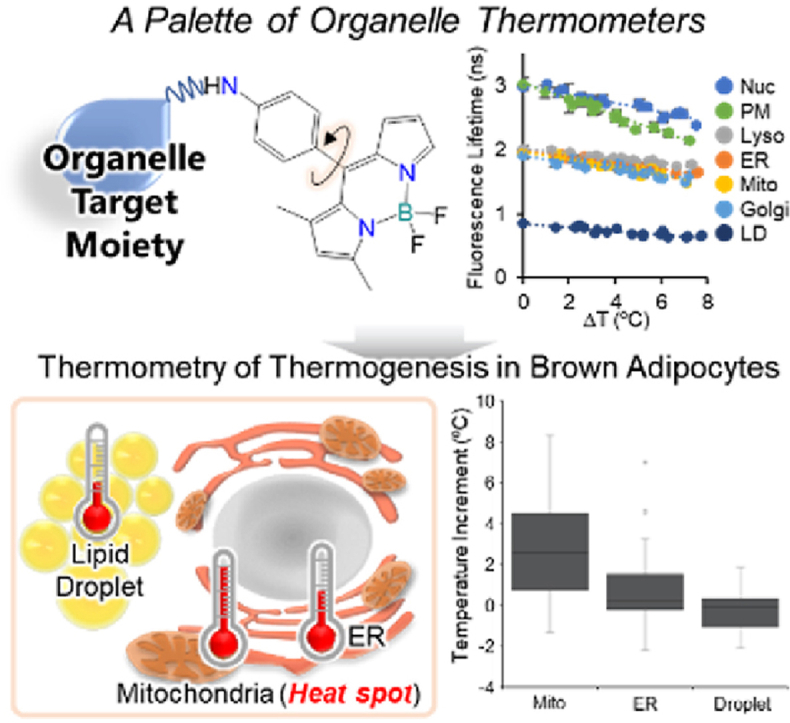
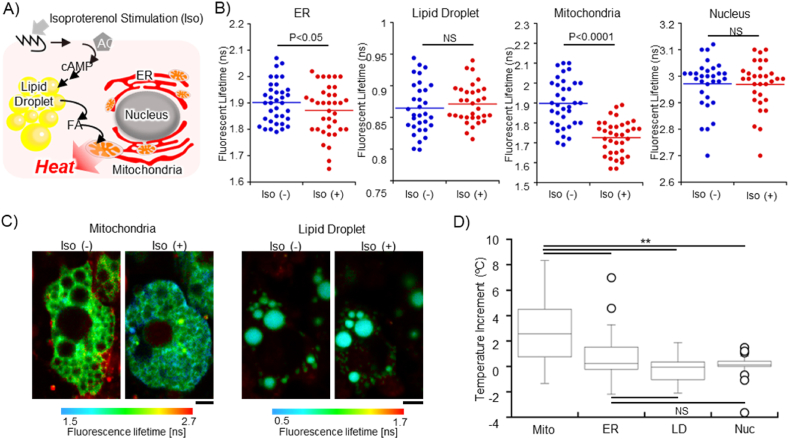
Intracellular micro-temperature is closely related to cellular processes. Such local temperature inside cells can be measured by fluorescent thermometers, which are a series of fluorescent materials that convert the temperature information to detectable fluorescence signals. To investigate the intracellular temperature fluctuation in various organelles, it is essential to develop site-specific organelle thermometers. In this study, we develop a new series of fluorescent thermometers, Thermo Greens (TGs), to visualize the temperature change in almost all typical organelles. Through fluorescence lifetime-based cell imaging, it was proven that TGs allow the organelle-specific monitoring of temperature gradients created by external heating. The fluorescence lifetime-based thermometry shows that each organelle experiences a distinct temperature increment which depends on the distance away from the heat source. TGs are further demonstrated in the quantitative imaging of heat production at different organelles such as mitochondria and endoplasmic reticulum in brown adipocytes. To date, TGs are the first palette batch of small molecular fluorescent thermometers that can cover almost all typical organelles. These findings can inspire the development of new fluorescent thermometers and enhance the understanding of thermal biology in the future.

Keywords: Fluorescence; Molecular rotor; Organelle; Temperature; Thermometers.


Conflict of interest statement

The authors declare that they have no known competing financial interests or personal relationships that could have appeared to influence the work reported in this paper.

Figures

Image 1
Graphical abstract
Scheme 1
Scheme 1
Molecular structures of Thermo Greens. ETG: ER Thermo Green; DTG: Lipid Droplet Thermo Green; MTG: Mitochondria Thermo Green; LTG: Lysosome Thermo Green; PTG: Plasma Membrane Thermo Green; GTG: Golgi Thermo Green; NTG: Nucleus Thermo Green.
Fig. 1
Fig. 1
Calibration curves of TGs in live cells. (A) FLIM images of TGs in HeLa cells (only DTG in brown adipocytes). Scale bars: 10 ​μm. (B) The evaluation of fluorescence lifetimes of TGs in live cells at base temperature (37 ​°C, ΔT ​= ​0). The line indicates the average of 10 ​cells. The statistical analysis was performed by Tukey's multiple comparisons. P ​< ​0.001: PTG vs. DTG, GTG, MTG, ETG, and LTG. NTG vs. DTG, GTG, MTG, ETG, and LTG. DTG vs. LTG, ETG, MTG, and GTG. LTG vs. GTG. p ​< ​0.05: LTG vs. MTG. NS: ETG vs. LTG, GTG, and MTG. PTG vs. NTG. MTG vs. GTG. (C) The calibration curves of fluorescence lifetime against temperature increments in HeLa cells and brown adipocytes (DTG). Each data point represents means ​± ​SD (n ​= ​19–20) obtained from the exponential curve fitting.
Fig. 2
Fig. 2
Visualization of temperature gradient created by an 808 ​nm laser. (A) Schematic illustration of a microscopic system where an 808 ​nm laser is coupled with a graphite flake to produce the local heat (left panel). The bright field and fluorescence images of NTG in HeLa cells were shown in the center panel. Scale bar: 20 ​μm. FLIM images of NTG were shown before and after heating (for each 30 ​s) at 11 ​mW. The temperature increments at different positions (ROI1-3) were analyzed from the calibration curve (fluorescence lifetime vs. ΔT). 1) 8.2 ​± ​0.5 ​°C, 2) 3.6 ​± ​0.4 ​°C, 3) 2.2 ​± ​0.5 ​°C. Scale bar: 10 ​μm. (B) Similar to NTG as shown in A), temperature gradients generated by an 808 ​nm laser illumination were imaged in HeLa cells using the other TGs (only DTG in BAT). The temperature increments at different positions (ROI 1–2) were analyzed from the calibration curve. PTG: 1) 4.9 ​± ​0.4 ​°C, 2) 1.7 ​± ​0.5 ​°C, LTG: 1) 8.1 ​± ​0.6 ​°C, 2) 6.3 ​± ​0.4 ​°C, ETG: 1) 6.3 ​± ​0.6 ​°C, 2) 4.3 ​± ​0.8 ​°C, MTG: 1) 6.8 ​± ​0.4 ​°C, 2) 2.6 ​± ​0.4 ​°C, GTG: 1) 7.5 ​± ​0.4 ​°C, 2) 5.8 ​± ​0.4 ​°C, DTG: 1) 5.8 ​± ​0.3 ​°C, 2) 2.1 ​± ​0.4 ​°C. Scale bars: 10 ​μm.
Fig. 3
Fig. 3
Thermal imaging of heat production in brown adipocytes using FLIM. (A) Schematic illustration of heat production in brown adipocytes. (B) The FLIM analysis of the change in fluorescence lifetime upon the addition of isoproterenol (Iso). The data set was analyzed by paired t-test at ER (p ​= ​0.0357), Lipid Droplet (NS), Mitochondria (p ​< ​0.0001), and Nucleus (NS). (C) Visualization of heat production at mitochondria and lipid droplet of brown adipocyte. Scale bar: 5 ​μm. (D) The box plot of the temperature increment at each organelle, analyzed by Tukey's multiple comparisons. The temperature increment was obtained from the same data set with (B) and the calibration curve. Mito, ER, LD and Nuc represent Mitochondria, Endoplasmic Reticulum, Lipid droplet and Nucleus, respectively. The line indicates the median. ∗∗p ​< ​0.001. The number of ROIs is 31–36 (the number of cells is 19–29).

Similar articles

Cited by

References

    1. Westerterp-Plantenga M.S., van Marken Lichtenbelt W.D., Strobbe H., Schrauwen P. Energy metabolism in humans at a lowered ambient temperature. Eur. J. Clin. Nutr. 2002;56:288–296. - PubMed
    1. Clarke A., Fraser K.P.P. Why does metabolism scale with temperature? Funct. Ecol. 2004;18:243–251.
    1. Bag N., Yap D.H.X., Wohland T. Temperature dependence of diffusion in model and live cell membranes characterized by imaging fluorescence correlation spectroscopy. Biochim. Biophys. Acta. 2014;1838:802–813. - PubMed
    1. Harding R.L., Halevy O., Yahav S., Velleman S.G. The effect of temperature on proliferation and differentiation of chicken skeletal muscle satellite cells isolated from different muscle types. Phys. Rep. 2016;4 - PMC - PubMed
    1. Kiyonaka S., Kajimoto T., Sakaguchi R., Shinmi D., Omatsu-Kanbe M., Matsuura H., Imamura H., Yoshizaki T., Hamachi I., Morii T., Mori Y. Genetically encoded fluorescent thermosensors visualize subcellular thermoregulation in living cells. Nat. Methods. 2013;10:1232–1238. - PubMed

LinkOut - more resources