. 2022;117(538):678-692.
doi: 10.1080/01621459.2020.1799812. Epub 2020 Sep 16.

Inferring Phenotypic Trait Evolution on Large Trees With Many Incomplete Measurements

Affiliations

Inferring Phenotypic Trait Evolution on Large Trees With Many Incomplete Measurements

Gabriel Hassler et al. J Am Stat Assoc. 2022.

Abstract

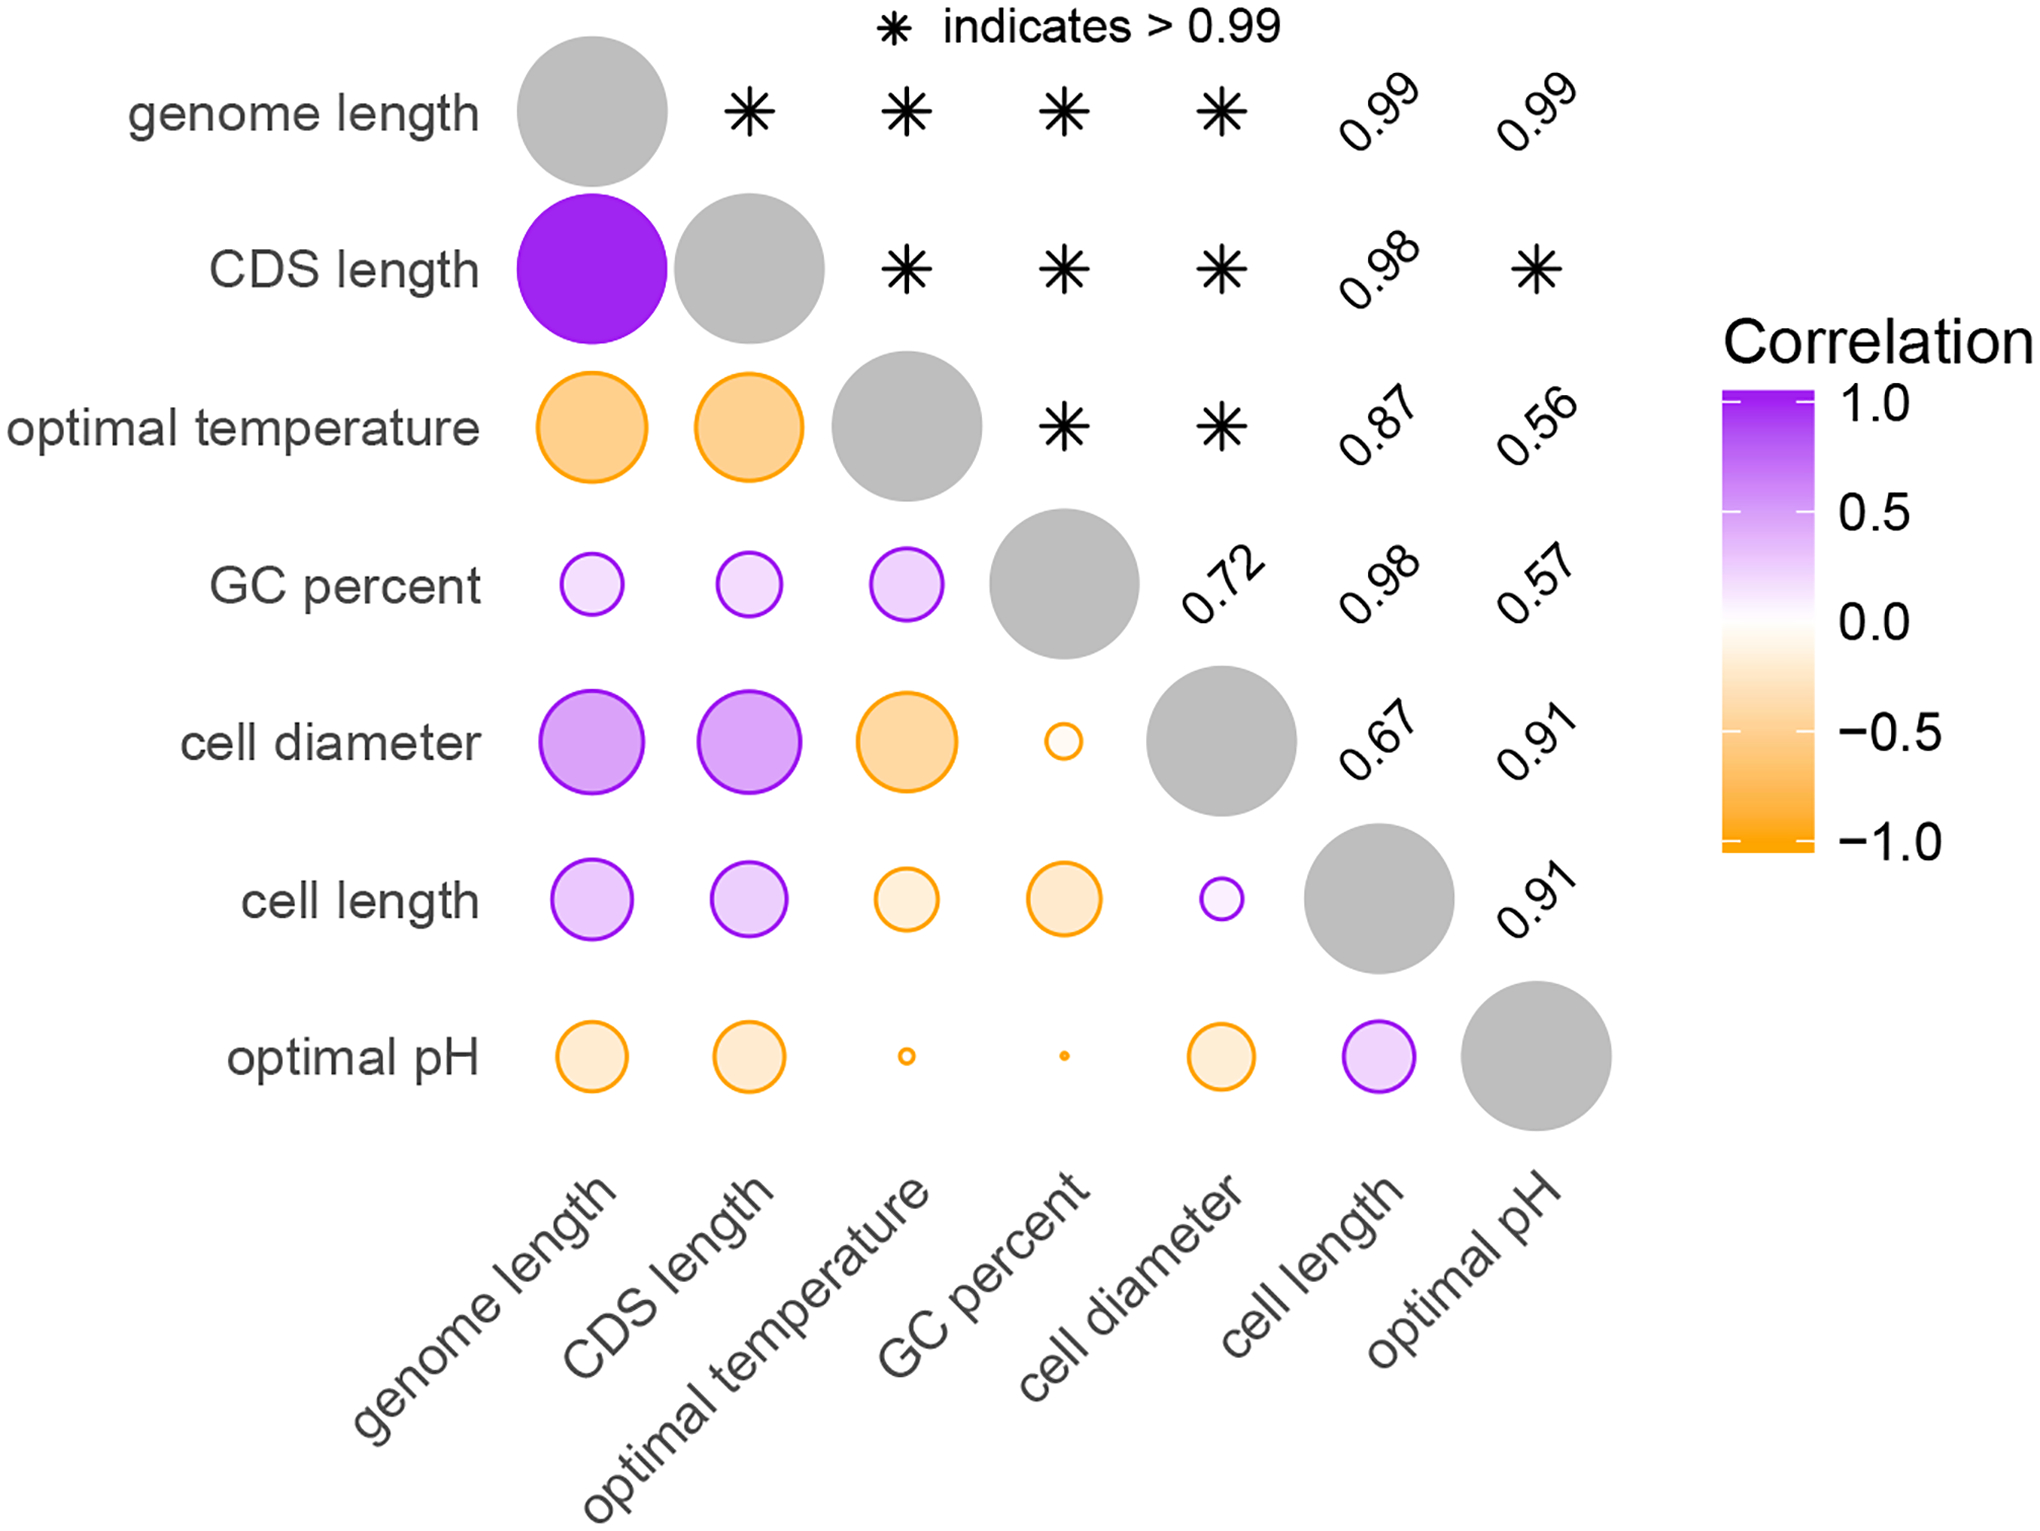
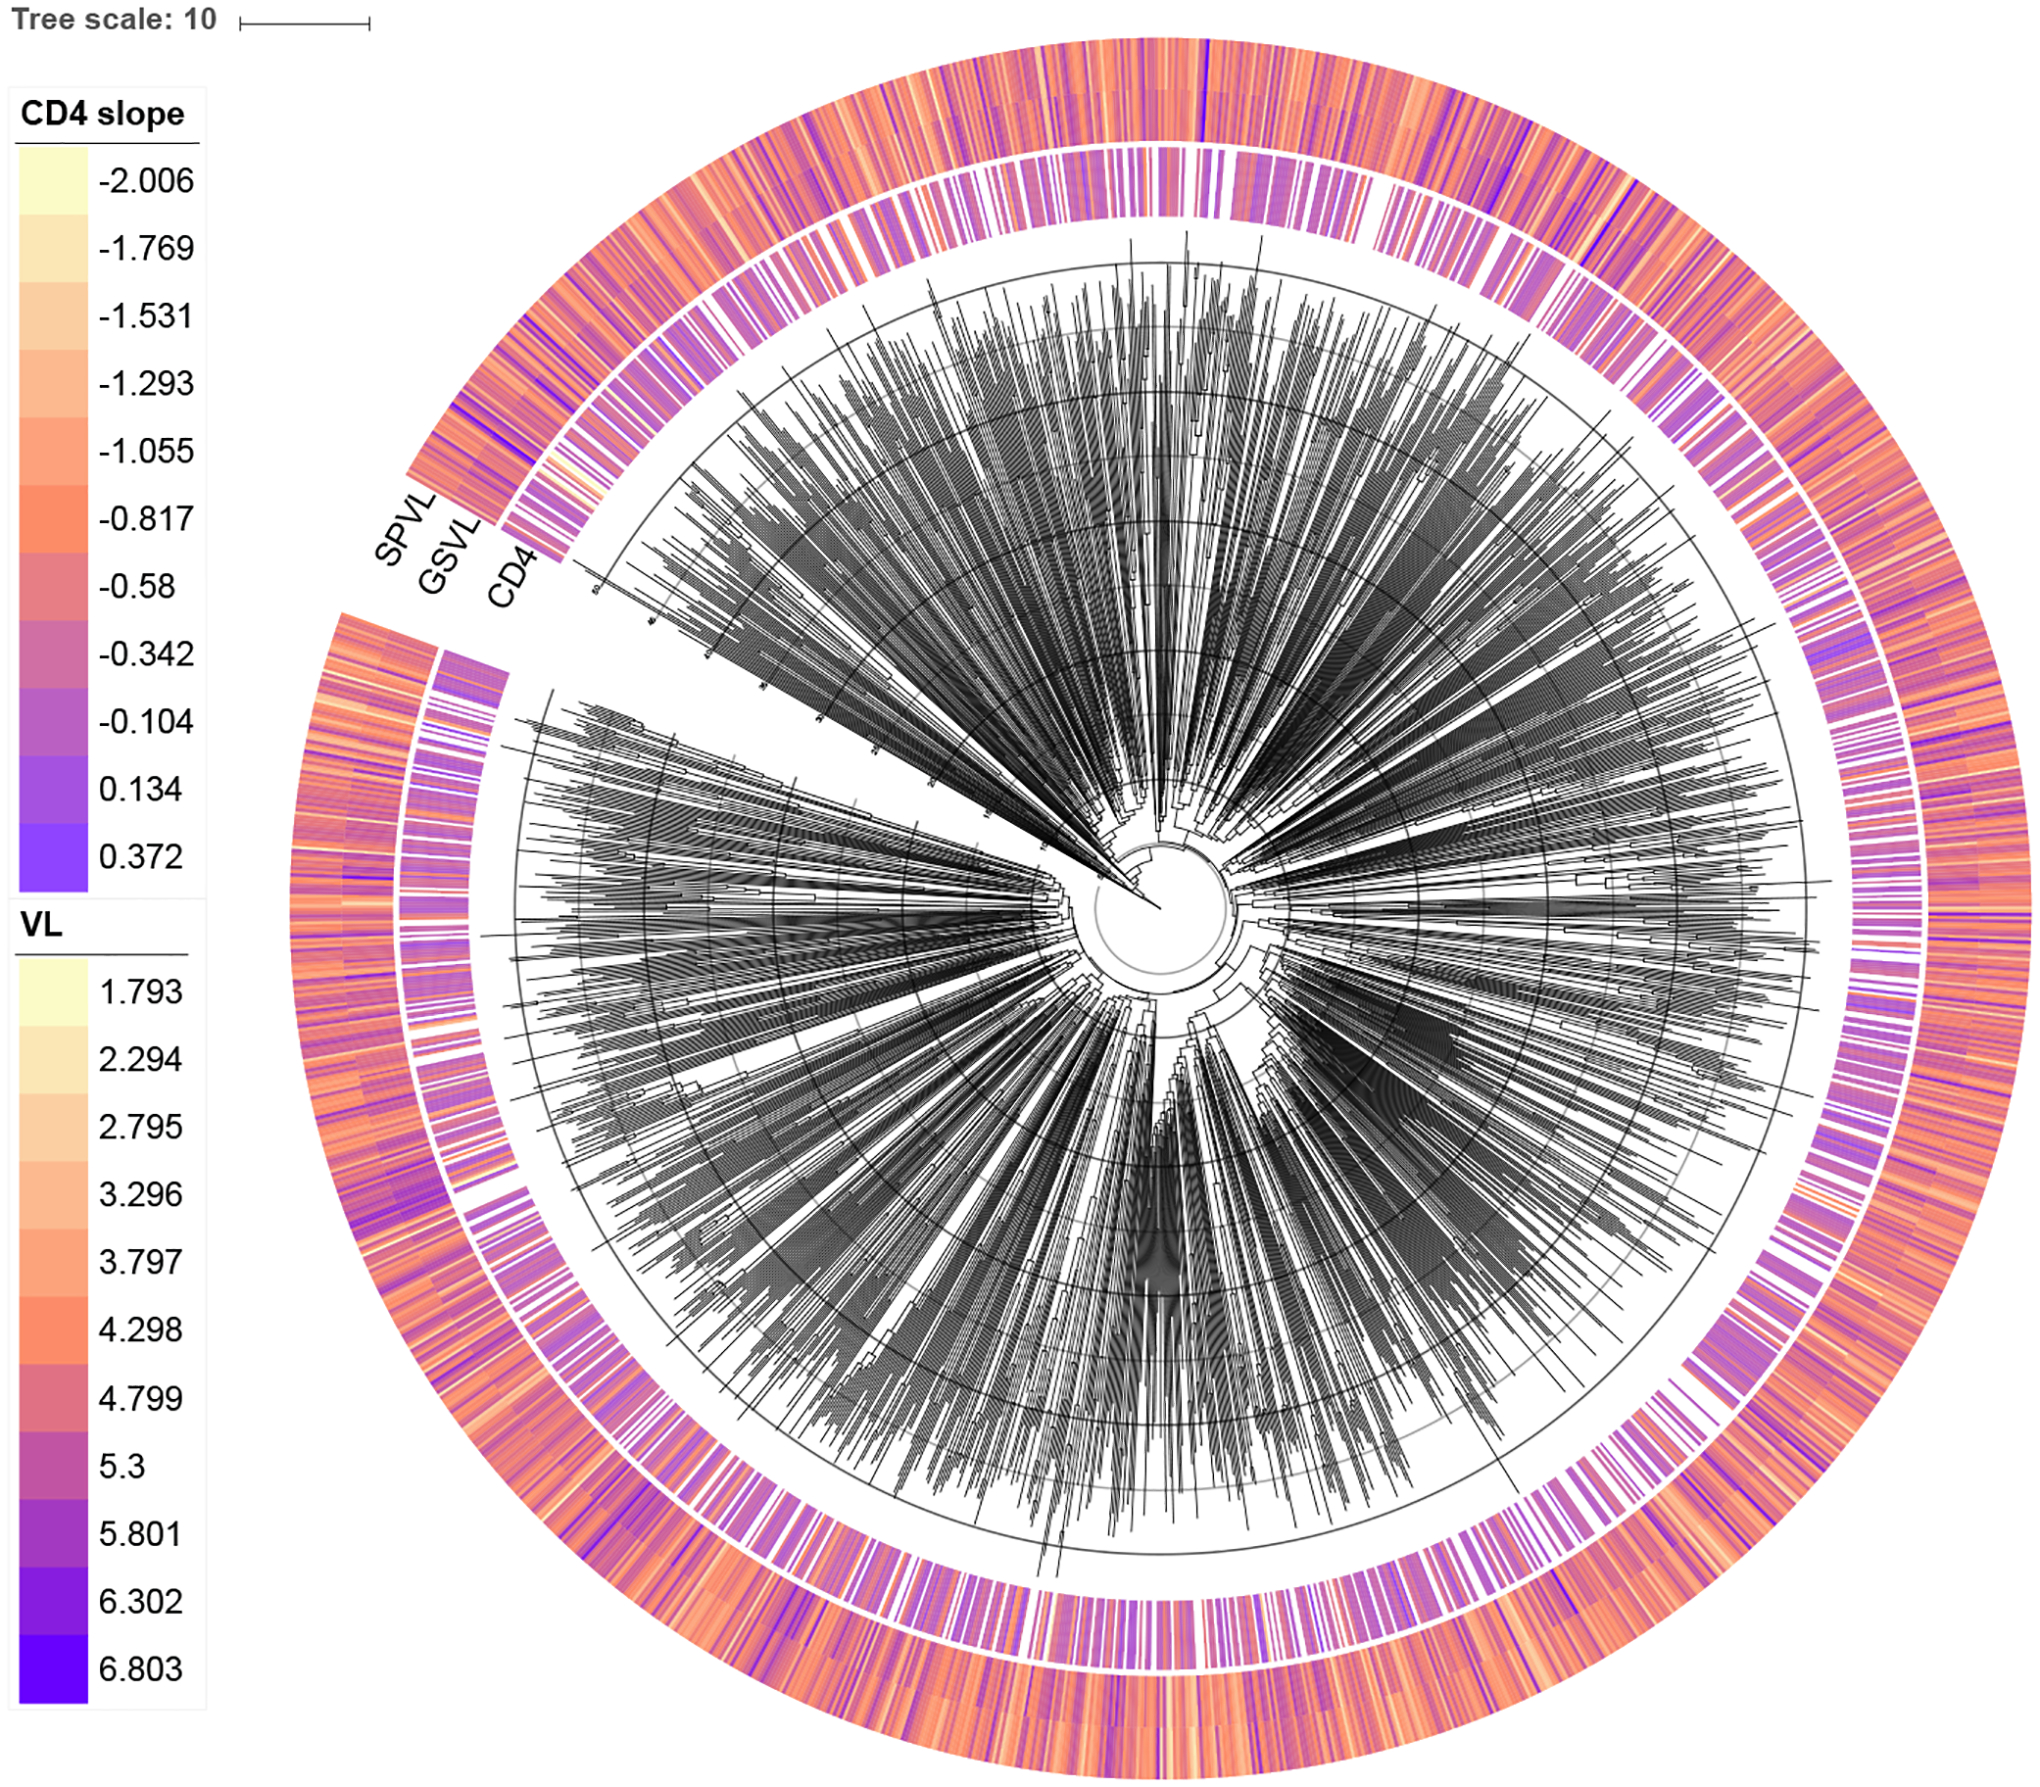
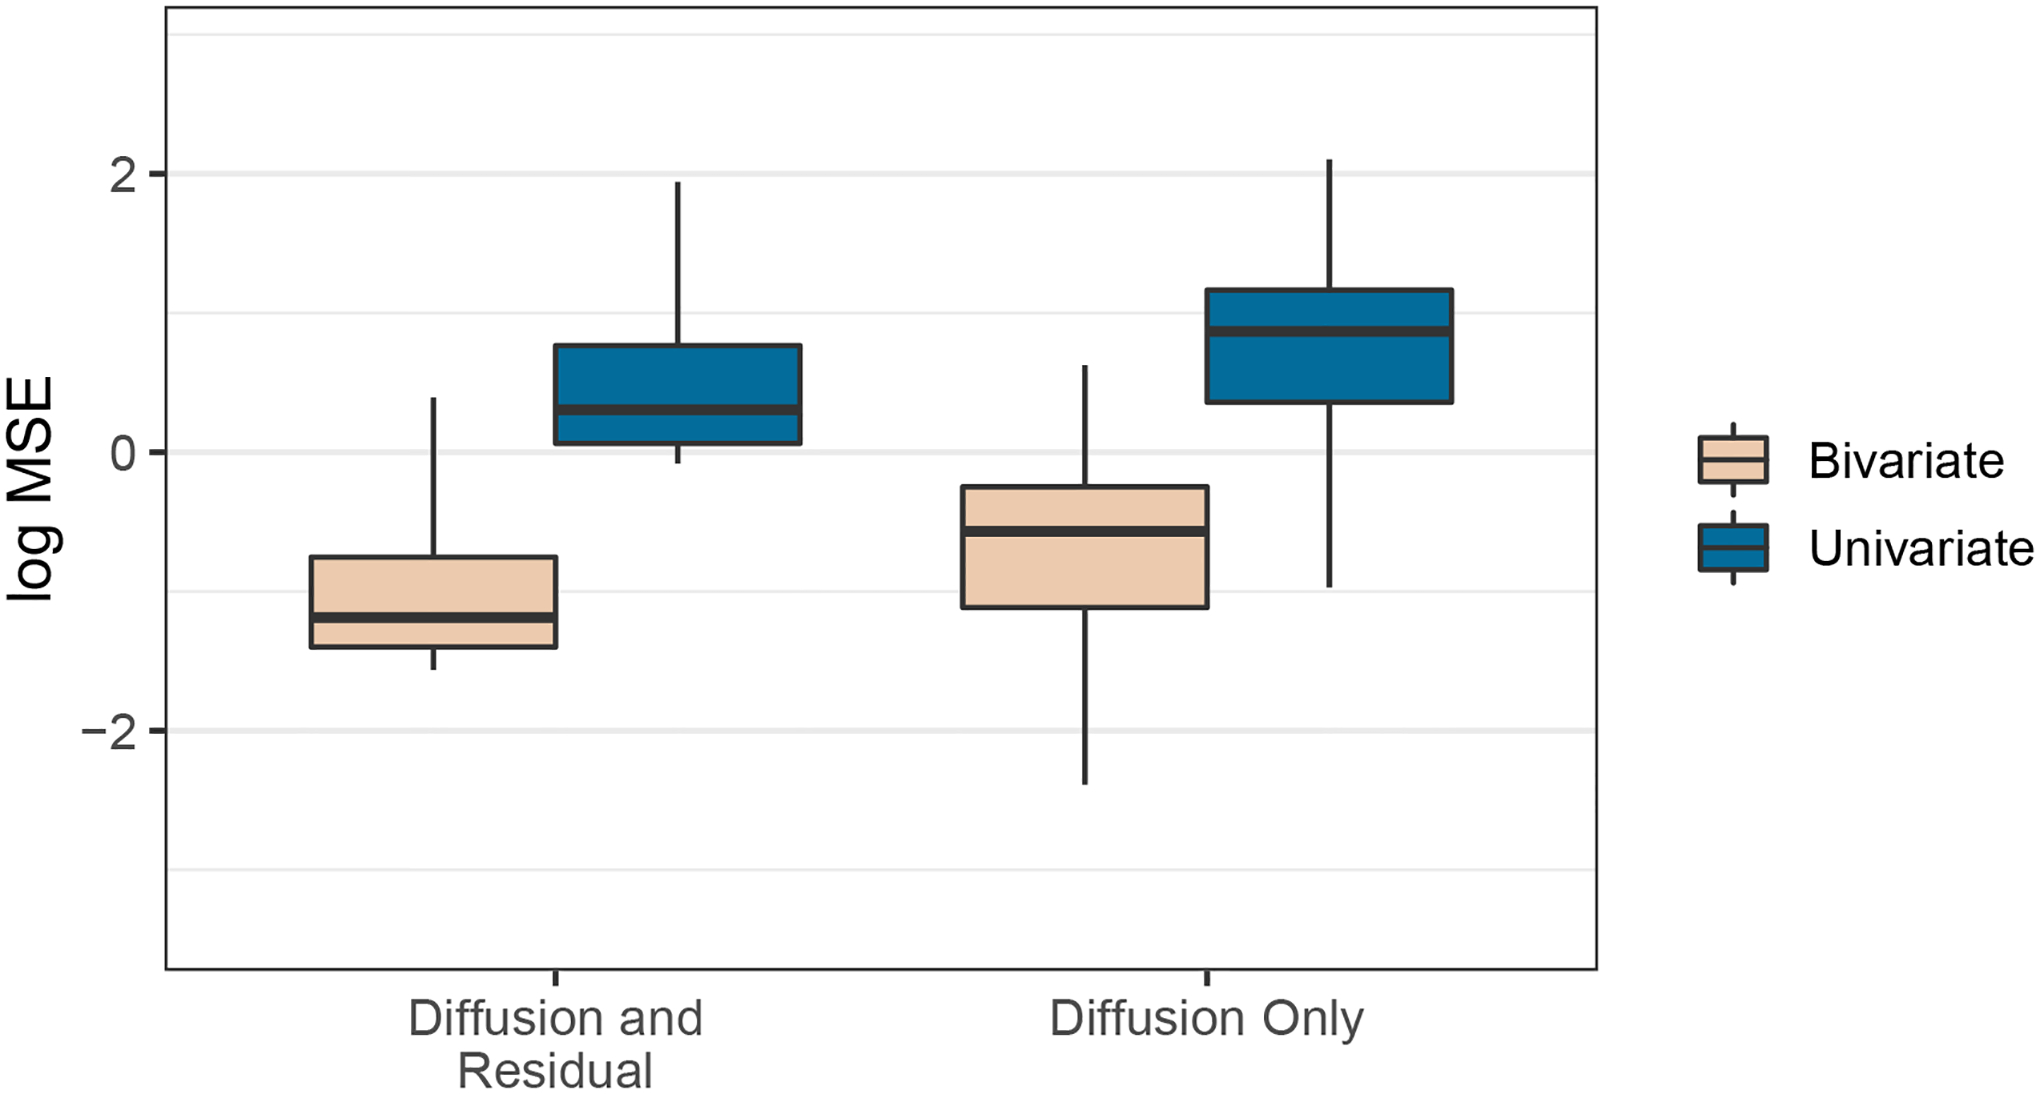
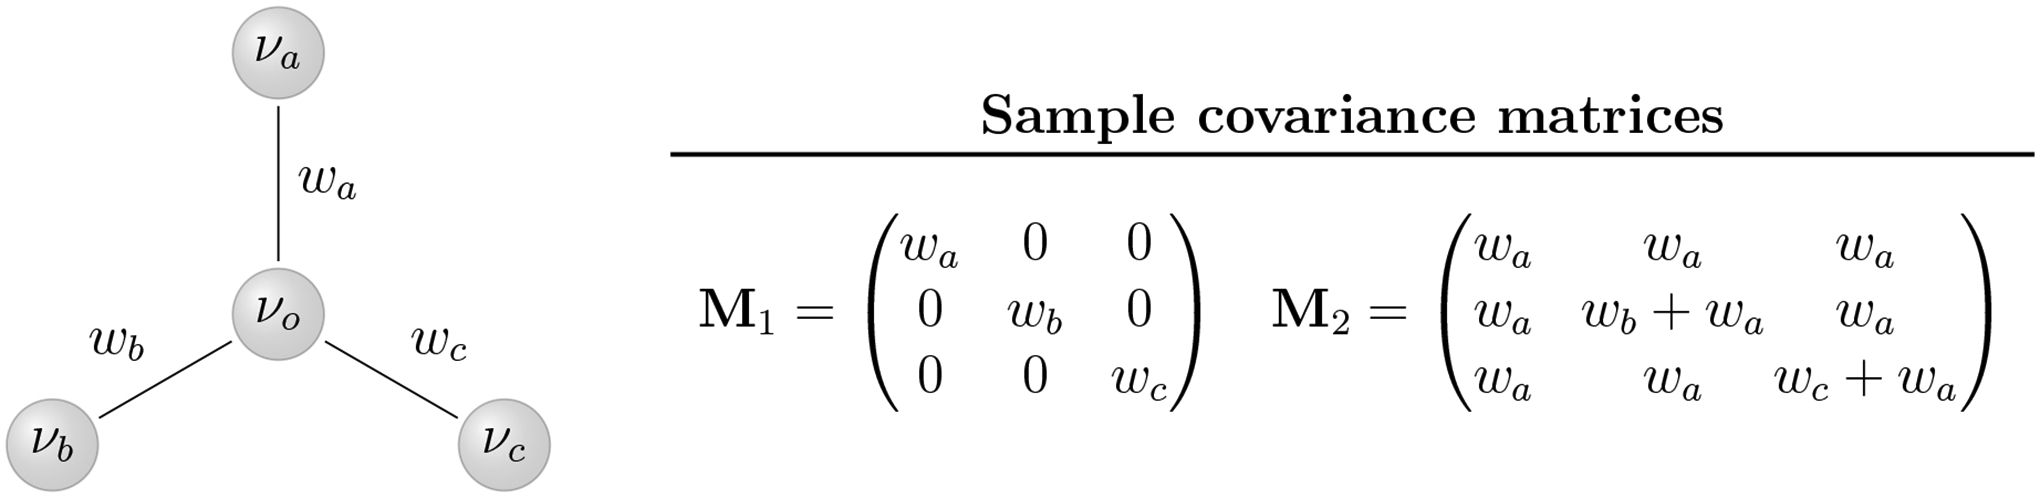
Comparative biologists are often interested in inferring covariation between multiple biological traits sampled across numerous related taxa. To properly study these relationships, we must control for the shared evolutionary history of the taxa to avoid spurious inference. An additional challenge arises as obtaining a full suite of measurements becomes increasingly difficult with increasing taxa. This generally necessitates data imputation or integration, and existing control techniques typically scale poorly as the number of taxa increases. We propose an inference technique that integrates out missing measurements analytically and scales linearly with the number of taxa by using a post-order traversal algorithm under a multivariate Brownian diffusion (MBD) model to characterize trait evolution. We further exploit this technique to extend the MBD model to account for sampling error or non-heritable residual variance. We test these methods to examine mammalian life history traits, prokaryotic genomic and phenotypic traits, and HIV infection traits. We find computational efficiency increases that top two orders-of-magnitude over current best practices. While we focus on the utility of this algorithm in phylogenetic comparative methods, our approach generalizes to solve long-standing challenges in computing the likelihood for matrix-normal and multivariate normal distributions with missing data at scale.

Keywords: Bayesian inference; matrix-normal; missing data; phylogenetics.


Figures

Figure 1:
Figure 1:
Schematic of diffusion model with stochastic link function. The data Y = (Y1, Y2, Y3)t arise from latent values Xi at the tips of the tree via the stochastic link function p(Yi |Xi) for i = 1, …, N.
Figure 2:
Figure 2:
Posterior log mean squared-error of the diffusion correlation, residual correlation, and heritability over ten simulated replicates based on three empirical examples. The boxes extend from the 25th to the 75th posterior percentiles with the middle bar representing the median. The lines extend from the 2.5th through the 97.5th percentiles, with outliers depicted as dots. The sparsity depicted by different colors represents different percentages of randomly removed data.
Figure 3:
Figure 3:
Correlation among mammalian life-history traits. The circles below the diagonal summarize the posterior mean correlation between each pair of traits. Purple represents a positive correlation while orange represents a negative correlation. Circle size and color intensity both represent the absolute value of the correlation. The numbers above the diagonal report the posterior probability that the correlation is of the same sign as its mean.
Figure 4:
Figure 4:
Prokaryote phylogeny and traits. The phylogeny depicts the inferred maximum clade credibility tree. The archaea clade (N = 54) and the associated trait measurements are depicted in grey.
Figure 5:
Figure 5:
Correlation among prokaryotic growth properties. See Figure 3 caption.
Figure 6:
Figure 6:
HIV-1 phylogeny with associated CD4 slope, SPVL, and GSVL values for each viral host.
Figure 7:
Figure 7:
Model predictive performance of HIV set-point viral load. Each box-and-whisker plot depicts the posterior mean-squared-error of prediction under a different model. The boxes represent the interquartile range, while the lines extend to include the 2.5th through 97.5th percentiles. Outliers are omitted.
Figure 8:
Figure 8:
An acyclic graph with nodes {νo, νa, νb, νc} and edge weights {wa, wb, wc}. The covariance matrix Λ = {Λij} is additive on an acyclic graph if each Λij is equal to the sum of the shared non-negative edge-weights in the paths from νi and νj to some origin node. For example, the matrix M1 is additive for nodes (νa, νb, νc)t with νo at the origin, while the matrix M2 is additive for nodes (νo, νb, νc)t with νa at the origin.

References

    1. Adams DC (2014). A method for assessing phylogenetic least squares models for shape and other high-dimensional multivariate data. Evolution 68(9), 2675–2688. - PubMed
    1. Alizon S, von Wyl V, Stadler T, Kouyos RD, Yerly S, Hirschel B, Böni J, Shah C, Klimkait T, Furrer H, Rauch A, Vernazza PL, Bernasconi E, Battegay M, Bürgisser P, Telenti A, Günthard HF, Bonhoeffer S, and Swiss HIV Cohort Study (2010, Sep). Phylogenetic approach reveals that virus genotype largely determines HIV set-point viral load. PLoS Pathogens 6(9), e1001123. - PMC - PubMed
    1. Allen G and Tibshirani R (2010). Transposable regularized covariance models with an application to missing data imputation. Annals of Applied Statistics 4, 764–790. - PMC - PubMed
    1. Aptekmann AA and Nadra AD (2018). Core promoter information content correlates with optimal growth temperature. Scientific Reports 8(1), 1313. - PMC - PubMed
    1. Bastide P, Ané C, Robin S, and Mariadassou M (2018). Inference of adaptive shifts for multivariate correlated traits. Systematic Biology 67(4), 662–680. - PubMed