

Current trends in COVID-19 diagnosis and its new variants in physiological fluids: Surface antigens, antibodies, nucleic acids, and RNA sequencing
- PMID: 36060607
- PMCID: PMC9425703
- DOI: 10.1016/j.trac.2022.116750
Current trends in COVID-19 diagnosis and its new variants in physiological fluids: Surface antigens, antibodies, nucleic acids, and RNA sequencing
Abstract
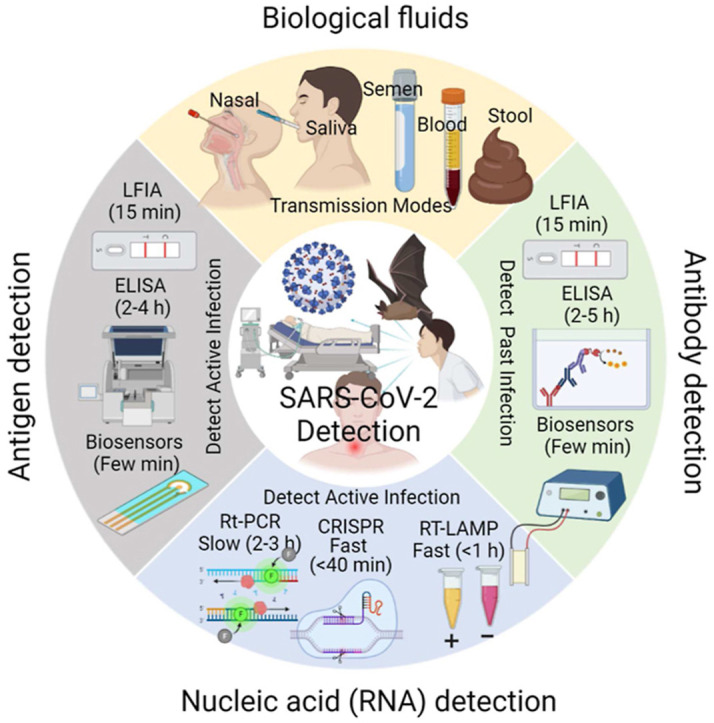
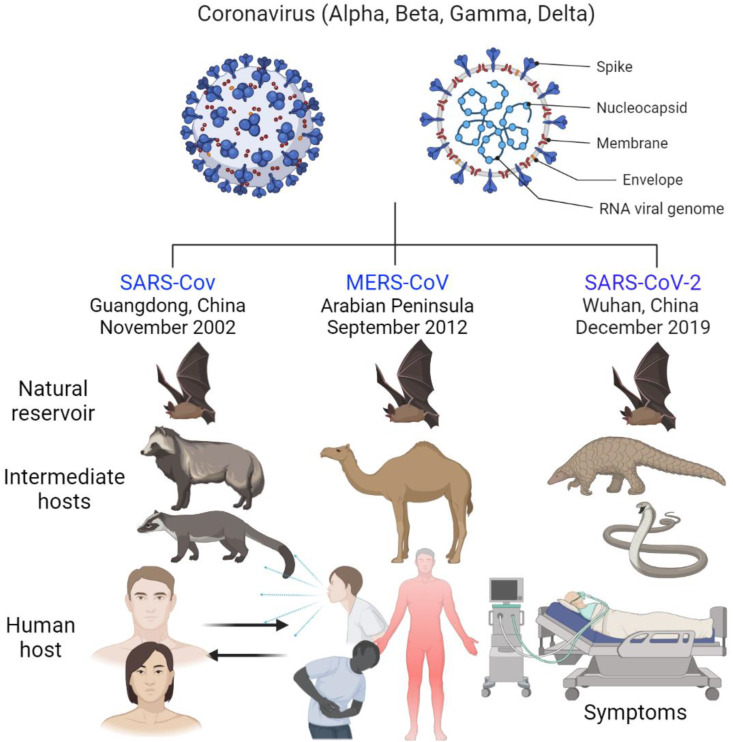
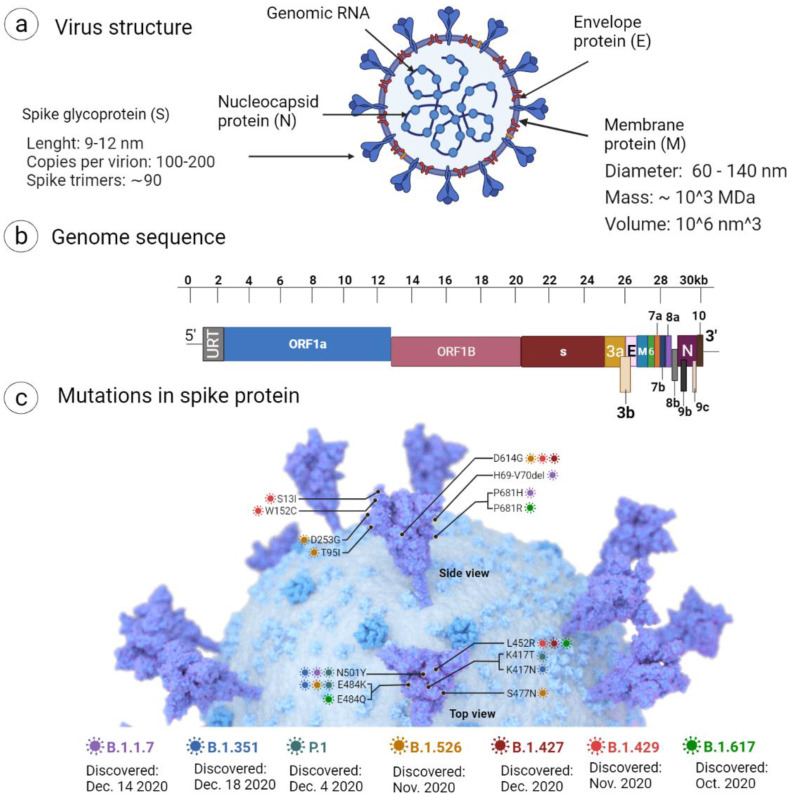
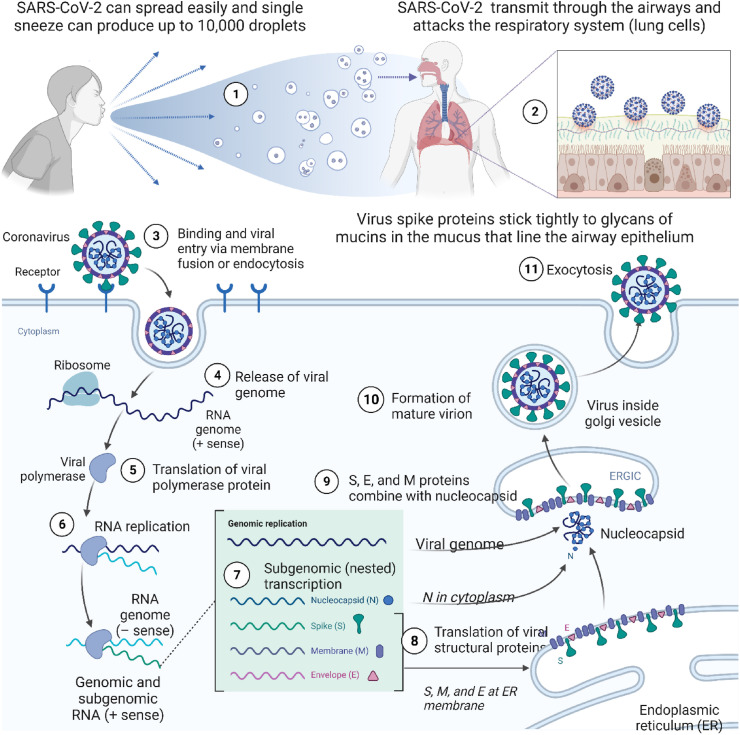
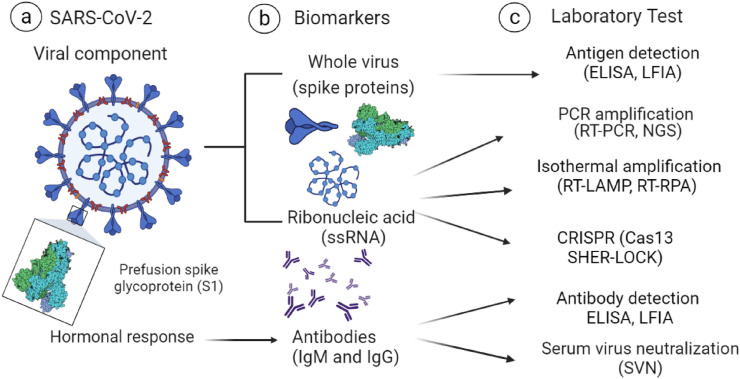
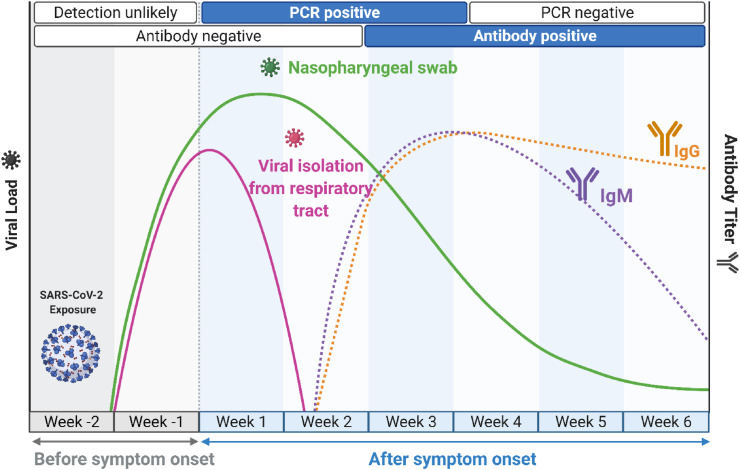
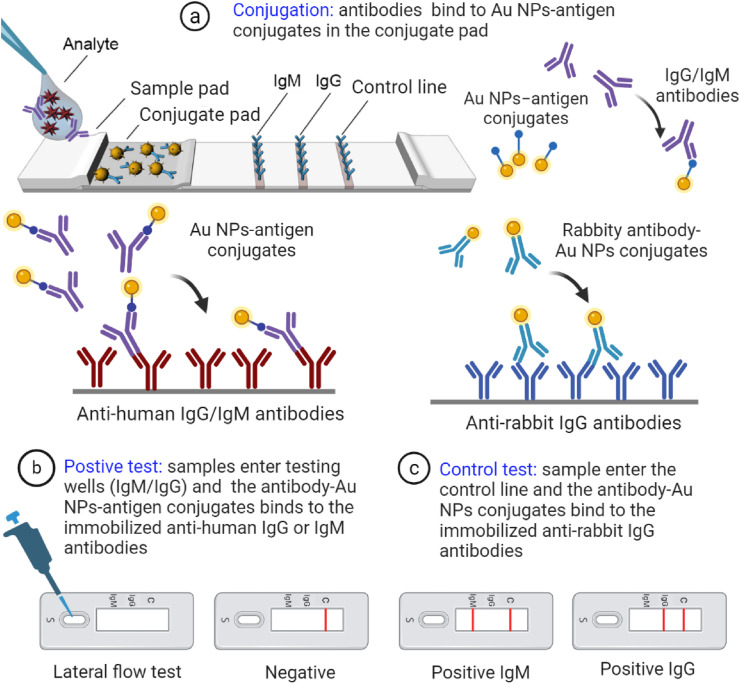
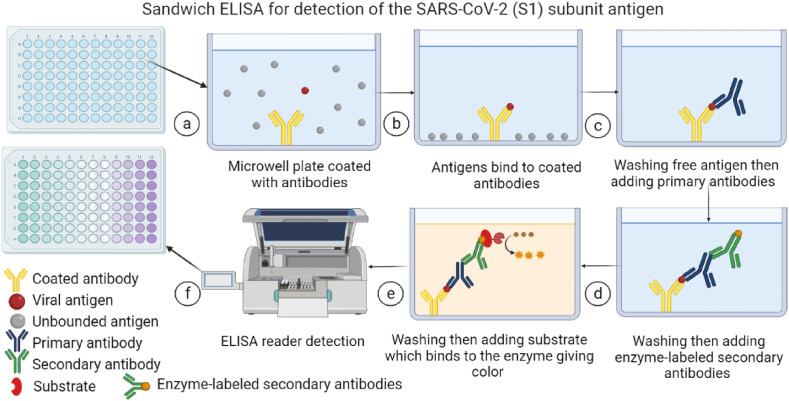
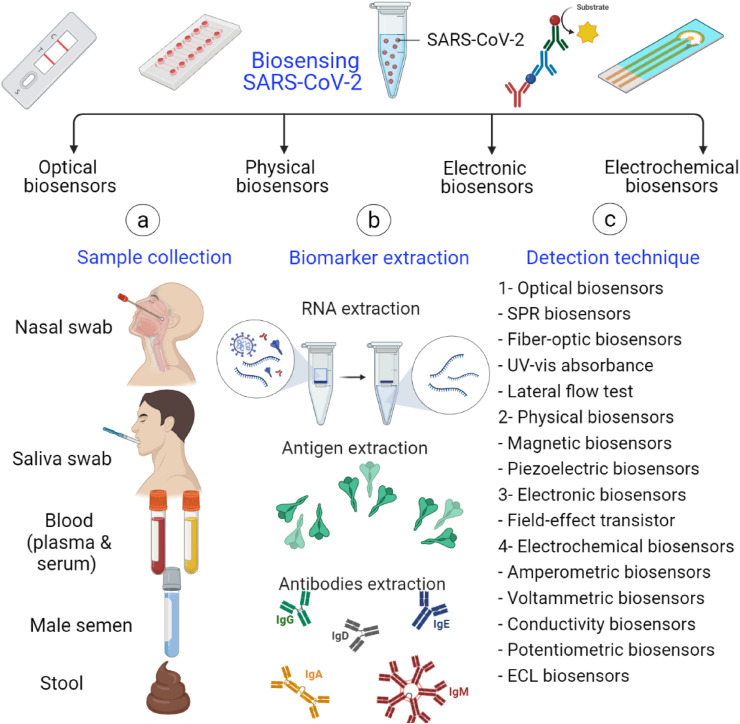
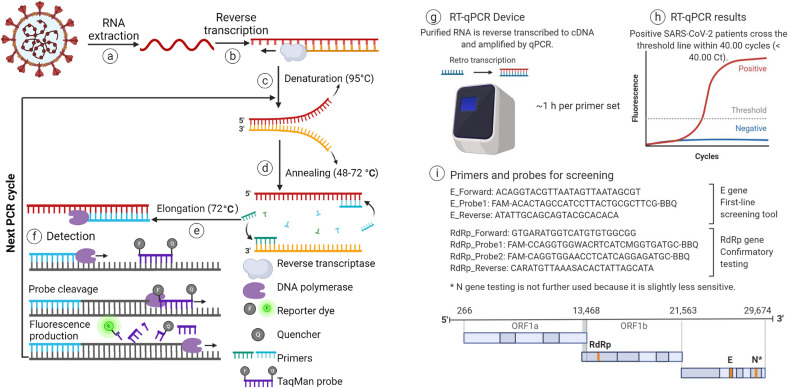
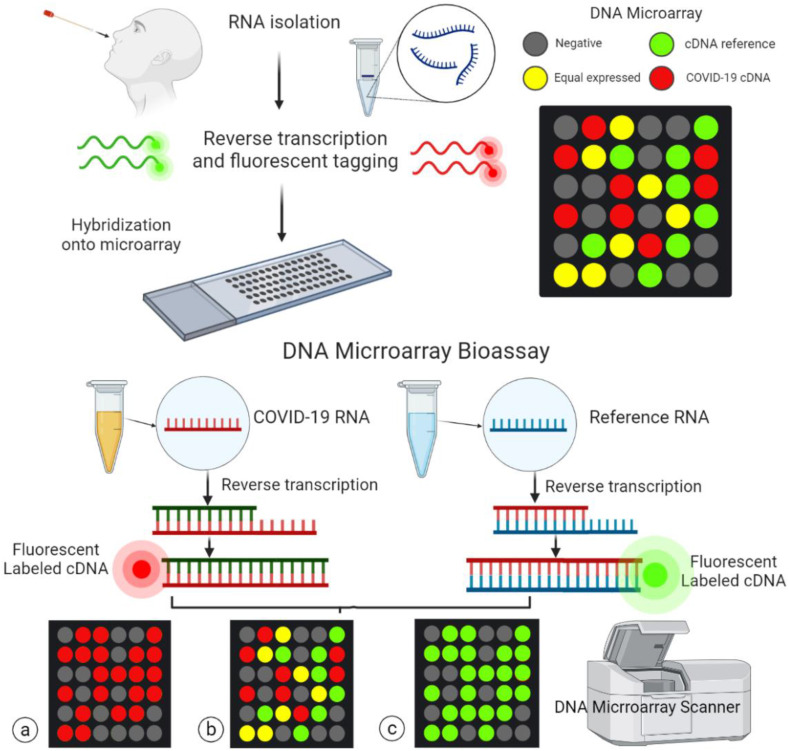
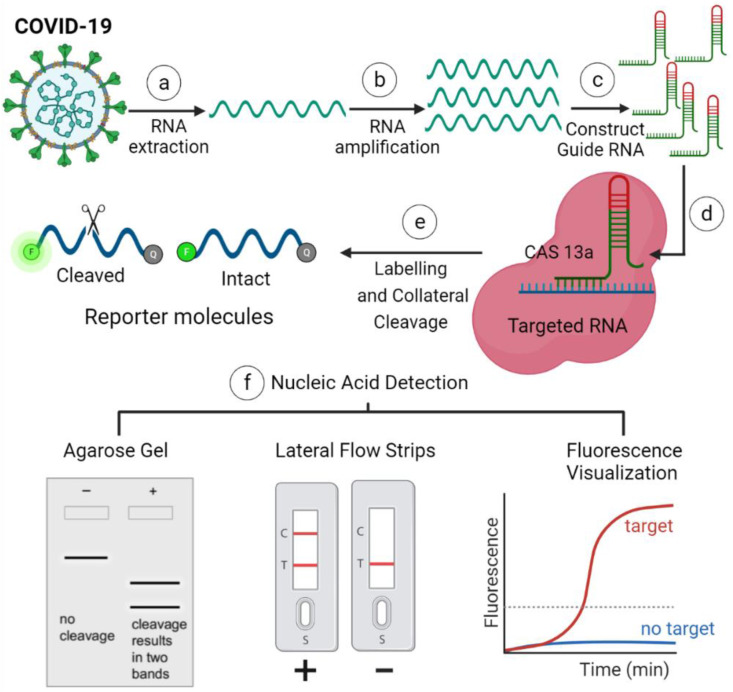
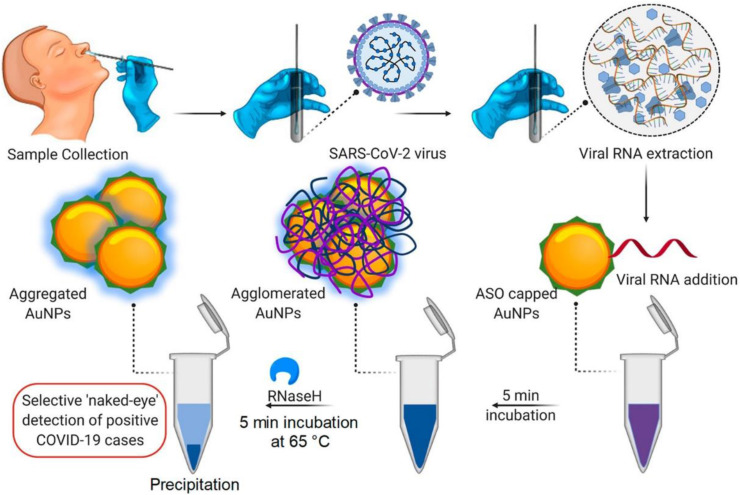
Rapid, highly sensitive, and accurate virus circulation monitoring techniques are critical to limit the spread of the virus and reduce the social and economic burden. Therefore, point-of-use diagnostic devices have played a critical role in addressing the outbreak of COVID-19 (SARS-CoV-2) viruses. This review provides a comprehensive overview of the current techniques developed for the detection of SARS-CoV-2 in various body fluids (e.g., blood, urine, feces, saliva, tears, and semen) and considers the mutations (i.e., Alpha, Beta, Gamma, Delta, Omicron). We classify and comprehensively discuss the detection methods depending on the biomarker measured (i.e., surface antigen, antibody, and nucleic acid) and the measurement techniques such as lateral flow immunoassay (LFIA), enzyme-linked immunosorbent assay (ELISA), reverse transcriptase-polymerase chain reaction (RT-PCR), reverse transcription loop-mediated isothermal amplification (RT-LAMP), microarray analysis, clustered regularly interspaced short palindromic repeats (CRISPR) and biosensors. Finally, we addressed the challenges of rapidly identifying emerging variants, detecting the virus in the early stages of infection, the detection sensitivity, selectivity, and specificity, and commented on how these challenges can be overcome in the future.
Keywords: Biosensors; COVID-19 virus diagnosis; Clustered regularly interspaced short palindromic repeats; Enzyme-linked immunosorbent assay; Lateral flow immunoassay; Loop-mediated isothermal amplification; Microarray assays; Reverse transcriptase-polymerase chain reaction.
© 2022 The Authors.
Conflict of interest statement
The authors declare that they have no known competing financial interests or personal relationships that could have appeared to influence the work reported in this paper.
Figures

Similar articles
-
Current state of diagnostic, screening and surveillance testing methods for COVID-19 from an analytical chemistry point of view.Microchem J. 2021 Aug;167:106305. doi: 10.1016/j.microc.2021.106305. Epub 2021 Apr 19. Microchem J. 2021. PMID: 33897053 Free PMC article.
-
Recent advances in methods for the diagnosis of Corona Virus Disease 2019.J Clin Lab Anal. 2022 Jan;36(1):e24178. doi: 10.1002/jcla.24178. Epub 2021 Dec 17. J Clin Lab Anal. 2022. PMID: 34921443 Free PMC article. Review.
-
FnCas9-based CRISPR diagnostic for rapid and accurate detection of major SARS-CoV-2 variants on a paper strip.Elife. 2021 Jun 9;10:e67130. doi: 10.7554/eLife.67130. Elife. 2021. PMID: 34106048 Free PMC article.
-
Comparative evaluation of RT-PCR and antigen-based rapid diagnostic tests (Ag-RDTs) for SARS-CoV-2 detection: performance, variant specificity, and clinical implications.Microbiol Spectr. 2024 Jun 4;12(6):e0007324. doi: 10.1128/spectrum.00073-24. Epub 2024 Apr 29. Microbiol Spectr. 2024. PMID: 38683014 Free PMC article.
-
[Recent advances in clustered regularly interspaced short palindromic repeats-based detection of severe acute respiratory syndrome coronavirus 2].Se Pu. 2022 Sep;40(9):773-781. doi: 10.3724/SP.J.1123.2022.08001. Se Pu. 2022. PMID: 36156623 Free PMC article. Review. Chinese.
Cited by
-
Luminescence Probes in Bio-Applications: From Principle to Practice.Biosensors (Basel). 2024 Jul 8;14(7):333. doi: 10.3390/bios14070333. Biosensors (Basel). 2024. PMID: 39056609 Free PMC article. Review.
-
Implantable Electrochemical Microsensors for In Vivo Monitoring of Animal Physiological Information.Nanomicro Lett. 2023 Dec 12;16(1):49. doi: 10.1007/s40820-023-01274-4. Nanomicro Lett. 2023. PMID: 38087121 Free PMC article. Review.
-
Circulating and Salivary NGF and BDNF Levels in SARS-CoV-2 Infection: Potential Predictor Biomarkers of COVID-19 Disease-Preliminary Data.J Pers Med. 2022 Nov 9;12(11):1877. doi: 10.3390/jpm12111877. J Pers Med. 2022. PMID: 36579579 Free PMC article.
-
Efficacy of different mouthwashes against COVID-19: A systematic review and network meta-analysis.Jpn Dent Sci Rev. 2023 Dec;59:334-356. doi: 10.1016/j.jdsr.2023.09.003. Epub 2023 Oct 11. Jpn Dent Sci Rev. 2023. PMID: 37854066 Free PMC article. Review.
-
Computationally Designed Epitope-Mediated Imprinted Polymers versus Conventional Epitope Imprints for the Detection of Human Adenovirus in Water and Human Serum Samples.ACS Sens. 2024 Apr 26;9(4):1831-1841. doi: 10.1021/acssensors.3c02374. Epub 2024 Mar 15. ACS Sens. 2024. PMID: 38489767 Free PMC article.
References
-
- Oran D.P., Topol E.J. 2020. Prevalence of Asymptomatic SARS-CoV-2 Infection; pp. 362–367. Https://Doi.Org/10.7326/M20-3012. 173. - DOI - PMC - PubMed
-
- Struyf T., Deeks J.J., Dinnes J., Takwoingi Y., Davenport C., Leeflang M.M., Spijker R., Hooft L., Emperador D., Domen J., Horn S.R.A., Van den Bruel A., C.C.-19 D.T.A. Group Signs and symptoms to determine if a patient presenting in primary care or hospital outpatient settings has COVID-19. Cochrane Database Syst. Rev. 2021 doi: 10.1002/14651858.CD013665.PUB2. 2021. - DOI - PMC - PubMed
Publication types
LinkOut - more resources
Full Text Sources
Miscellaneous