. 2022 Aug 26:2022:2877679.
doi: 10.1155/2022/2877679. eCollection 2022.

Identification and Validation of Immune Markers in Coronary Heart Disease

Affiliations

Identification and Validation of Immune Markers in Coronary Heart Disease

Yuxiong Pan et al. Comput Math Methods Med. .

Retraction in

Abstract

Background: Coronary heart disease (CHD) is an ischemic heart disease involving a variety of immune factors. This study was aimed at investigating unique immune and m6A patterns in patients with CHD by gene expression in peripheral blood mononuclear cells (PBMCs) and at identifying novel immune biomarkers.

Methods: The CIBERSORT algorithm and single-sample gene set enrichment analysis (ssGSEA) were applied to assess the population of specific infiltrating immunocytes. Weighted Gene Coexpression Network Analysis (WGCNA) was utilized on immune genes matching CHD. A prediction model based on core immune genes was constructed and verified by a machine learning model. Unsupervised cluster analysis identified various immune patterns in the CHD group according to the abundance of immune cells. Methylation of N6 adenosine- (m6A-) related gene was identified from the literature, and t-distributed stochastic neighbor embedding (t-SNE) analysis was used to determine the rationality of the m6A classification. The association between m6A-related genes and various immune cells was estimated using heat maps.

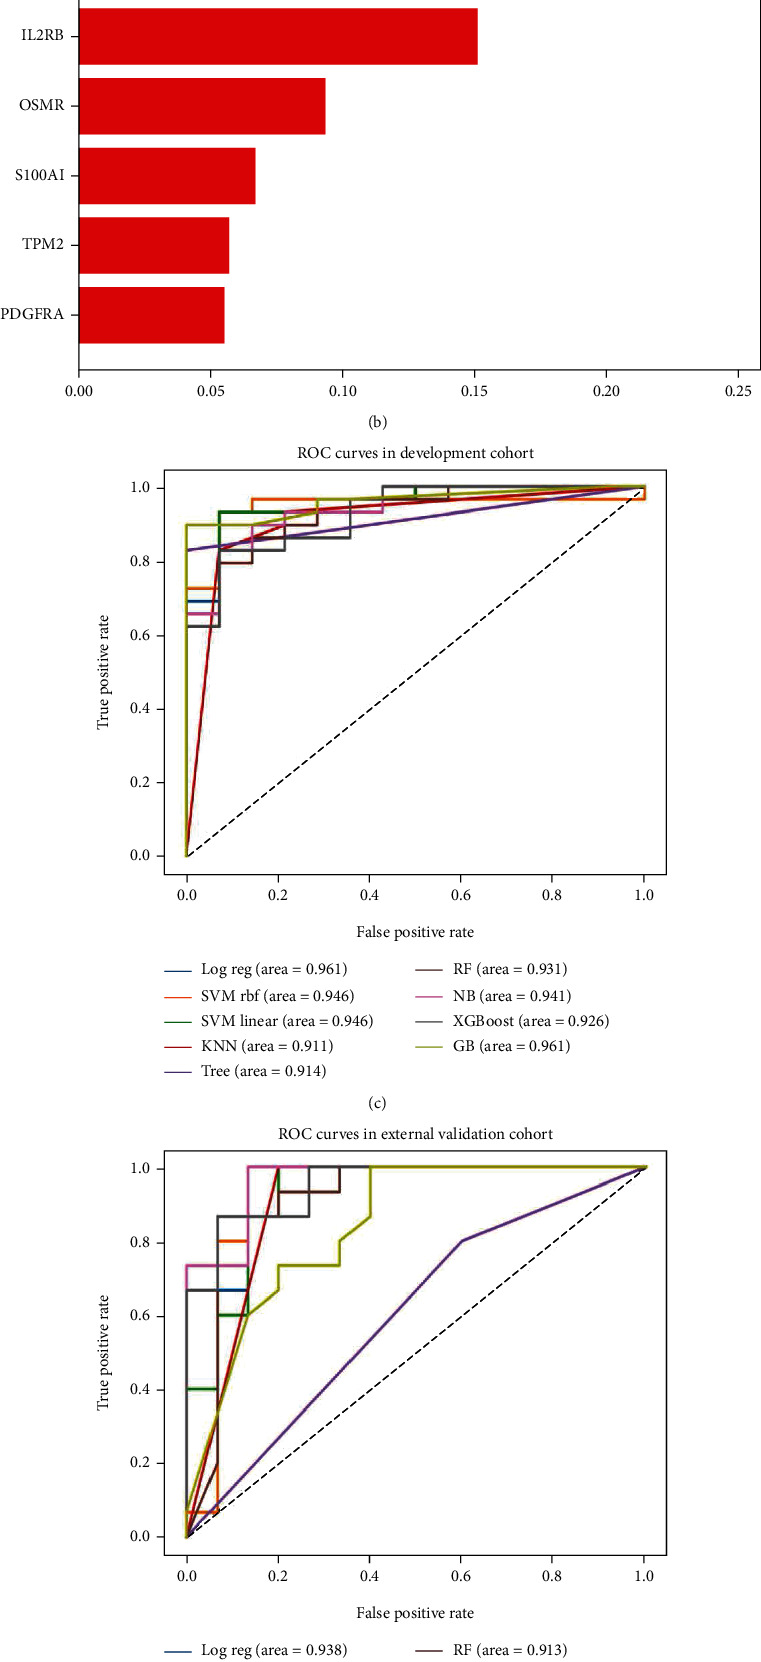
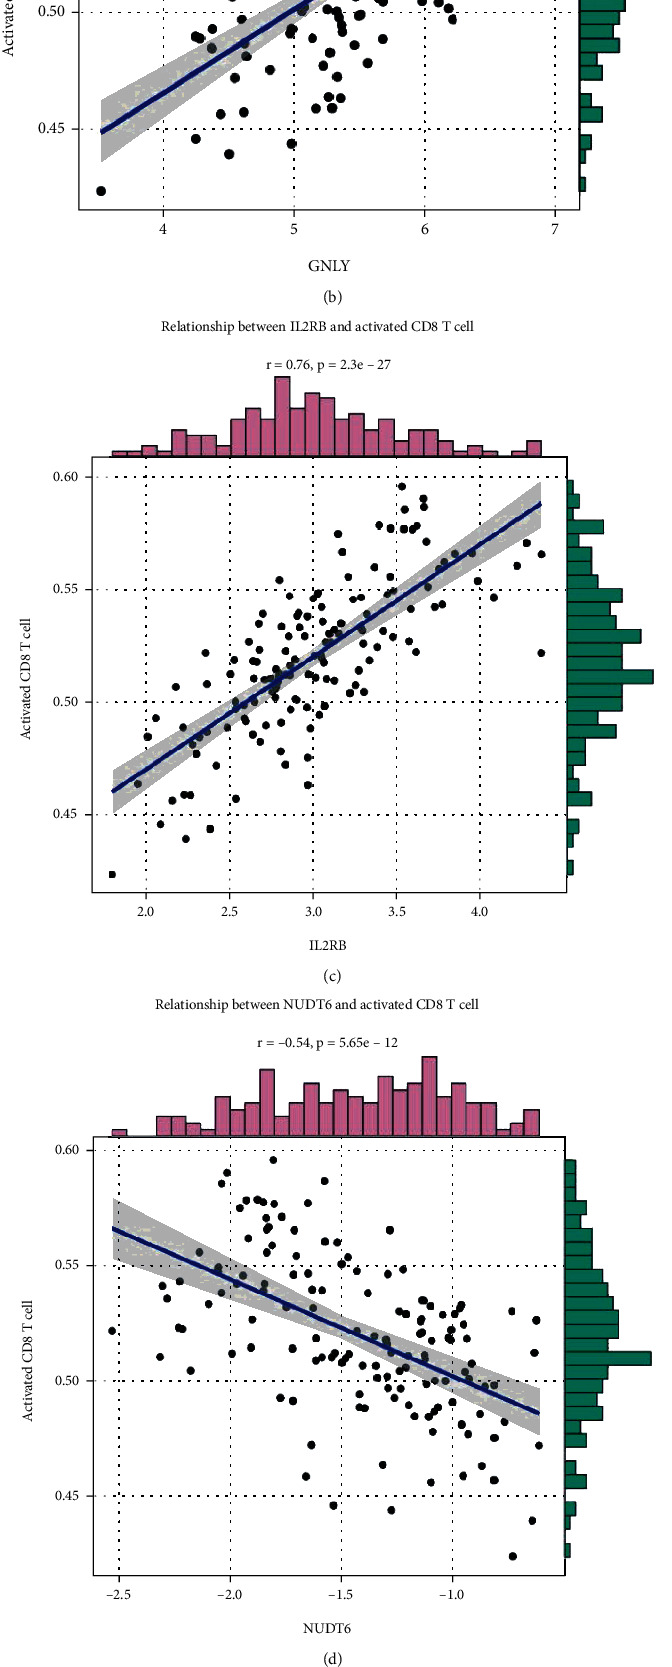
Results: 22/28 immune-associated cells differed between the CHD and normal groups, and a significant difference was detected in the expression of 21 m6A-related genes. The proportion of immune-related cells (activated CD4+ T cells and CD8+ T cells) in the peripheral blood of the CHD group was lower than that of the normal group. The immune genes were divided into four modules, of which the turquoise modules showed a significant association with coronary heart disease. Eight hub immune genes (PDGFRA, GNLY, OSMR, NUDT6, FGFR2, IL2RB, TPM2, and S100A1) can well distinguish the CHD group from the normal group. Two different immune patterns were identified in the CHD group. Interestingly, a significant association was detected between the m6A-related genes and immune cell abundance.

Conclusion: In conclusion, we identified different immune and m6A patterns in CHD. Thus, it could be speculated that the immune system plays a crucial role in CHD, and m6A is correlated with immune genes.


Conflict of interest statement

The authors have declared that no competing interest exists.

Figures

Figure 1
Figure 1
(a) The differences in immune cell abundance between the coronary heart disease and control group were calculated by the ssGSEA method based on the transcriptome profile. The Wilson test method was used to compare the difference in immune cell levels between CHD and the normal group. (b) By using the ESTIMATE algorithm, the CHD group had lower immune scores than the normal group. (c) The proportion of immune cells was calculated by the ssGSEA algorithm for all samples. The first 93 samples were from patients with coronary heart disease, and the last 43 samples were from the normal group.
Figure 2
Figure 2
(a) The cluster dendrogram of genes in GSE113079. Each branch in the figure represents one gene, and every color below represents one coexpression module. (b) Heat map plot of the adjacencies in the hub gene network. (c) Heat map of the association between modules and the illness status of CHD. The turquoise module was shown to be more correlated with CHD. (d) By the WGCNA method, we calculated the module membership and gene significance score of each gene. This figure shows a relationship between module membership score in the turquoise module and gene significance score for CHD.
Figure 3
Figure 3
(a) Correlation heat map of common DEGs in GSE9874 and GSE113079. (b) The importance score for 11 common immune-related genes associated with CHD was obtained by random forest algorithm. (c) and (d) show construction and validation of the prediction model for CHD by nine machine learning algorithms independently. (e) qRT-PCR analysis of DEGs between the control and CHD groups. Data are presented as mean ± SEM. Statistical analysis was performed with one-way ANOVA followed by Bonferroni's correction. P < 0.05, ∗∗∗∗P < 0.0001.
Figure 4
Figure 4
(a) Correlation heat map between the 8 immune-related core genes and immune cells. (b) A significant positive correlation between GNLY and activated CD8+ T cells. (c) A significant positive correlation between IL2RB and activated CD8+ T cells. (d) A significant negative correlation between NUDT6 and activated CD8+ T cells. (e) A significant negative correlation between FGFR2 and activated CD8+ T cells.
Figure 5
Figure 5
(a) TF-gene interactions were collected using NetworkAnalyst for the common DEGs (PDGFRA, GNLY, OSMR, NUDT6, FGFR2, IL2RB, TPM2, and S100A1). (b) TF-miRNA coregulatory network for the common DEGs (PDGFRA, GNLY, OSMR, NUDT6, FGFR2, IL2RB, TPM2, and S100A1).
Figure 6
Figure 6
(a) By using cluster analysis, two different immune patterns were identified in the CHD group. We name two different immune patterns, “CHD Type1” and “CHD Type2”. (b) T-SNE was used to confirm the rationality of classification for two different immune patterns in CHD. (c) GSEA KEGG analysis of differential expressed genes between the CHD Type1 and the CHD Type2 group. (d) GSEA KEGG analysis of differential expressed genes between the CHD Type1 and the CHD Type2 group.
Figure 7
Figure 7
(a) By using the ssGSEA algorithm, it showed significant differences in immune cell abundance between CHD Type1 and CHD Type2. (b) Protein interaction of the 21 m6A-related genes. (c) Significant differences are identified in m6A-related genes between CHD and the normal group. (d) By t-SNE analysis, methylation-related genes could distinguish between the normal group and the CHD group.

References

    1. Malakar A. K., Choudhury D., Halder B., Paul P., Uddin A., Chakraborty S. A review on coronary artery disease, its risk factors, and therapeutics. Journal of Cellular Physiology . 2019;234(10):16812–16823. doi: 10.1002/jcp.28350. - DOI - PubMed
    1. McCullough P. A. Coronary artery disease. Clinical journal of the American Society of Nephrology: CJASN . 2007;2(3):611–616. doi: 10.2215/CJN.03871106. - DOI - PubMed
    1. Zhu Y., Xian X., Wang Z., et al. Research progress on the relationship between atherosclerosis and inflammation. Biomolecules . 2018;8(3):p. 80. doi: 10.3390/biom8030080. - DOI - PMC - PubMed
    1. Olson N. C., Sitlani C. M., Doyle M. F., et al. Innate and adaptive immune cell subsets as risk factors for coronary heart disease in two population-based cohorts. Atherosclerosis . 2020;300:47–53. doi: 10.1016/j.atherosclerosis.2020.03.011. - DOI - PMC - PubMed
    1. Kott K. A., Vernon S. T., Hansen T., et al. Single-cell immune profiling in coronary artery disease: the role of state-of-the-art immunophenotyping with mass cytometry in the diagnosis of atherosclerosis. Journal of the American Heart Association . 2020;9(24, article e017759) doi: 10.1161/JAHA.120.017759. - DOI - PMC - PubMed

Publication types